The CADJPY cross moved up in the Tuesday trading session, boosted by the stock market’s risk-on sentiment. Although the cross advances 2.25% during the current month, the price is under -4% (YTD).
Technical Overview
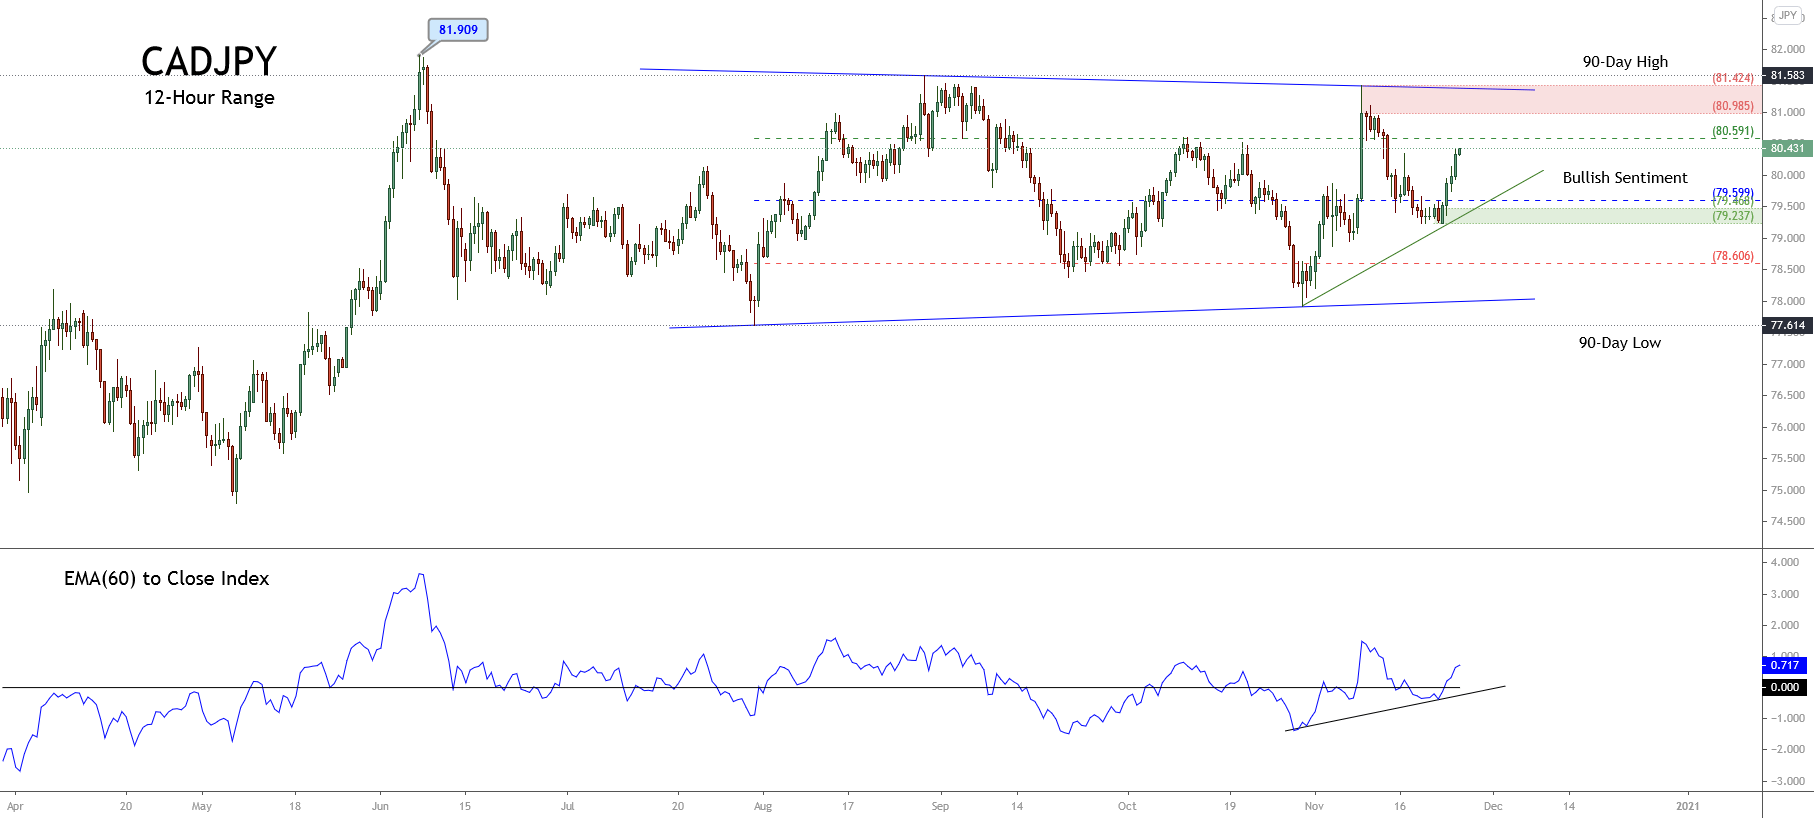
The CADJPY prices represented in the next 12-hour chart reveal the short-term market participants’ sentiment moving in the 90-day high and low range. The figure illustrates the cross advancing mostly upward in the bullish sentiment zone.
On the other hand, the previous chart presents a contracting triangle, which began in early June when CADJPY found fresh sellers on 81.909, followed by a first support level at 77.614. According to the classic chartist theory, the triangle pattern distinguishes itself as a continuation formation. In this case, this contracting triangle suggests further upsides.
In this regard, the likely next move could lead to a test of its intraday resistance of 80.591: this level corresponds to the bullish sentiment zone’s resistance, as well. If the price overcomes it and extends its upward advance, the cross could reach its supply zone between 80.985 and 81.424, a level that matches the triangle pattern’s upper trendline.
Conversely, a downward correction could drop it to its demand zone between 79.468 and 79.237.
Short-term Technical Outlook
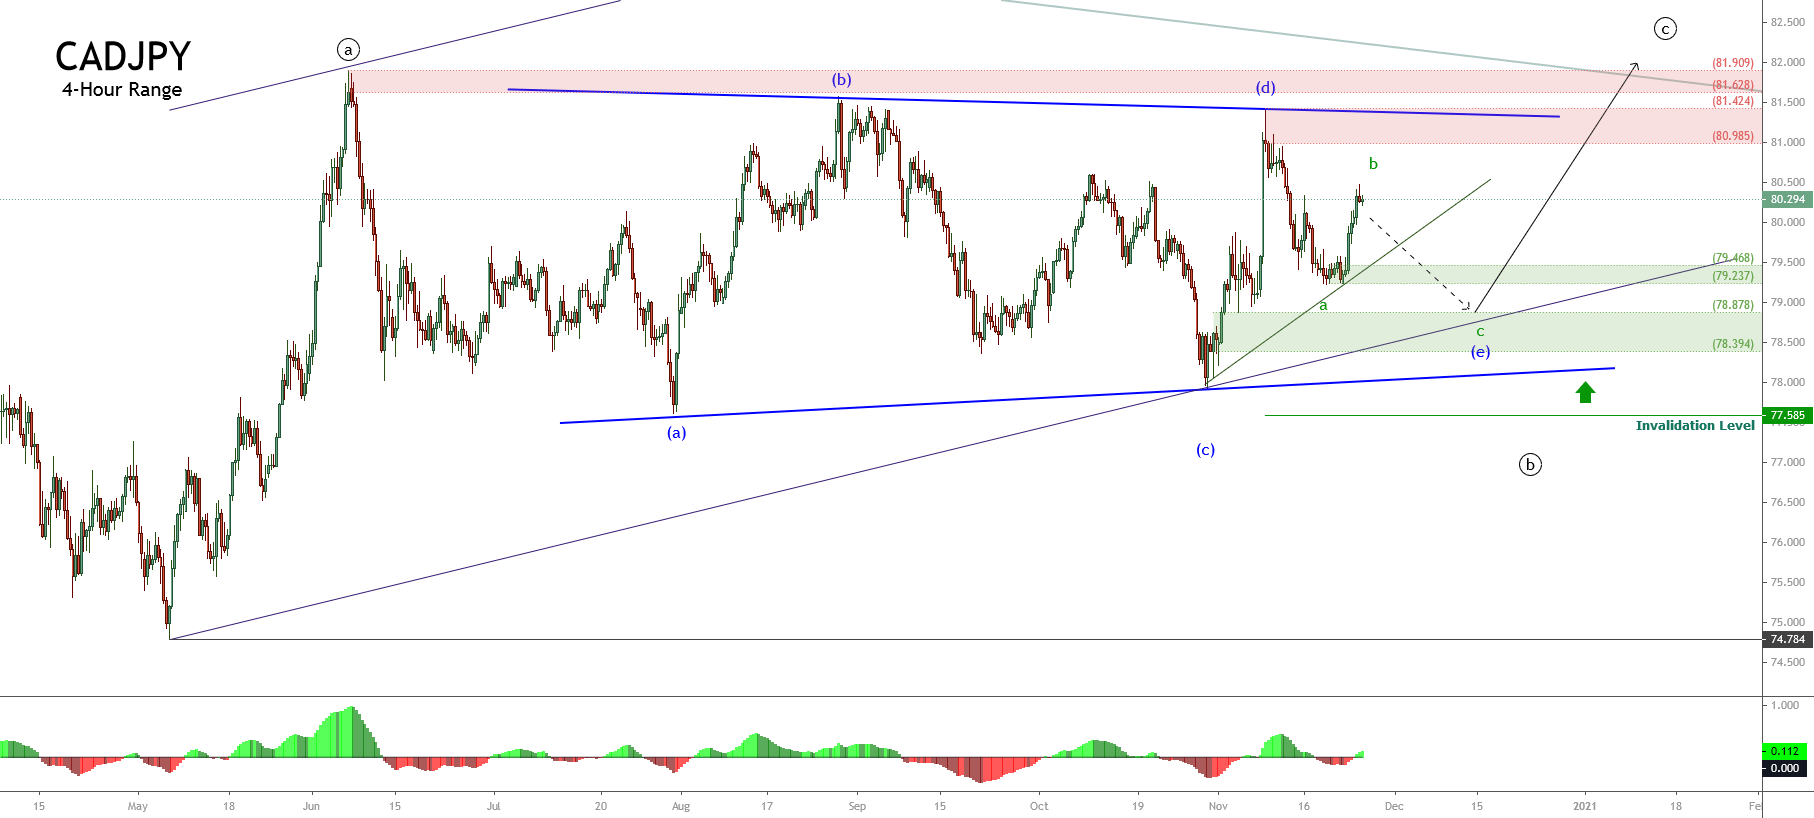
The short-term Elliott Wave view for the CADJPY cross displayed in the next 4-hour chart reveals the advance in an incomplete internal structural series of a contracting triangle pattern, which currently advances developing its wave (e) of Minuette degree, labeled in blue.
The previous chart presents the price advancing in the wave b of Subminuette degree, identified in blue, which belongs to wave (e), also in blue. According to the Elliott Wave theory, the triangle pattern follows an internal sequence subdivided into 3-3-3-3-3 waves. In this context, and observing its advance in the triangle formation, the cross could develop its latest decline before starting a rally that corresponds to wave ((c)) of Minute degree, labeled in black.
The current downward move, corresponding to wave c, in green, could reach two potential demand zones. The first one is located between 79.468 and 79.237, whereas the second one is seen from 78.878 to 78.394.
Once CADJPY starts to get fresh buyers, the cross could experience a strong rally and test June’s high zone of 81.909.
Finally, the bullish scenario has its invalidation level below the wave (a) of Minuette degree in blue located at 77.585, under the contracting triangle pattern limits.


