
This analysis discusses AUDUSD’s overall Elliott Structure, the likelihood of a short bounce in the AUDUSD, and its potential continuation.
Technical Overview
In our last AUDNZD technical analysis, the Oceanic cross was moving in an incomplete complex corrective sequence corresponding to wave (c) of Minuette degree labeled in blue, which belongs to wave ((y)) of Minute degree identified in black.
As illustrated in the following 8-hour chart corresponding to our previous mid-November analysis, we commented on the broadening corrective formation the cross develops, which implies an acceleration of the downward sequence. Also, the move that pierced below the wave (a) in blue suggested further declines in the following trading sessions.

Likewise, we observed the potential bearish reaction areas for the decline until two potential demand zones. The first one located between 1.05186 and 1.04870, and the second one bounded between 1.03511 and 1.02864.
On the other hand, according to the Elliott wave theory, a complex corrective formation as a double-three pattern follows an internal sequence subdivided into 3-3-3, where each “three” corresponds to a single complete corrective wave.
Once completed, the current corrective structural series of wave 2 or B of Minor degree, the AUDNZD cross should give way to the start wave 3 or C, in green.
Technical Outlook
The AUDNZD cross in the next 8-hour chart exposes the price action advancing in its wave iii of Subminuette degree labeled in green, which belongs to the incomplete wave (c) of Minuette degree identified in blue.
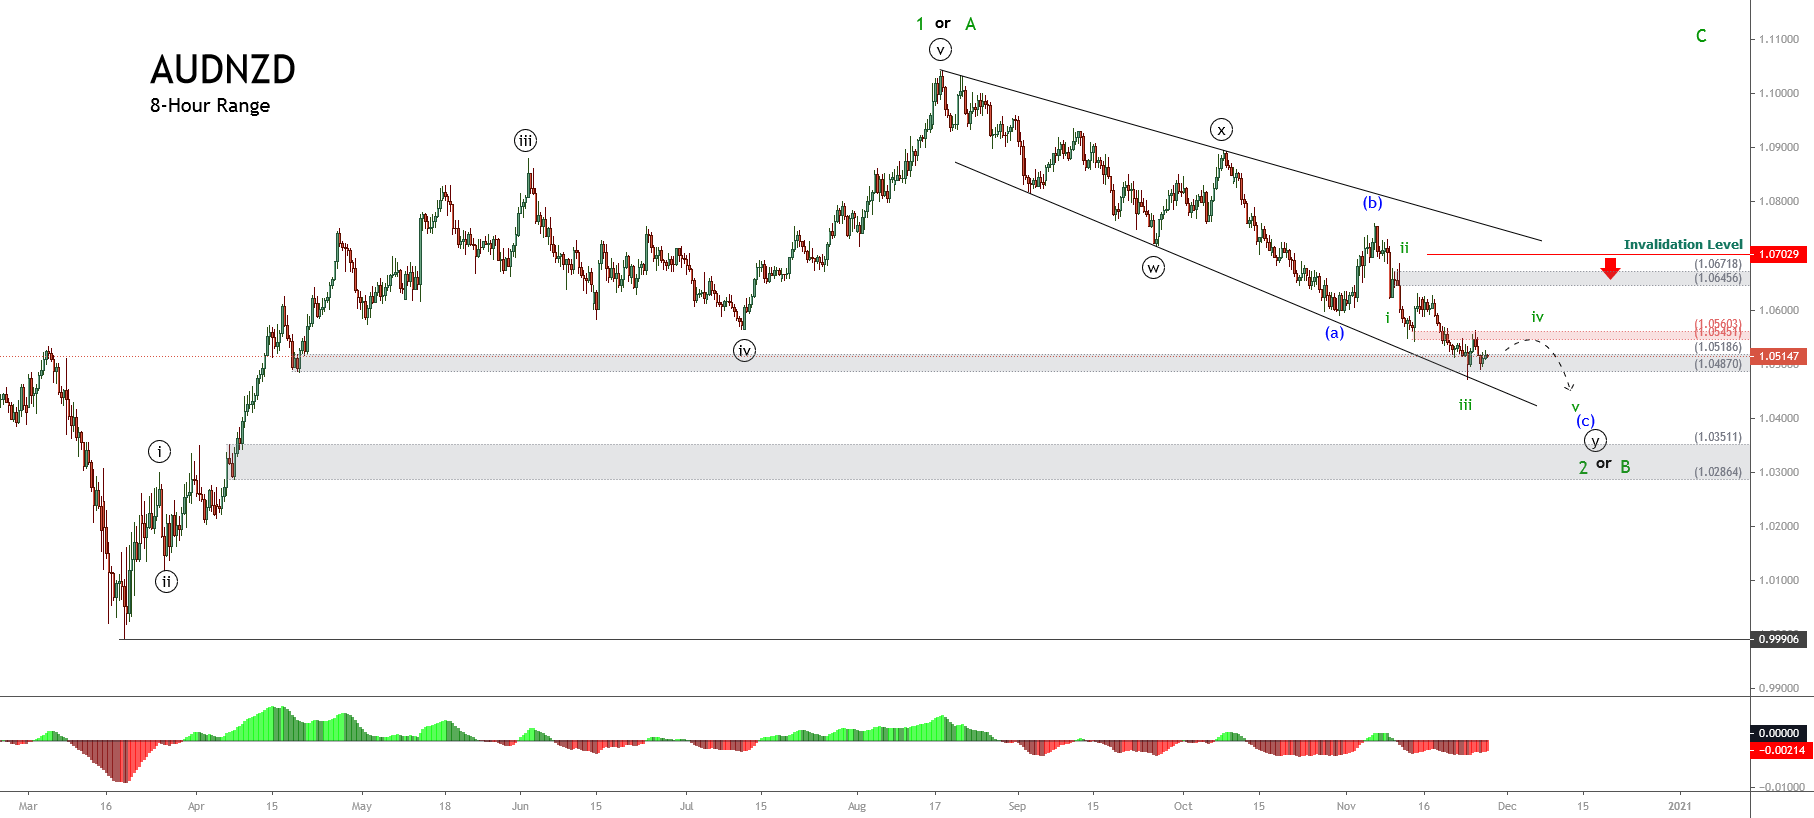
Considering the acceleration present in wave (c), the cross could develop an internal upward corrective movement corresponding to wave iv, in green. This move could find resistance in the adjacent supply zone between 1.0457 and 1.05603, where the cross could resume its downward movement, leading it to complete the wave ((y)) of Minute degree and, in consequence, wave 2 or B, in green.
Once the current downward sequence finishes, the Oceanic cross will be ready for a new long-term rally corresponding to wave 3 or C, in green, which according to the Elliott wave theory, should be the largest wave of the impulsive sequence.
Finally, the invalidation level for the short-term bearish scenario is found at 1.07029, above the end of wave ii in green.