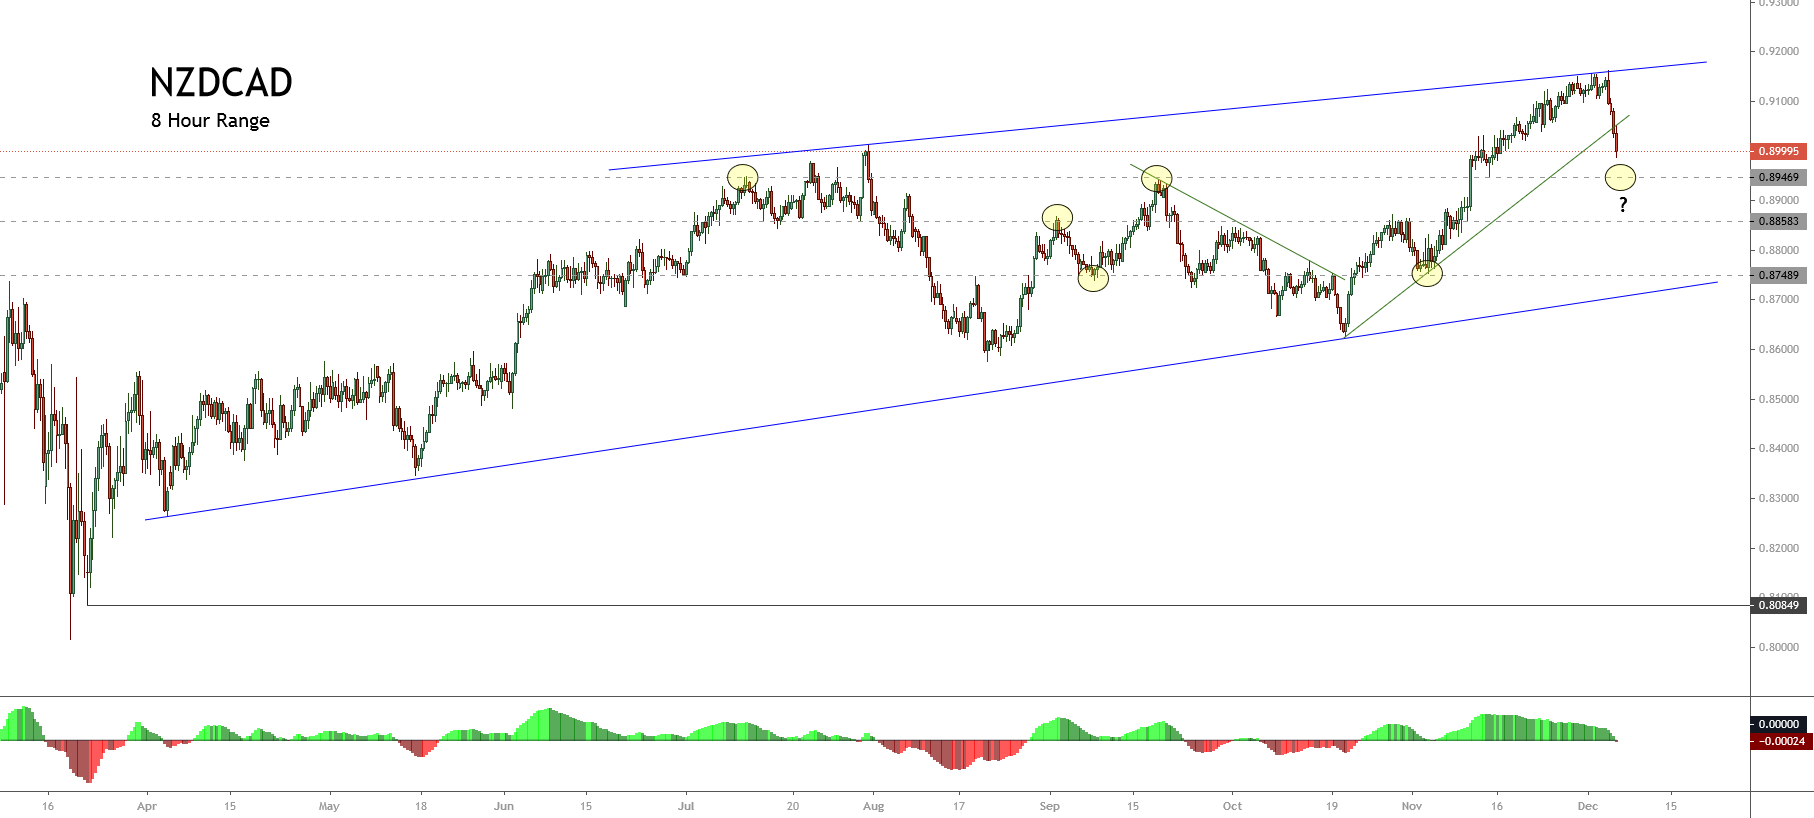
Categories
Forex Elliott Wave Forex Market Analysis

EURAUD Advances Supported by the RBA Minutes

Technical Overview

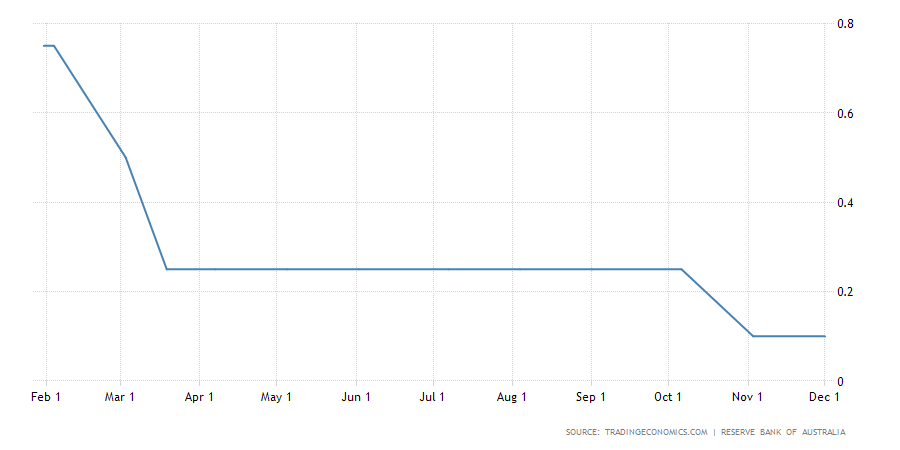
The EURAUD cross advanced on the overnight trading session, expecting the minutes from the last Reserve Australia Bank (RBA) interest rate decision meeting, where policymakers decided to keep unchanged the rate at 0.1% for the second month in a row.

Source: TradingEconomics.com

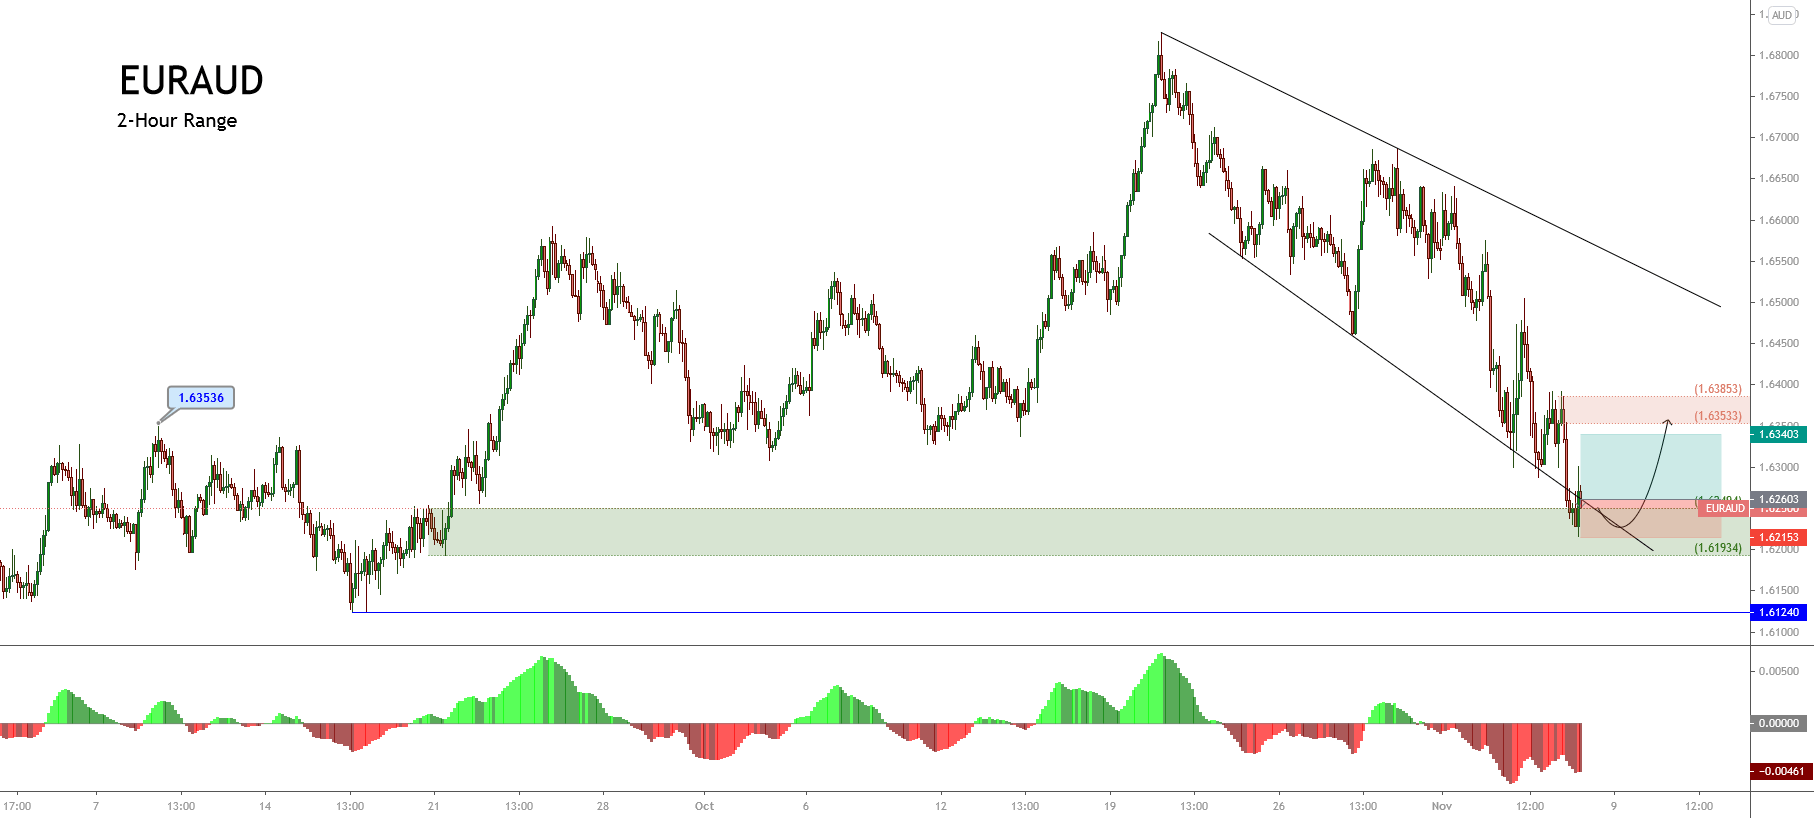
On the technical side, the following 12-hour chart shows the short-term market sentiment unfolded by the 90-day high and low range, which illustrates the cross consolidating in the extreme bearish sentiment zone

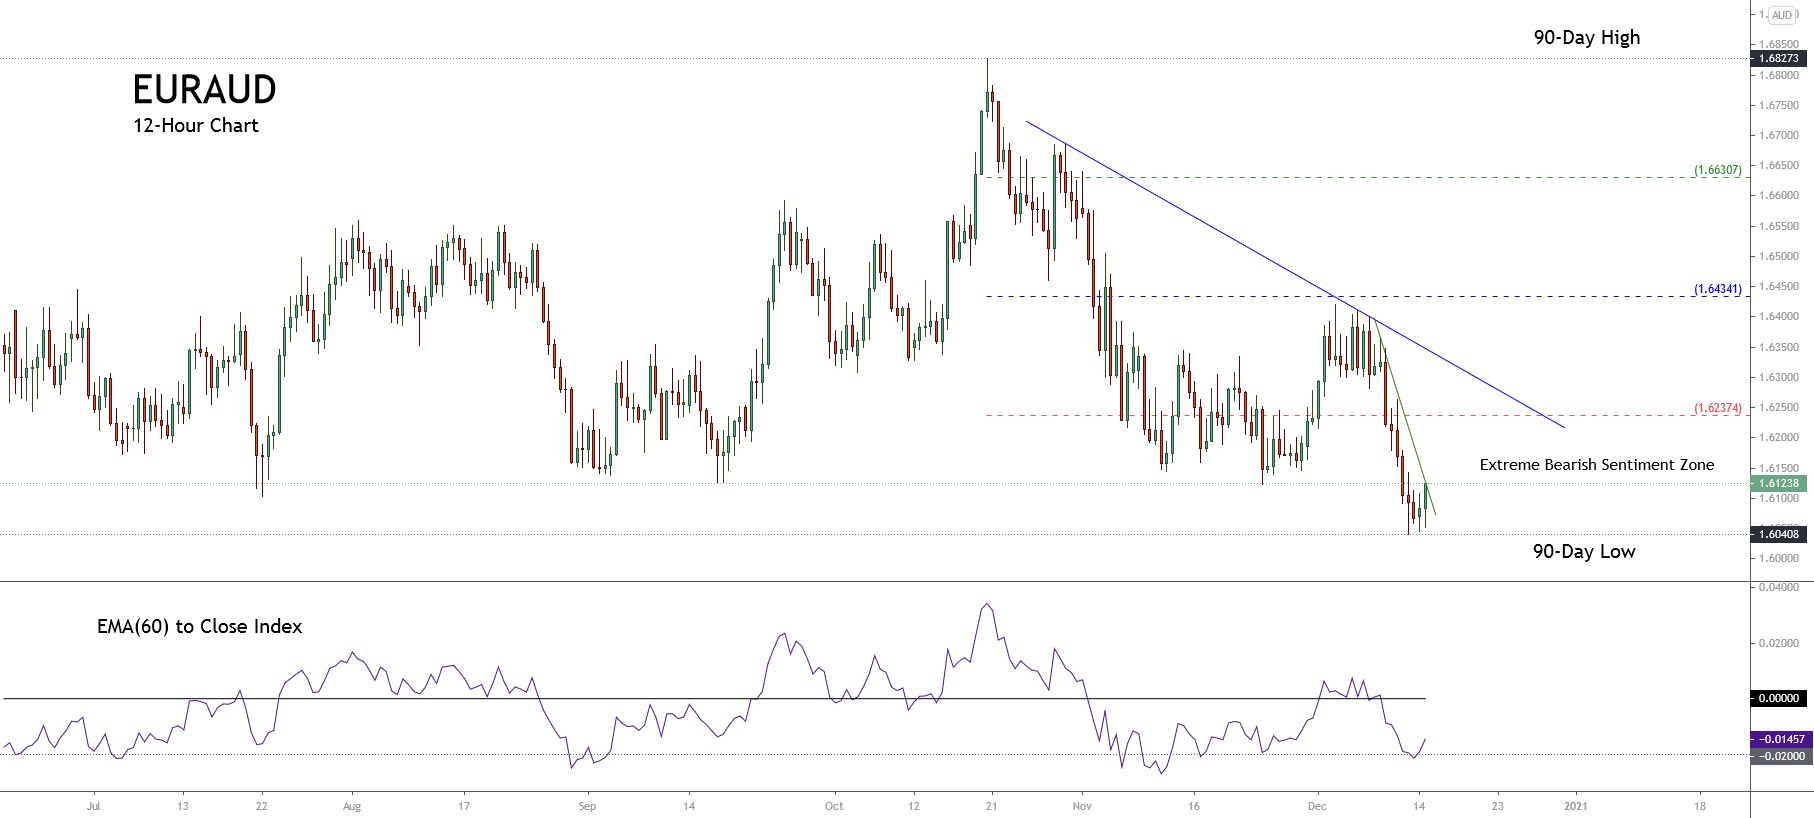
The bullish candlestick formation developed during the recent trading sessions carries to suspect the possibility of a short-term bounce. This bounce could find strike the level 1.62374 that corresponds to the resistance of the extreme bearish zone.

On the other hand, the short-term primary trend plotted in blue shows the bearish bias that remains in progress. The secondary trend also shows the intraday downward acceleration, which dragged the price until 1.60408, where the cross found support. Likewise, the bounce observed on the EMA(60) to Close Index carries to support the possibility of a limited recovery.

Technical Outlook

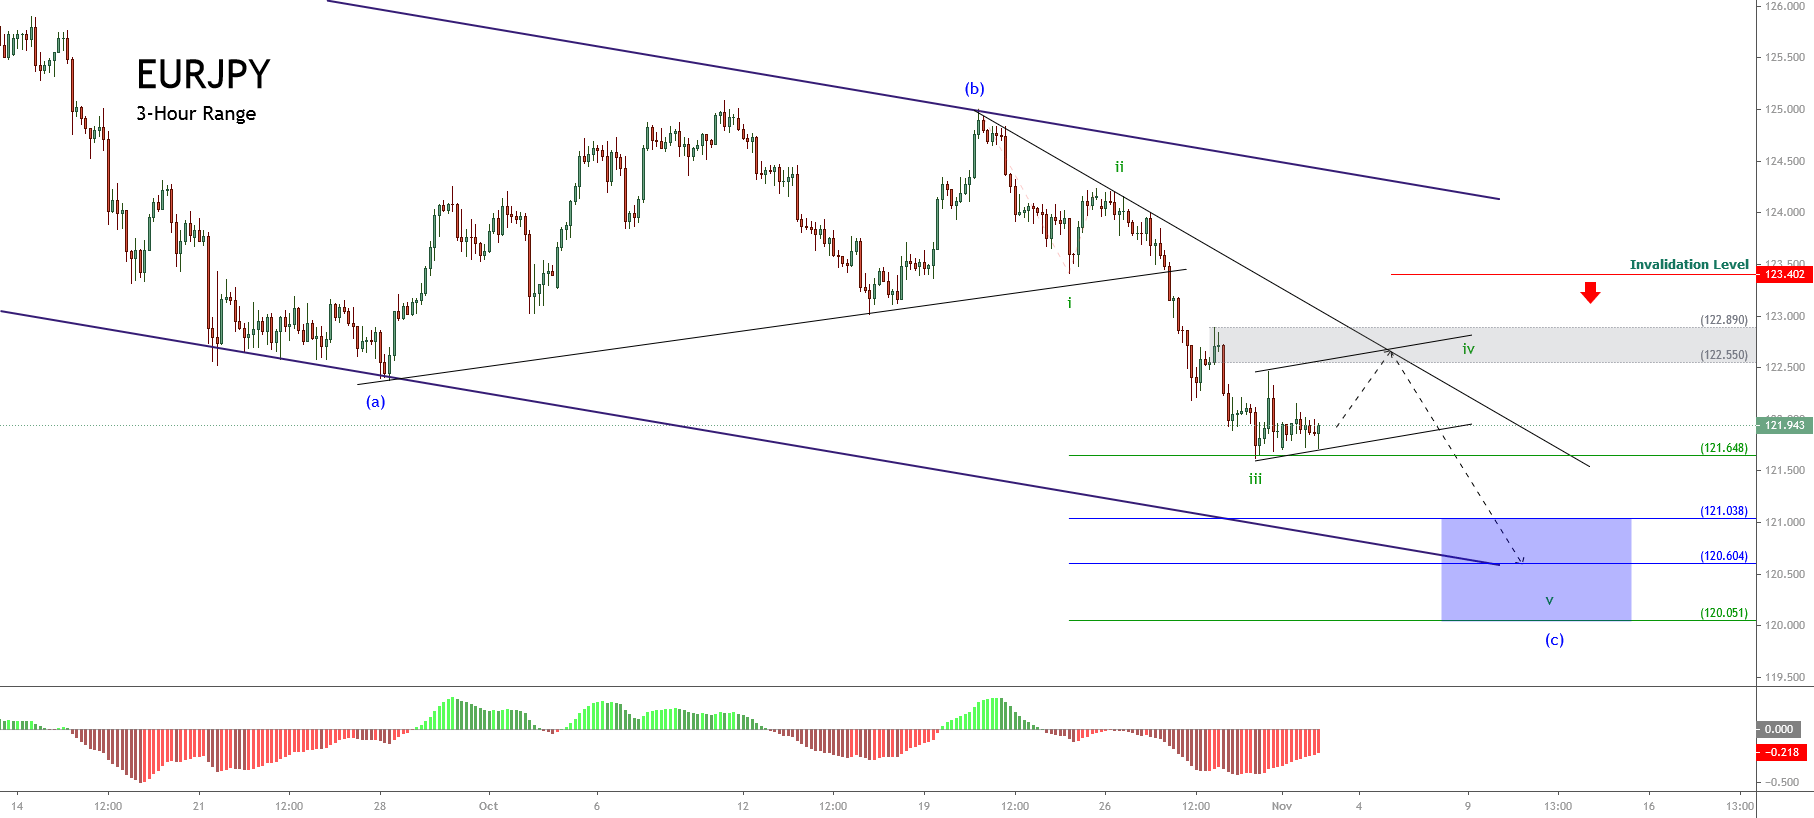
The short-term Elliott wave view for the EURAUD cross shows the downward progress of the incomplete five-wave sequence of Minute degree labeled in black, suggesting a limited recovery in the following trading sessions.

The next 4-hour chart shows the bearish movement subdivided into a five-wave sequence of Minute degree identified in black. It began on October 20th at 1.68273 and found its temporary bottom at 1.60408 on December 11th.

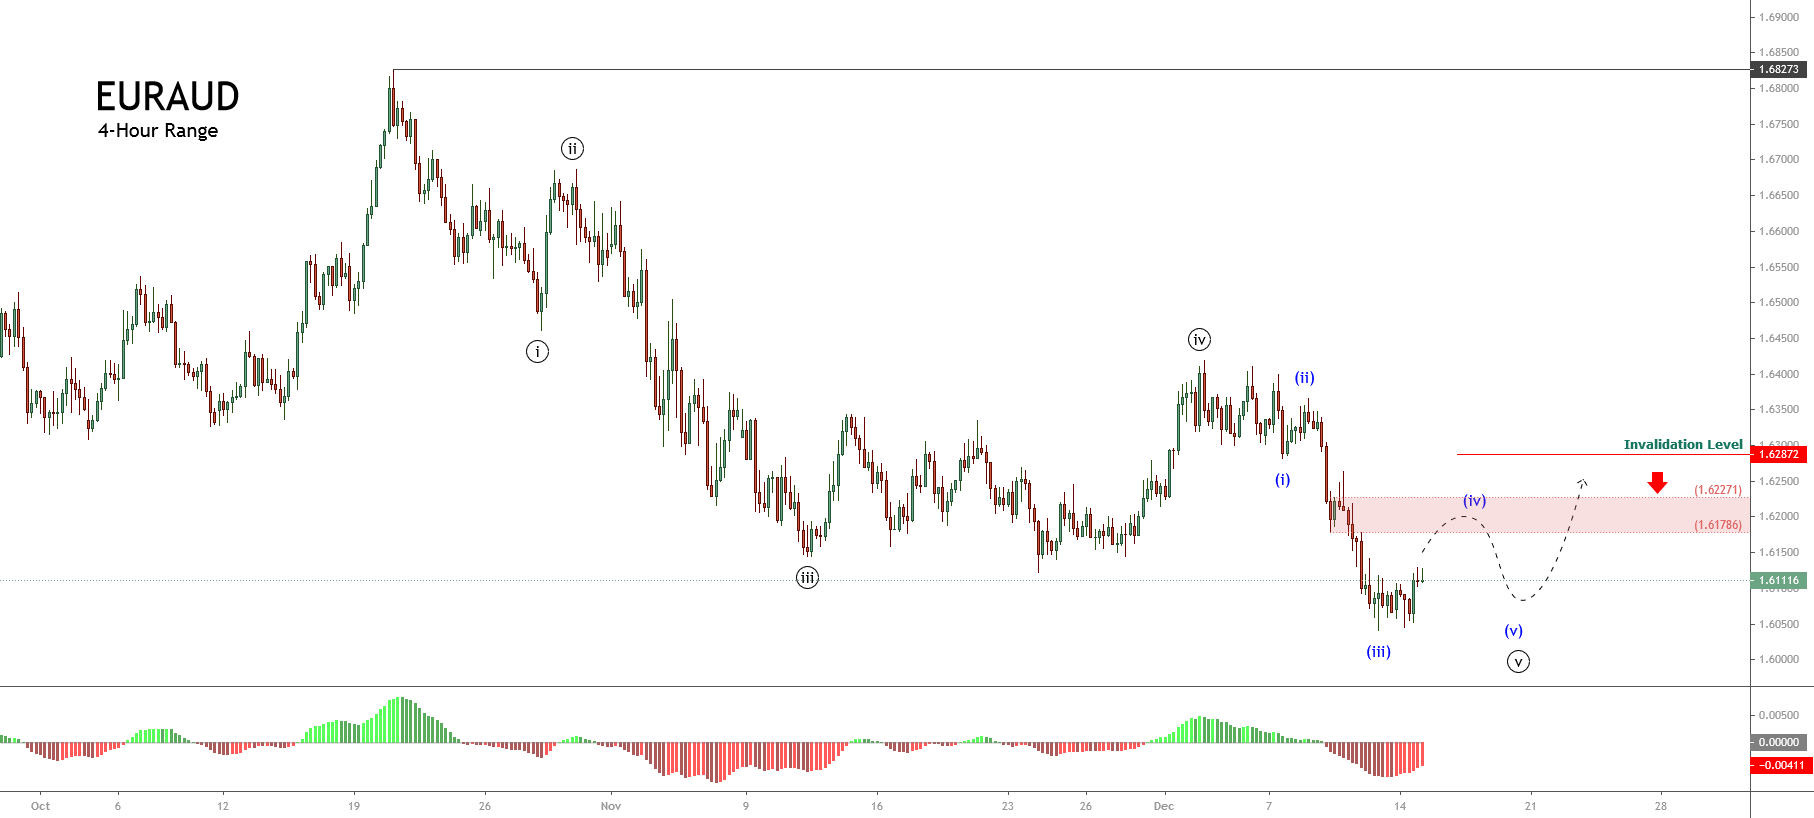
The previous figure illustrates the price looks advancing in its fifth wave in black, which after the bottom reached on the last Friday 11 session completed its wave (iii) of Minuette degree labeled in blue. In this context, according to the Elliott wave theory, the price action should start to develop a corrective formation, which could find resistance in the supply zone between 1.61786 and 1.62271.

On the other hand, considering that the wave ((iii)) in black looks like the extended wave, the fifth wave could have a limited extension. In this context, the lesser degree structure of the wave ((v)) could pierce slightly below the end of wave (iii) in blue.

In conclusion, the EURAUD cross shows the possibility of a limited recovery, which could strike the supply zone between 1.61786 and 1.62271, where the price could start to consolidate in a sideways range with support at the end of wave (iii) at 1.60408. On the other hand, if the cross surpasses the supply zone, it would indicate further recoveries, and the price could start a bullish rally. Finally, the invalidation level of the current bearish scenario locates at 1.62872.

Categories
Forex Elliott Wave Forex Technical Analysis

EURGBP Soars!, More Gains Ahead?

The EURGBP cross soared on Friday session, surpassing the psychological 0.92 barrier, advancing until the target area forecasted in our previous short-term analysis (here.)

Technical Overview

Our previous analysis discussed the completion of the complex corrective formation identified as a double-three pattern of Minute degree labeled in black, which began on last September 11th at 0.92916 and finished on November 11th at 0.88610. Likewise, after the double-three completion, the cross completed the wave B of Minor degree identified in green.

Once the EURGBP found the bottom at 0.88610, the cross began a rally corresponding to wave C. We have seen in our previous analysis the price completed wave ((ii)) at 0.88667 on November 23rd. After this completion, both the breakout of the descending trendline of the second wave in black and the strong bullish long-body candlestick formation developed in the November 27th session confirmed the start of the third wave in black.

Technical Outlook

During the last trading session of the week, the short-term Elliott wave view for the EURGBP cross exposed in the following 8-hour chart reveals the acceleration in its advance, which surpassed the supply zone between 0.92008 and 0.92181, finding resistance at 0.92298.

The impulsive upward movement observed during Friday’s session allows us to distinguish the completion of the wave ((iii)) at 0.92298 and the beginning of the fourth wave of the same degree.

In this context, the current corrective formation identified as wave ((iv)) in black could decline until the previous supply zone between 0.90686 and 0.90446, where the cross could find fresh buyers. Once the fourth wave completes, the cross should advance in a new rally corresponding to wave ((v)), which would be subdivided into a five-wave sequence. The potential target for the end of wave C is within the next supply zone between 0.92568 and 0.92916.

In summary, the EURGBP cross appears moving in an incomplete wave C of Minor degree, which, in its lesser degree count, shows the beginning of the fourth wave in black. This corrective formation could decline until the previous supply zone is located between 0.90446 and 0.90686. The cross, then, could find fresh buyers expecting the continuation of the trend that would push up the price toward the supply zone between 0.92568 and 0.92916.

Lastly, the invalidation level for this bullish scenario can be found at 0.90031.

Categories
Forex Market Analysis

NZDCAD Heavy Drops driven by a Sharp Shift in Market Sentiment

In the last trading week, the NZDCAD cross  90-Day market sentiment declined from the extreme bullish to the bullish sentiment zone. The move was helped by the Canadian unemployment rate figures, which declined to 8.5% in November, beating the analysts’ expectations of 8.9%. 

Source: TradingEconomics.com

The last unemployment rate reading represents an improvement in the Canadian labor market, which showed a slight decline to 8.9% in October. On the other hand, during the current year, the data gathered from Statistics Canada stated that the record unemployment high was Mays figure of 13.7%, its highest level in more than four decades.

Technical Overview

The following 8-hour chart illustrates the market participants’ sentiment unfolded in the 90-day high and low range, revealing an aggressive decline in the Friday 04th trading session where the cross dropped over 1.7%. 

In this context, the downgrade on the market sentiment leads us to expect a corrective movement. This potential drop could find support in the neutral zone of 0.88698. Likewise, the descending of the NZDCAD EMA(60) to Close index below the zero-line drives us to anticipate a consolidation during the coming trading sessions before continuing a further decline.

Technical Outlook

The NZDCAD cross in its 8-hourly chart illustrates the mid-term uptrend that began on March 18th once the price confirmed its bottom of 0.80849. The primary trend plotted in blue reveals that the bull market remains intact.

Likewise, the breakdown observed in the last ascending secondary trend identified in green reveals a short-term correction with three potential key support levels: 0.89469, 0.88583, and 0.87489. Each of these levels shows a zone where the price action developed a polarization movement.

The following 2-hour chart shows an impulsive movement, which began on October 20th when the price found support at 0.86270. After completing its third wave of Minuette degree, in blue, the NZDCAD cross found resistance on December 03rd at 0.91630, where it started a decline in an incomplete corrective sequence that could correspond to wave (iv), in blue.

In this context, the cross could develop two potential scenarios:

  • The first scenario occurs if the price completes the third wave on 0.91630. In this case, the cross could advance mostly sideways in its wave (iv), in blue. In this scenario, the cross could find support in the demand zone between 0.89723 and 0.89490, where the price could begin to advance in its wave (v) of Minuette degree at least to the 0.9163 level.
  • The second scenario: considers an alternative count and occurs if the NZDCAD cross completes a wave (v), in blue, on 0.91630. If that is the case, it implies the price is currently advancing in a corrective formation of Minuette degree. Thus, the price could create a decline in a three-wave sequence toward the next demand zone between 0.88437 until 0.88234. 

In both scenarios, the invalidation level is found below the origin of wave (i) at 0.86270.

Categories
Forex Elliott Wave Forex Market Analysis

EURJPY Advances Toward Key Supply Zone

In our latest EURJPY analysis, we commented on its advance in an incomplete corrective structure identified as a triangle pattern, which remains in development since mid-2014.

Technical Overview

Also, we saw that the mid-term trend looks like an incomplete corrective structure, which seems to advance in a wave B of Minor degree, labeled in green. Moreover, the structure observed previously unveiled the progress in an incomplete wave ((b)), identified in black, which should develop a bounce toward the supply zone between 125.285 and 126.123.

The price action is currently seen advancing in its wave (c) of Minuette degree, labeled in blue, which has now reached the supply zone between 125.285 and 126.123 forecasted in our previous analysis.

On the other hand, the current wave (c), in blue, that remains in development could extend its gains toward the psychological barrier of 126, where the cross could start to decline to the wave ((c)), in black. This bearish sequence, possibly developed with five internal segments, should complete the wave B of Minor degree, in green.

Short- term Technical Outlook

The EURJPY in its 2-hour chart reveals the internal structure created by the wave (c), in blue, which shows the intraday ascending channel plotted in green. The price action that has surpassed the ascending channel’s upper line suggests the rise of the third wave of Subminuette degree labeled in green that is in progress.

In this context, according to the Elliott Wave theory, once the EURJPY completes the advance of the third wave, in green, the cross should experience a limited decline corresponding to the fourth wave in green. This drop could reach the demand zone between 124.931 and 125.128, where the price could find fresh buyers expecting the price to head toward new highs.

The fifth wave’s potential target zone, in green, is located between 125.939 and 126.497. In this area, the cross could complete the wave ((b)) of Minute degree in black. 

Finally, the invalidation level of this intraday bullish scenario is found at 124.566, which corresponds to the top of the first wave of Minute degree.

Categories
Forex Elliott Wave Forex Market Analysis

Is AUDUSD Turning Bearish?

In our previous technical analysis of the AUDUSD pair, we mentioned the potential corrective formation that was developing. In particular, we warned about the progress of an incomplete fourth wave of Minute degree identified in black, in which the pair was advancing on the wave (b) of Minutette degree in blue.

Technical Overview

As the previous chart shows, the price action seems moving in a mid-term sideways channel. This formation has been evolving since early September, when the price topped at 0.74134. In terms of the Elliott Wave theory, the figure shows the progression of a likely incomplete flat pattern (3-3-5).

In this context, the bearish rejection below September’s high of 0.74134 should confirm the end of wave (b), in blue, and the beginning of wave (c). Also, according to Elliott’s textbook, the coming wave (c) should follow an internal sequence subdivided into five waves.

The big picture of the AUDUSD pair currently reveals the gray box’s rejection suggested in our previous analysis. From here, the Aussie could start to decline in a five-wave sequence corresponding to the already mentioned wave (c) of Minuette degree, labeled in blue. 

Moreover, after wave (c) completes, the Australian currency should also end its wave ((iv)) of Minute degree in black and giving way to a new impulsive wave corresponding to the fifth wave of the same degree.

Short-term Technical Outlook

The AUDUSD price exposed in the next 2-hour chart reveals the completion of wave c of Subminuette degree identified in green, which topped at 0.74076 on November 30th, as the price action developed an ending diagonal pattern.

Once the price touched the psychological barrier of 0.74, the price began to decline, developing a breakdown below the baseline of the ending diagonal pattern, piercing the demand zone between 0.73492 and 1.73571, where the Aussie started a consolidation in the current trading session.

Considering that the pair started to consolidate, we expect an intraday sideways formation, likely a flag pattern. In this context, if the price breaks and closes below the baseline of this flag pattern, the AUDUSD could confirm the bearish continuation, which could make it drop to the next demand zone between 0.72654 and 0.72801.

Likewise, the price could extend its declines toward the next demand zone between 0.71449 and 0.71651. The movement, developed into a five-wave sequence, should complete the wave (c) of Minuette degree identified in blue, which, at the same time, could confirm the end of wave ((iv)) of Minute degree labeled in black, as we said earlier.

The invalidation level corresponding to this downward scenario is placed at the high of wave c, in green,  0.74076.

Categories
Forex Elliott Wave Forex Market Analysis Forex Technical Analysis

AUDNZD: Potential Bounce among Overall Weakness

This analysis discusses AUDUSD’s overall Elliott Structure, the likelihood of a short bounce in the AUDUSD, and its potential continuation.

Technical Overview

In our last AUDNZD technical analysis, the Oceanic cross was moving in an incomplete complex corrective sequence corresponding to wave (c) of Minuette degree labeled in blue, which belongs to wave ((y)) of Minute degree identified in black. 

As illustrated in the following 8-hour chart corresponding to our previous mid-November analysis, we commented on the broadening corrective formation the cross develops, which implies an acceleration of the downward sequence. Also, the move that pierced below the wave (a) in blue suggested further declines in the following trading sessions.

Likewise, we observed the potential bearish reaction areas for the decline until two potential demand zones. The first one located between 1.05186 and 1.04870, and the second one bounded between 1.03511 and 1.02864.

On the other hand, according to the Elliott wave theory, a complex corrective formation as a double-three pattern follows an internal sequence subdivided into 3-3-3, where each “three” corresponds to a single complete corrective wave.

Once completed, the current corrective structural series of wave 2 or B of Minor degree, the AUDNZD cross should give way to the start wave 3 or C, in green.

Technical Outlook

The AUDNZD cross in the next 8-hour chart exposes the price action advancing in its wave iii of Subminuette degree labeled in green, which belongs to the incomplete wave (c) of Minuette degree identified in blue. 

Considering the acceleration present in wave (c), the cross could develop an internal upward corrective movement corresponding to wave iv, in green. This move could find resistance in the adjacent supply zone between 1.0457 and 1.05603, where the cross could resume its downward movement, leading it to complete the wave ((y)) of Minute degree and, in consequence, wave 2 or B, in green. 

Once the current downward sequence finishes, the Oceanic cross will be ready for a new long-term rally corresponding to wave 3 or C, in green, which according to the Elliott wave theory, should be the largest wave of the impulsive sequence.

Finally, the invalidation level for the short-term bearish scenario is found at 1.07029, above the end of wave ii in green.


Categories
Forex Elliott Wave Forex Market Analysis Forex Technical Analysis

Would you Trade this CADJPY Pattern?

The CADJPY cross moved up in the Tuesday trading session, boosted by the stock market’s risk-on sentiment. Although the cross advances 2.25% during the current month, the price is under -4% (YTD).

Technical Overview

The CADJPY prices represented in the next 12-hour chart reveal the short-term market participants’ sentiment moving in the 90-day high and low range. The figure illustrates the cross advancing mostly upward in the bullish sentiment zone.

On the other hand, the previous chart presents a contracting triangle, which began in early June when CADJPY found fresh sellers on 81.909, followed by a first support level at 77.614. According to the classic chartist theory, the triangle pattern distinguishes itself as a continuation formation. In this case, this contracting triangle suggests further upsides.

In this regard, the likely next move could lead to a test of its intraday resistance of 80.591: this level corresponds to the bullish sentiment zone’s resistance, as well. If the price overcomes it and extends its upward advance, the cross could reach its supply zone between 80.985 and 81.424, a level that matches the triangle pattern’s upper trendline.

Conversely, a downward correction could drop it to its demand zone between 79.468 and 79.237.

Short-term Technical Outlook

The short-term Elliott Wave view for the CADJPY cross displayed in the next 4-hour chart reveals the advance in an incomplete internal structural series of a contracting triangle pattern, which currently advances developing its wave (e) of Minuette degree, labeled in blue.

The previous chart presents the price advancing in the wave b of Subminuette degree, identified in blue, which belongs to wave (e), also in blue. According to the Elliott Wave theory, the triangle pattern follows an internal sequence subdivided into 3-3-3-3-3 waves. In this context, and observing its advance in the triangle formation, the cross could develop its latest decline before starting a rally that corresponds to wave ((c)) of Minute degree, labeled in black.

The current downward move, corresponding to wave c, in green, could reach two potential demand zones. The first one is located between 79.468 and 79.237, whereas the second one is seen from 78.878 to 78.394.

Once CADJPY starts to get fresh buyers, the cross could experience a strong rally and test June’s high zone of 81.909.

Finally, the bullish scenario has its invalidation level below the wave (a) of Minuette degree in blue located at 77.585, under the contracting triangle pattern limits.

Categories
Forex Elliott Wave Forex Market Analysis

Is EURGBP Ready for an Elliott Wave Rally?

Technical Overview

The EURGBP cross develops an incomplete Elliott wave correction of Minor degree labeled in green, which began on September 03rd when the price found fresh buyers at 0.88658 and rallied until 0.92916, in where the cross completed its wave A in green. 

The following 4-hour chart illustrates wave B completion.  We see that its internal structure looks like a double-three pattern. This second leg started on 0.92916 on September 11th and ended on November 11th when the price found fresh buyers that boosted the cross in a move that looks like an impulsive intraday rally.

According to the Elliott Wave theory, the double-three pattern is a complex correction that follows an internal structure subdivided into 3-3-3. Likewise, in a corrective formation subdivided into three-wave movements, the segment corresponding to wave C should hold five segments inside it.

On the other hand, considering the Elliott wave theory’s alternation principle, the price likely could advance in an aggressive rally after an extended complex movement.

The cross is advancing in its wave ((ii)) of Minute degree labeled in black that belongs to wave C of Minor degree. In this context, the descending channel’s upper line’s breakout would confirm the potential bullish continuation of wave (iii).

Short-term Technical Outlook

The next 4-hour chart shows the second wave of Minute degree’s internal corrective structure, which could be advancing in its wave (c) of Minuette degree labeled in blue. 

From the previous chart, if the cross finds support in the demand zone located between 0.8917 and 0.8901, opens the likelihood of a new rally corresponding to wave ((iii)), which could advance toward the first supply zone between 0.9126 and 0.91464. The next potential target zone resides between 0.9200 and 0.9218.

On the other hand, both the breakout of the intraday descending trendline that connects the end of waves ((i)) in black and (b) in blue and the surpassing of the end of wave ((i)) will confirm the advance in wave ((iii)) of Minute degree.

Finally, the bullish turning scenario’s invalidation level locates at 0.88610, which corresponds to the origin of wave ((i)).

Categories
Forex Elliott Wave Forex Market Analysis

Is GBPUSD Ready for a New Decline?

Overview

The GBPUSD pair advances in an incomplete bearish corrective formation that corresponds to a wave B of Minor degree. In this context, the completion of wave B could lead to a new decline, which could drag the price below Septembers’ low.

Market Sentiment

The GBPUSD pair suffered another drop for the second day in a row, falling from the extreme bullish to a bullish sentiment zone, where it found support in the psychological barrier of level 1.31.

The following daily chart illustrates the 90-day high and low range, revealing the mid-term market participant’s sentiment. The figure shows the price action moving mostly sideways in a range that oscillates between the bearish and bullish sentiment zones; that is, between 1.27204 and 1.32289.

Furthermore, the 60-day weighted moving average is seen moving below the Pound’s price, which confirms the short-term bullish bias that carries the price.

Considering the indecision, the cable is exhibiting since last August. The intraday bias will stay neutral until the GBPUSD pair confirms its next movement, for example, through a breakout.

Technical Overview

The GBPUSD price reveals a yearly long-tailed candlestick that suggests the price will continue being dominated by the upward bias. As exposed in the following 2-day chart, the Pound erased the first 2020 quarter losses that reached up to 13.89%. The cable currently eases 0.67%(YTD).

The big picture of GBPUSD and under the Dow Theory unfolded in the next daily chart illustrates the cable developing a primary upward trend in progress, which currently could be forming a corrective secondary trend.

In this context, according to Dow Theory, the price retraced below 33% of the first upward movement, which accomplishes with the minimum requirement for a correction of the previous move of a similar level.

Nevertheless, considering that the price remains in a short-term downward trend, the price could continue developing a new bearish sequence.

Short-term Technical Outlook

The short-term Elliott wave outlook for GBPUSD unfolded in its 8-hour chart reveals the corrective rally that corresponds to an incomplete wave B of Minor degree identified in green, which leads us to expect a decline in a five-wave sequence for the following trading sessions.


The previous chart exposes a corrective structural series that began on September 01st when the price found fresh sellers at 1.34832 and dragged the cable until 1.26751 on September 23rd, where the pound started to advance in its wave B that remains in progress. 

In this regard, the current upward movement could find resistance in the first supply zone between 1.32069 and 1.32280. If the price extends its previous progression, creating a bull trap, it could climb until 1.33195. There, the price could start to decline in a five-wave sequence corresponding to wave C identified in green.

The potential next wave C could extend until the demand zone between 1.25658 and 1.24796, which corresponds with the mid-term descending channel’s base.

Finally, the bearish scenario’s invalidation level locates at 1.34832, which agrees with the origin of wave A in green. Nevertheless, before positioning on the downward side, the GBPUSD pair should confirm (or discard) the bearish entry. 


Categories
Forex Signals

EURAUD Bounces in a Demand Zone

Description

The EURAUD price reacted, developing an upward wide range candle during the overnight trading session when the price tested the bullish cycle’s demand zone. The cross began on September 16th when the price found fresh buyers at 1.61240 finished on October 20th when the cross found resistance at 1.68273.

Once the price found resistance, the cross started a bearish sequence as a corrective structure subdivided into a three-wave structural series, which looks in an exhaustion stage.

On the other hand, we recognize a consolidation formation between 1.61934 and 1.62494, corresponding to mid-September, where the cross found support during the Friday 06th overnight trading session.

In summary, the EURAUD cross could find fresh buyers in the zone between 1.62494 and 1.61934 from where the price could test the previous swing high located between 1.63533 and 1.63853.

Chart

Trading Plan Summary

Check out the latest trading signals on the Forex Academy App for your mobile phone from the Android and iOS App Store.

Categories
Forex Elliott Wave Forex Market Analysis

EURJPY: Can we Profit Short-Term?

Overview

The EURJPY cross advances in a corrective sequence that began on September 01st; this corrective movement looks incomplete. The short-term Elliott wave outlook foresees a limited recovery prior to its a coming decline corresponding to its fifth wave.

Technical Big Picture

The EURJPY cross, in its 12-hour chart, illustrates an incomplete downward sequence that began on September 01st when the price found fresh sellers at level 127.075. 

The previous figure exposes an upwards structural series subdivided into three-wave identified in Minute degree and labeled in black, which began on the May 06th low located at 114.397 and ended on the September 01st high when the price topped 127.075. 

Once the price found fresh sellers at 127.075, the cross started to retrace, developing a three-wave sequence identified in the Minuette degree labeled in blue. Until now, wave (c) doesn’t show bullish reversal signals, which lead us to expect further declines.

The short-term key supports and resistance levels are as follows:

  • Resistance 1: 123.160
  • Resistance 2: 124.233
  • Resistance 3: 124.999
  • Pivot Level: 122.377
  • Support 1: 121.144
  • Support 2: 120.271
  • Support 3: 119.311

Technical Outlook

The short-term outlook for EURJPY illustrated in its 3-hour chart reveals the intraday consolidation, which coincides with the progress of its fourth wave of Subminuette degree labeled in green.

In this regard, the market participants could mostly drive the price toward the supply zone between 122.550 and 122.890, from where the EURJPY cross could start developing the next decline corresponding to its fifth wave identified in green.

The potential target zone of the next decline locates between 121.038 and 120.051, which coincides with the base-line of the descending channel that extends from the September 01st high to date. 

Finally, the invalidation level of the downward scenario locates at 123.402.