Categories
Forex Elliott Wave Forex Technical Analysis

Three Things you Ought to Know Before Buying EURUSD

The EURUSD eased the last trading week, losing 1.18%, leaving away from the yearly high at 1.23495 reached on last January 06th. The common currency accumulates losses by 1.14% (YTD), which, added to other market conditions commented in our current analysis, carries us to expect further declines in the following trading sessions.  

1. Retail Traders Seems to Look for Long Positions

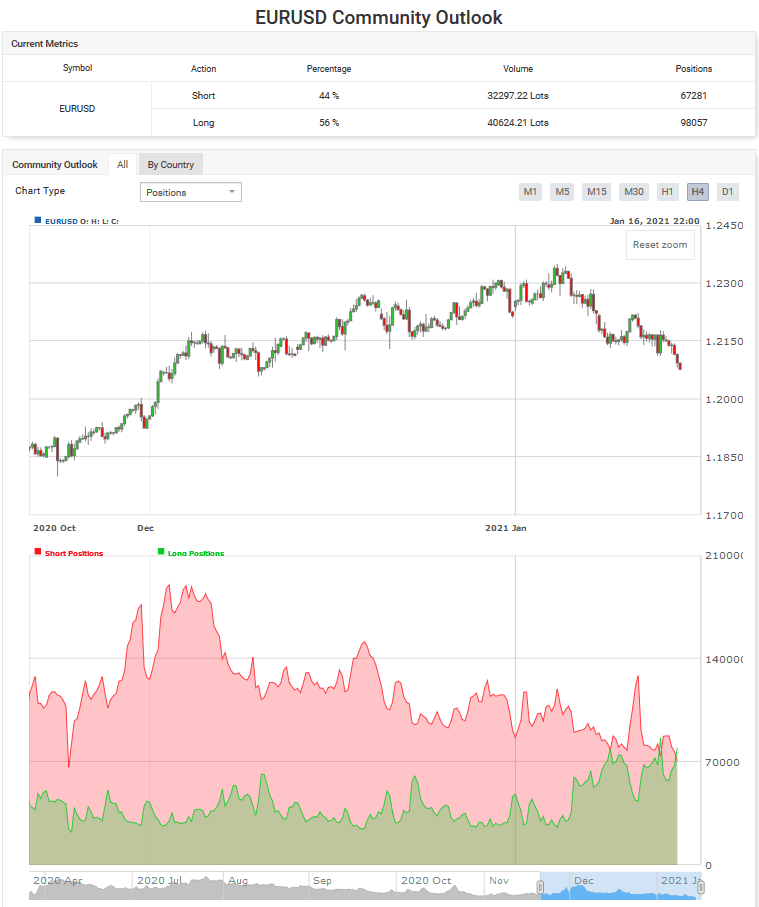
Retail traders tend to place their trades against the primary trend, remaining on the wrong side on most occasions. Regarding this market participant behavior context, retail traders reduced their short positions from 79.77% reached last January 06th to 44% last Friday’s session, as the EURUSD pair accelerated its decline. 

Source: myfxbook.com

Retail traders’ increasing positioning to the long-side carries us to sustain the prospect for further declines in the following trading sessions.

2. The Price Violated its Short-Term Upward Trendline

The big picture of EURUSD illustrated in its daily chart reveals the violation of the secondary trendline plotted in green, corresponding to the last rally developed by the common currency since November 04th from the 1.16025 level, which found resistance on January 06th at 1.23495. This market context leads us to observe that the price could develop a correction proportional to the last rally.

In this regard, the Dow Theory view suggests that EURUSD’s corrective move depth might lie between 33% (1.21030) and 66% (1.18565). Moreover, the price could find support in the long-term upward trendline plotted in blue.

3. Timing and Momentum Oscillator Supports the Elliott Wave View.

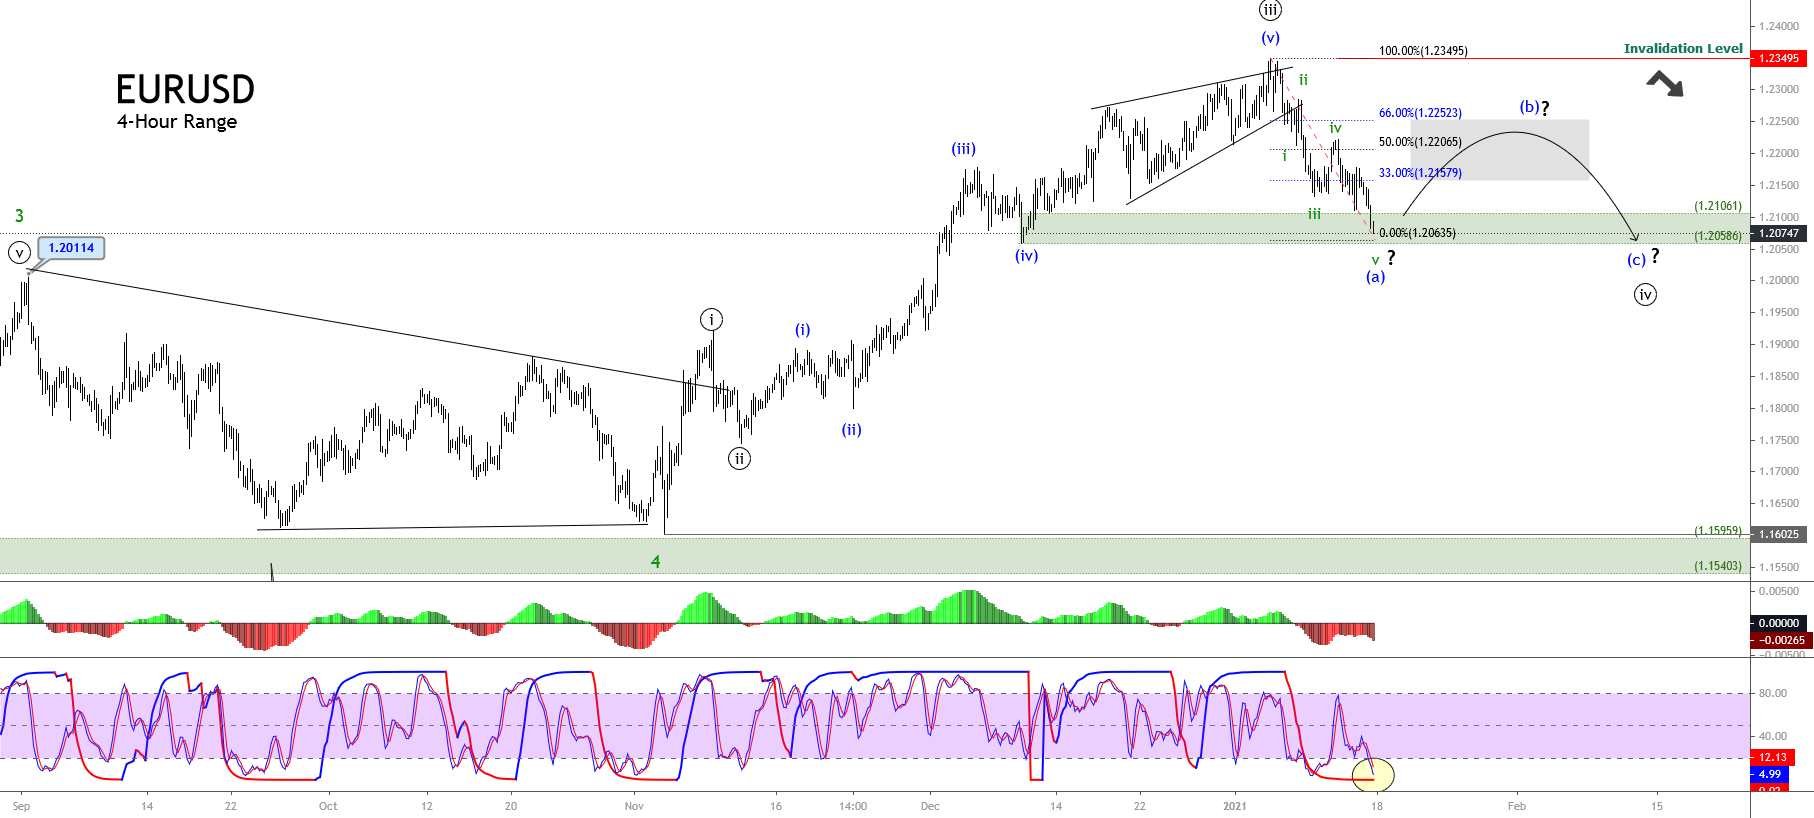
The intraday Elliott wave view for the EURUSD pair exposed in the next 4-hour chart shows the completion of an ending diagonal pattern corresponding to wave (v) of Minuette degree labeled in blue and its bearish reaction after its finalization.

Once the common currency topped at 1.23495, the price developed an intraday corrective move subdivided into five internal segments of Subminuette degree identified in green. This five-wave sequence of lesser degree carries us to expect the progress in a potential zigzag pattern (5-3-5). 

On the other hand, the timing and momentum oscillator lead us to observe the first downward sequence’s exhaustion corresponding to wave (a) in blue. In consequence, the common currency should develop a corrective rally corresponding to wave (b). This upward move could hit the zone between 1.21576 and 1.22523.

Once the EURUSD completes its wave (b) in blue, the price action should start its bearish wave (c), which follows an internal structure subdivided into five waves. In this context, the bearish scenario’s invalidation level can be found at the end of wave (v) at 1.23495.

What’s Next?

According to Myfxbook.com’s Community Outlook, 56% of retail EURUSD traders are positioned to the long side. Likewise, the violation of a short-term upward trendline carries to expect further declines in the common currency for the coming trading sessions. Nevertheless, the EURUSD could be at the end of the first segment of a corrective formation. In this context, the price could develop an upward bounce that could reach the zone between 1.21579 and 1.22523. After the bounce conclusion, the common currency could find fresh sellers expecting to join a new downward sequence corresponding to wave (c).

If you are interested in finding trading opportunities using the Elliott Wave Principle, follow our Forex.Academy Educational Section.

Categories
Forex Elliott Wave Forex Technical Analysis

EURJPY Consolidates Expecting Further Upsides

Technical Overview

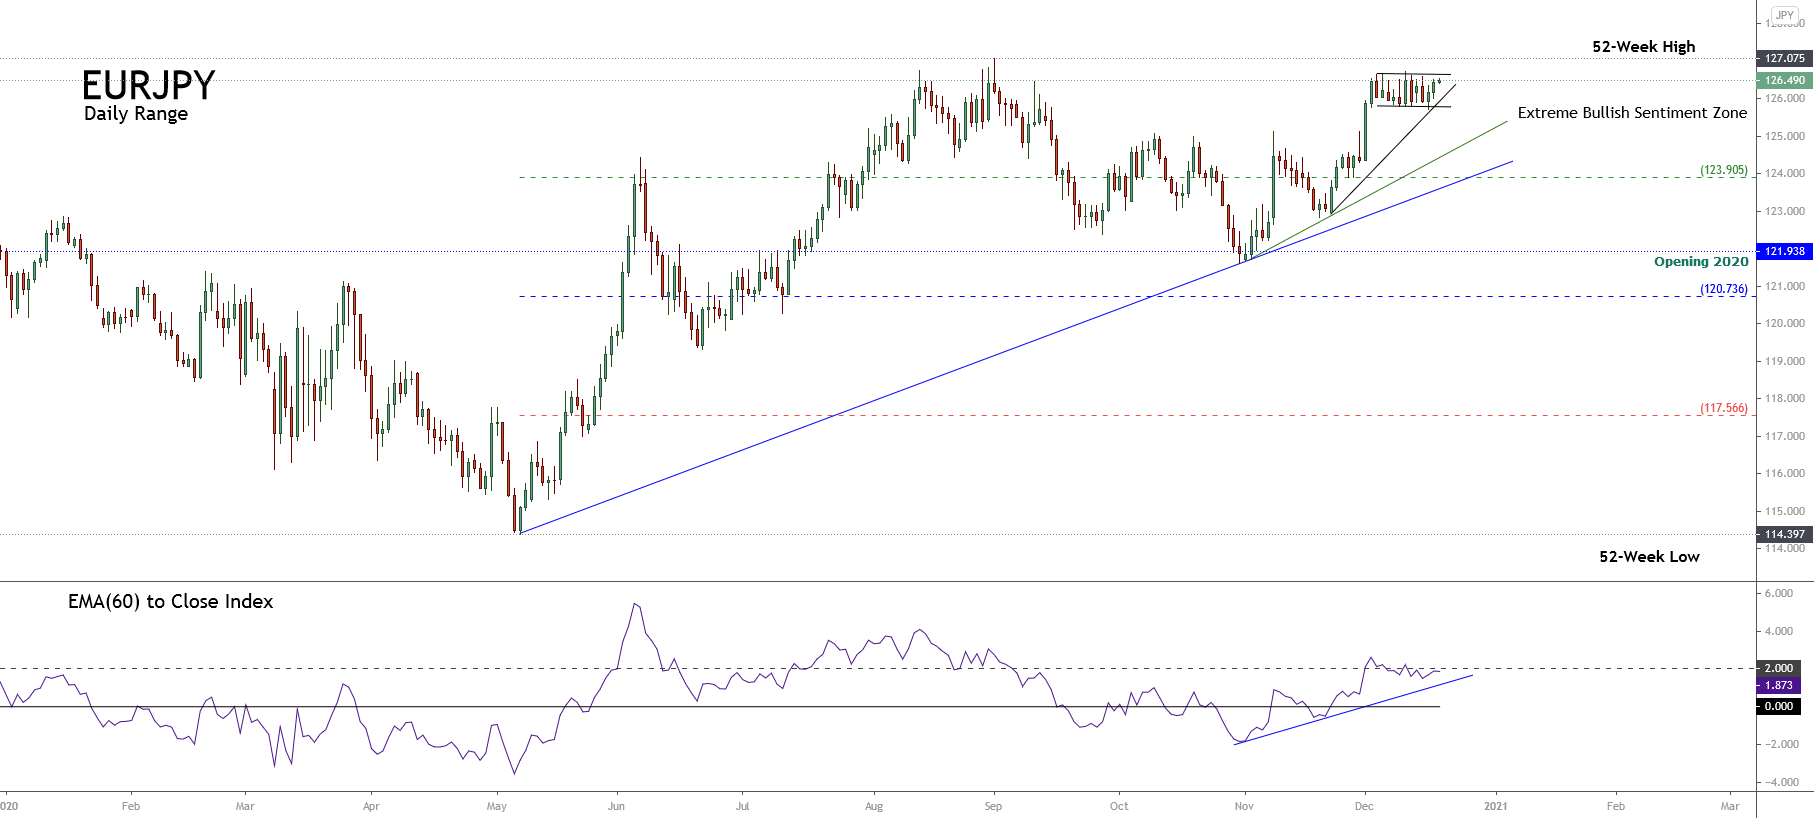
The EURJPY cross consolidates in the extreme bullish sentiment zone, suggesting a bullish continuation of the strong upward movement developed in early December.

The following daily chart exposes the EURJPY cross developing a consolidation pattern, which looks like a flag pattern bounded between 125.77 and 126.70. According to the chartist analysis, the formation suggests the continuation of the previous movement. In this case, the cross could extend its gains surpassing the next resistance corresponding to the 52-week high located at 127.075.

The mid-term overview for the EURJPY cross reveals its primary trend plotted in blue, supporting a rally that remains in progress since the price confirmed its bottom at 114.397 touched on last May 07th. The secondary trend traced in green and minor trend drawn in black supports the price acceleration, which currently consolidates carrying to expect the bullish continuation for the following trading sessions.

Technical Outlook

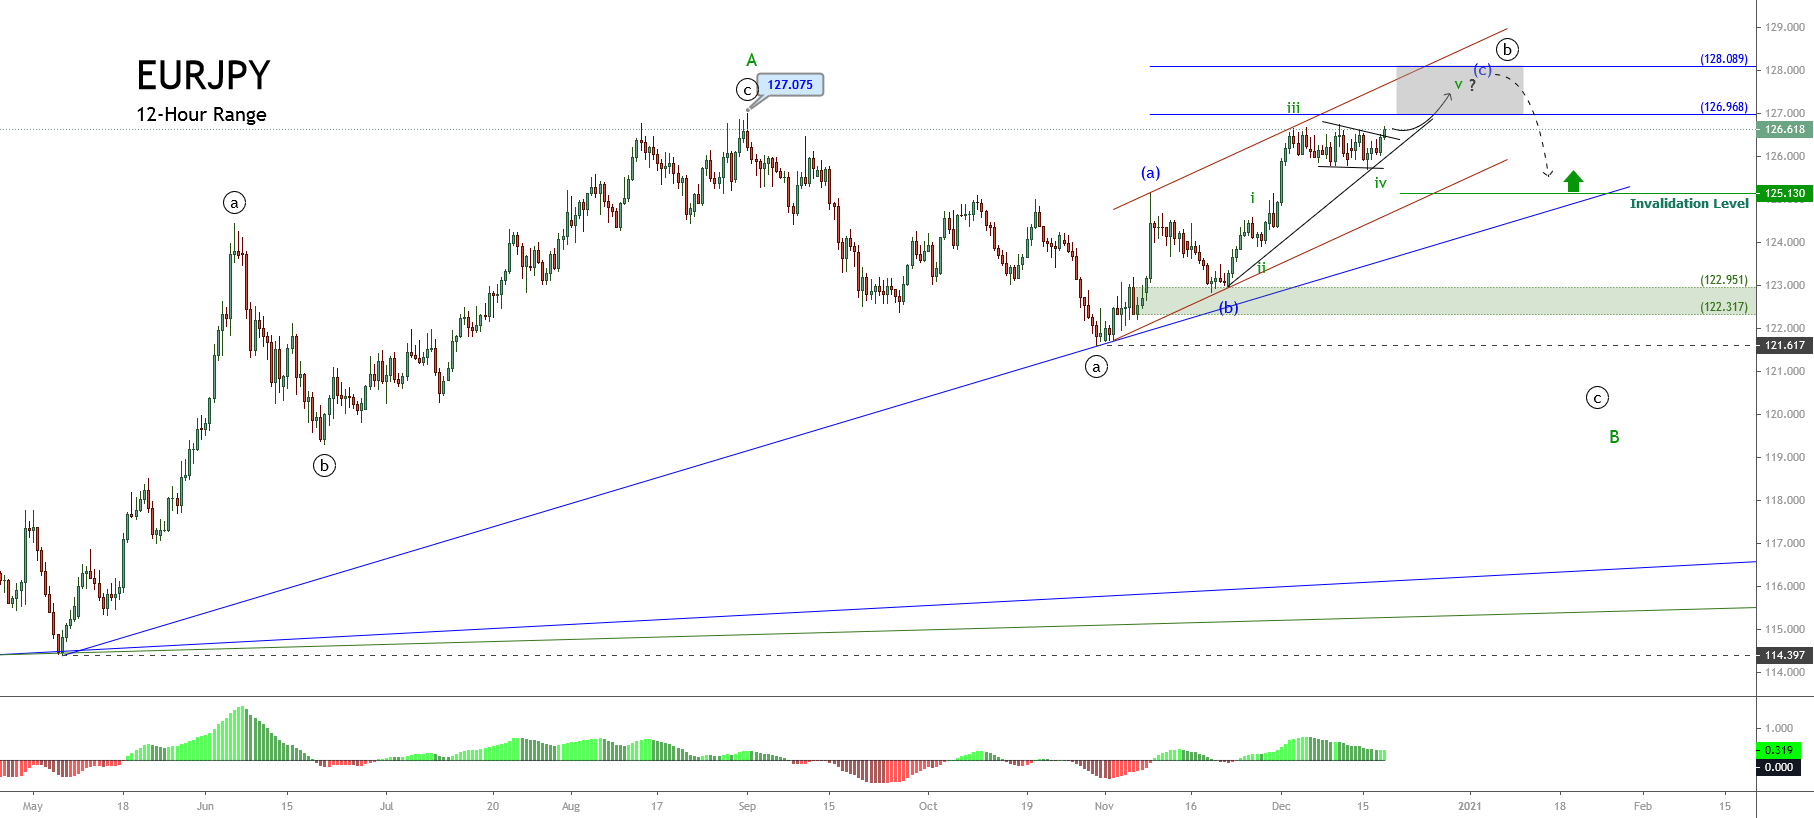
The big picture for the EURJPY cross under the Elliott wave perspective unfolded in the next 12-hour chart shows the incomplete corrective rally corresponding to wave ((b)) of Minute degree labeled in black. This corrective rally remains in progress since the price found fresh buyers at 121.617 on last October 29th and could reach new yearly highs.

The upper degree structure of the EURJPY cross illustrated in the previous chart exposes the progress in wave B of Minor degree labeled in green, which began when the cross completed its wave A at 127.075 on last September 01st. Currently, the price advances in its wave ((b)) in black. Likewise, its internal structural series shows the development in the wave (c) of Minuette degree labeled in blue, which at the same time, looks starting to develop the wave v of Suminuette degree identified in green.

In this context, the EURJPY cross could extend its gains toward the potential target zone bounded between 126.96 until 128.08, where the cross could find fresh sellers expecting to drag the price to new lows developing the wave ((c)) in black. 

In this regard, if the price confirms its new bearish leg, the cross could complete the third segment of wave B in green. On the other hand, considering both the alternation principle and the wave ((a)) and ((b)) looks extended in terms of time, the wave ((c)) could be a sharp decline.

In conclusion, the EURJPY cross moves mostly upward in a corrective rally that belongs to wave ((b)), corresponding to the second segment of the upper degree wave B. If the price breaks the sideways consolidation structure developed since early December, the cross could strike the potential target zone between 126.96 and 128.08. Likewise, the invalidation level of the bullish scenario locates at 125.130.

Categories
Forex Elliott Wave Forex Market Analysis

Will 1.24 be the Next EURUSD Yearly High?

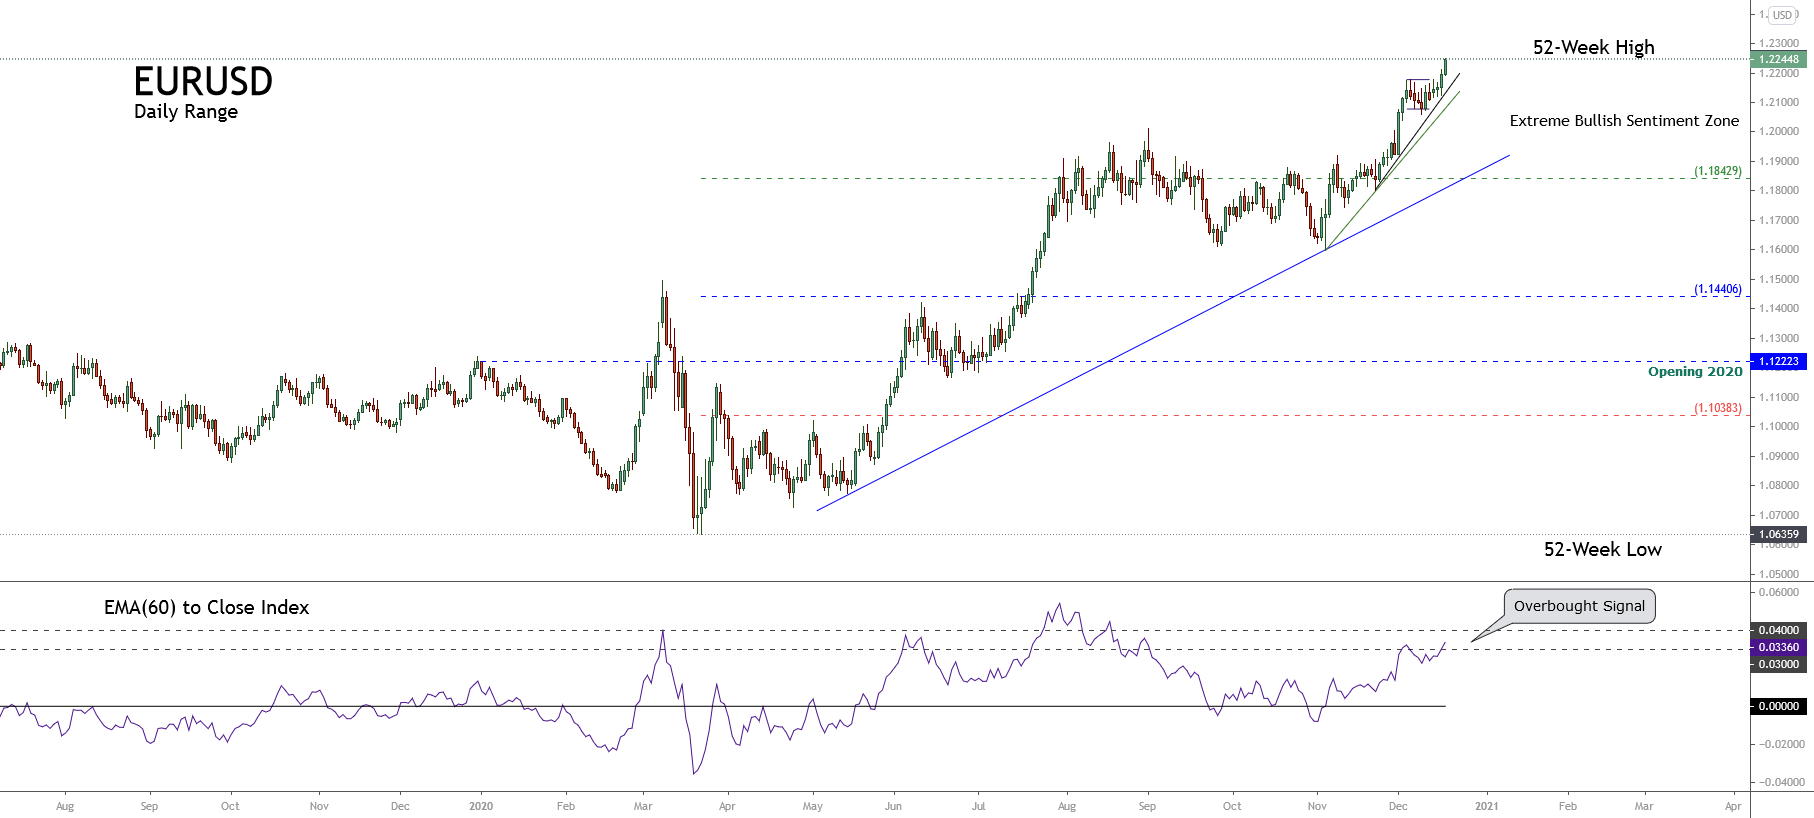
The EURUSD pair continues extending its gains after surpass its psychological resistance of $1.22 for the first time since late April 2018. The common currency gained over 9.20% (YTD), encouraged by the US Dollar weakness.

Technical Overview

The following daily chart illustrates the long-term market participants’ sentiment unfolded within the 52-week high and low range. The figure shows the progression starting from 1.06359, which corresponds to the lowest level of the year. 

The long-term primary trend identified with the trend-line in blue reveals that bull traders remain the market control since last March 23rd when the price found and confirmed the bottom at 1.06359 after the massive sell-off occurred last mid-February. Moreover, both the secondary trend (green trend-line) and the minor trend (black trend-line) show the bullish acceleration that carries the cross from November 04th when the EURUSD found fresh buyers expecting further upsides. 

On the other hand, although the trend looks mostly bullish, the EMA(60) to close index is moving in its overbought zone; thus, we should be prepared fr the upward movement in progress to end soon. Under this context, the main bias for bulls should change from buy to hold. Also, Bearish traders should expect confirmation signals such as a significative breakdown before placing their short positions.

Technical Overview

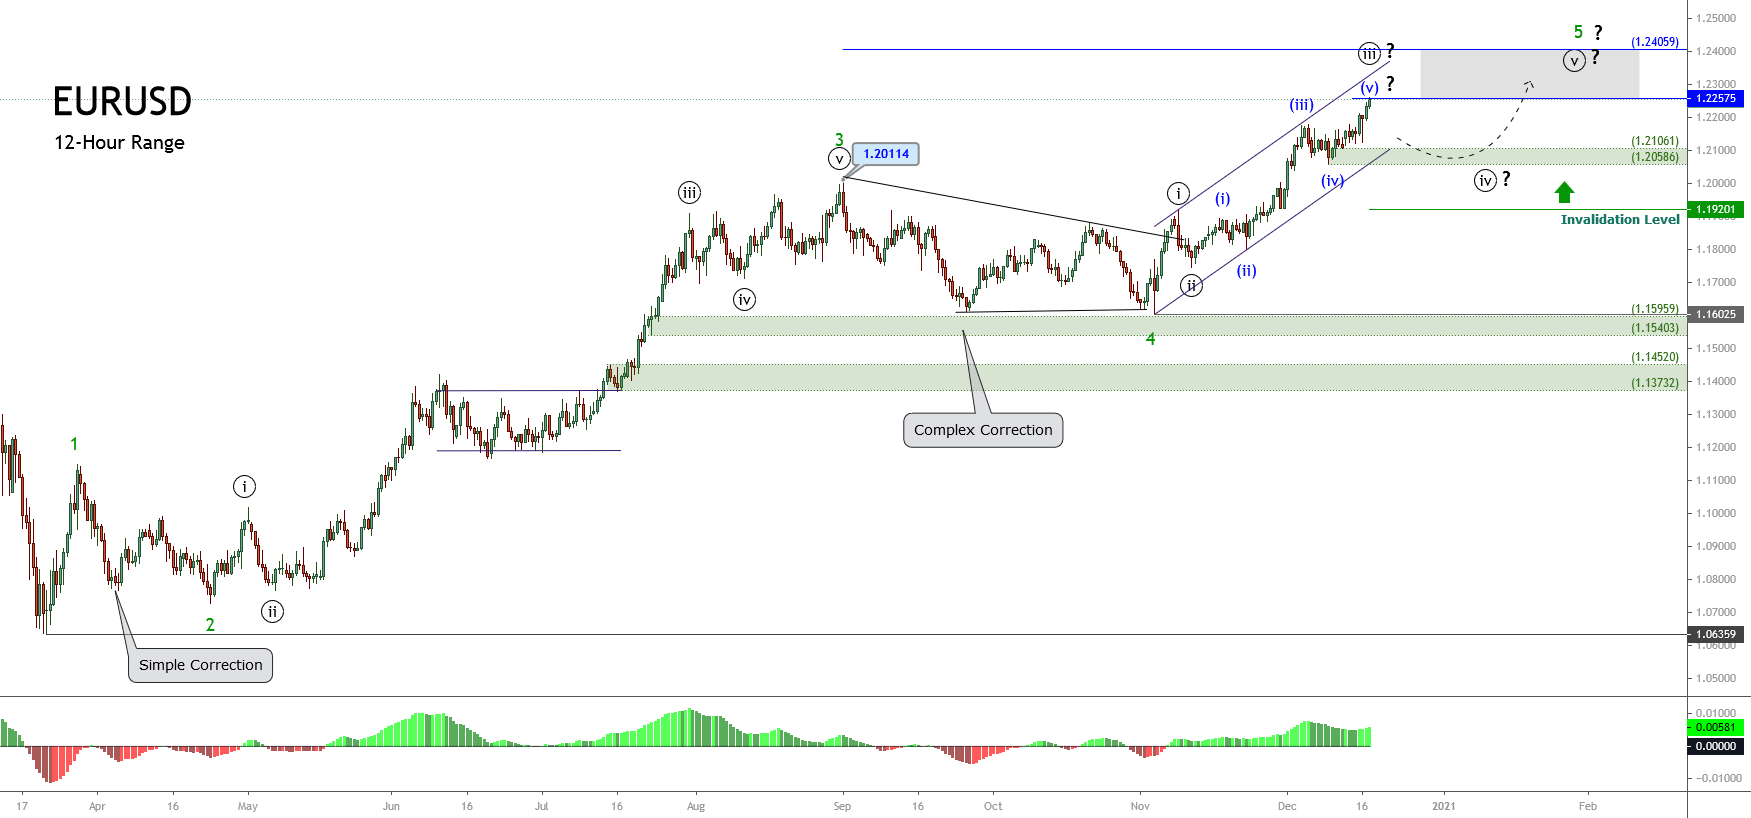
The mid-term Elliott wave view of the EURUSD pair exposed in the next 12-hour timeframe chart reveals the price action is reaching its second target level of $1.22575 proposed in our previous analysis. Also, the chart illustrates its progress in an incomplete wave 5 of Minor degree labeled in green.

The lesser degree structure observed in the fifth wave in green shows the progression of the wave ((iii)) of Minute degree labeled in black, which simultaneously appears advancing in its internal fifth wave of Minuette degree identified in blue. The Elliott Wave textbook suggests that, currently, the common currency moves in an extended wave. In this context, once the pair completes its rally, it should start to consolidate in its wave ((iv)) in black. This corrective formation could find support in the demand zone between 1.21061 and 1.20586, which could bring the possibility to join the long-term bullish trend. The potential target for wave 5 in green is $1.2405.

In summary, the EURUSD pair moves in its third wave of Minute degree, which should complete its rally in the coming trading sessions. The next path corresponding to wave ((iv)) in black could drag the price until the demand zone between 1.21061 and 1.20586, where the common currency could start a new rally with a potential target at 1.2405. Finally, the invalidation level of the bullish scenario is $1.19201.

Categories
Forex Elliott Wave Forex Market Analysis

Is the EURJPY Ready to Develop a New Decline?

The EURJPY cross advances in a long-term consolidation structure, which began in early December 2016. The short-term Elliott wave view predicts a limited decline in the following trading sessions.

Market Sentiment

The EURJPY cross closed the last trading week, cutting Monday’s session gains when the cross jumped from 122.835 until 125.136, mainly supported by the stock market’s post-election rally.

The following figure shows the EURJPY in its daily timeframe, revealing the mid-term big-market participants’ sentiment exposed by the 90-day high and low range. In this context, the cross is entering into the bearish sentiment zone. However, the 60-day weighted moving average still doesn’t confirm the short-term bearish bias.

After a rally that carried the cross to advance over 11% since May 07th (when the EURJPY bottomed on 114.397 and then soared, reaching the highest level of the year at 127.075 on September 01st), the cross began to retrace, turning its mid-term market sentiment from extremely bullish to bearish.

Nevertheless, the price action still doesn’t confirm the bearish sentiment. In this regard, the short-term sentiment remains neutral until the price confirms the bias.

Technical Overview

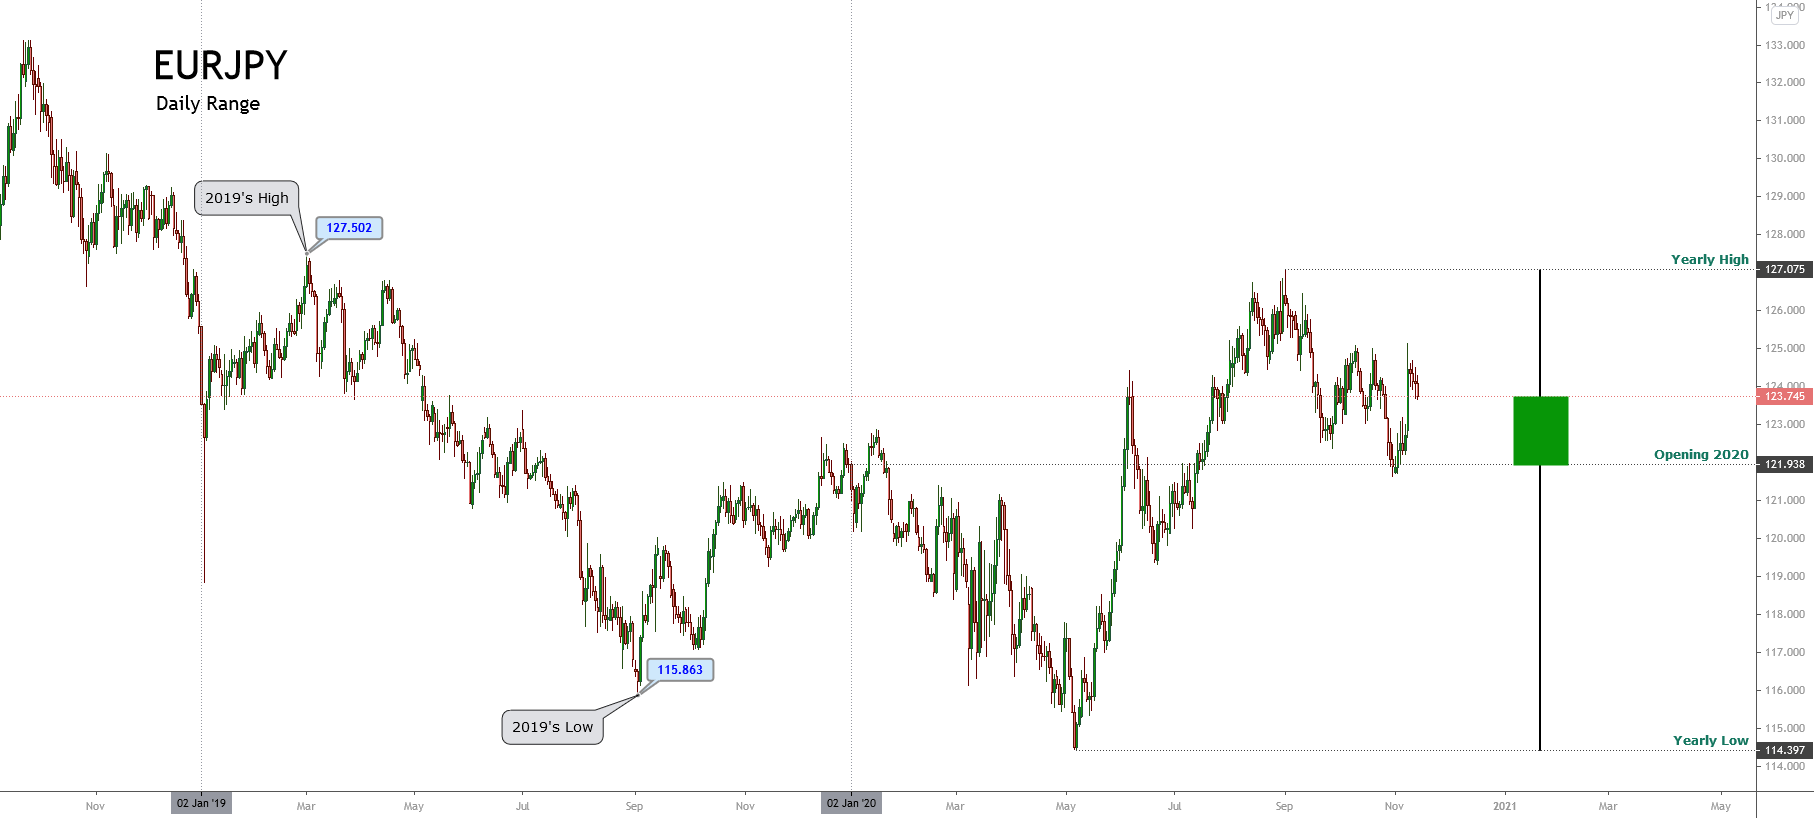
The big picture of EURJPY illustrated in the following daily chart exposes a long-tailed yearly candlestick mostly bullish. However, the upper shadow hints at a bearish pressure near the psychological barrier of 127. Moreover, the next resistance is placed at 127.502, which corresponds to the high of 2019.

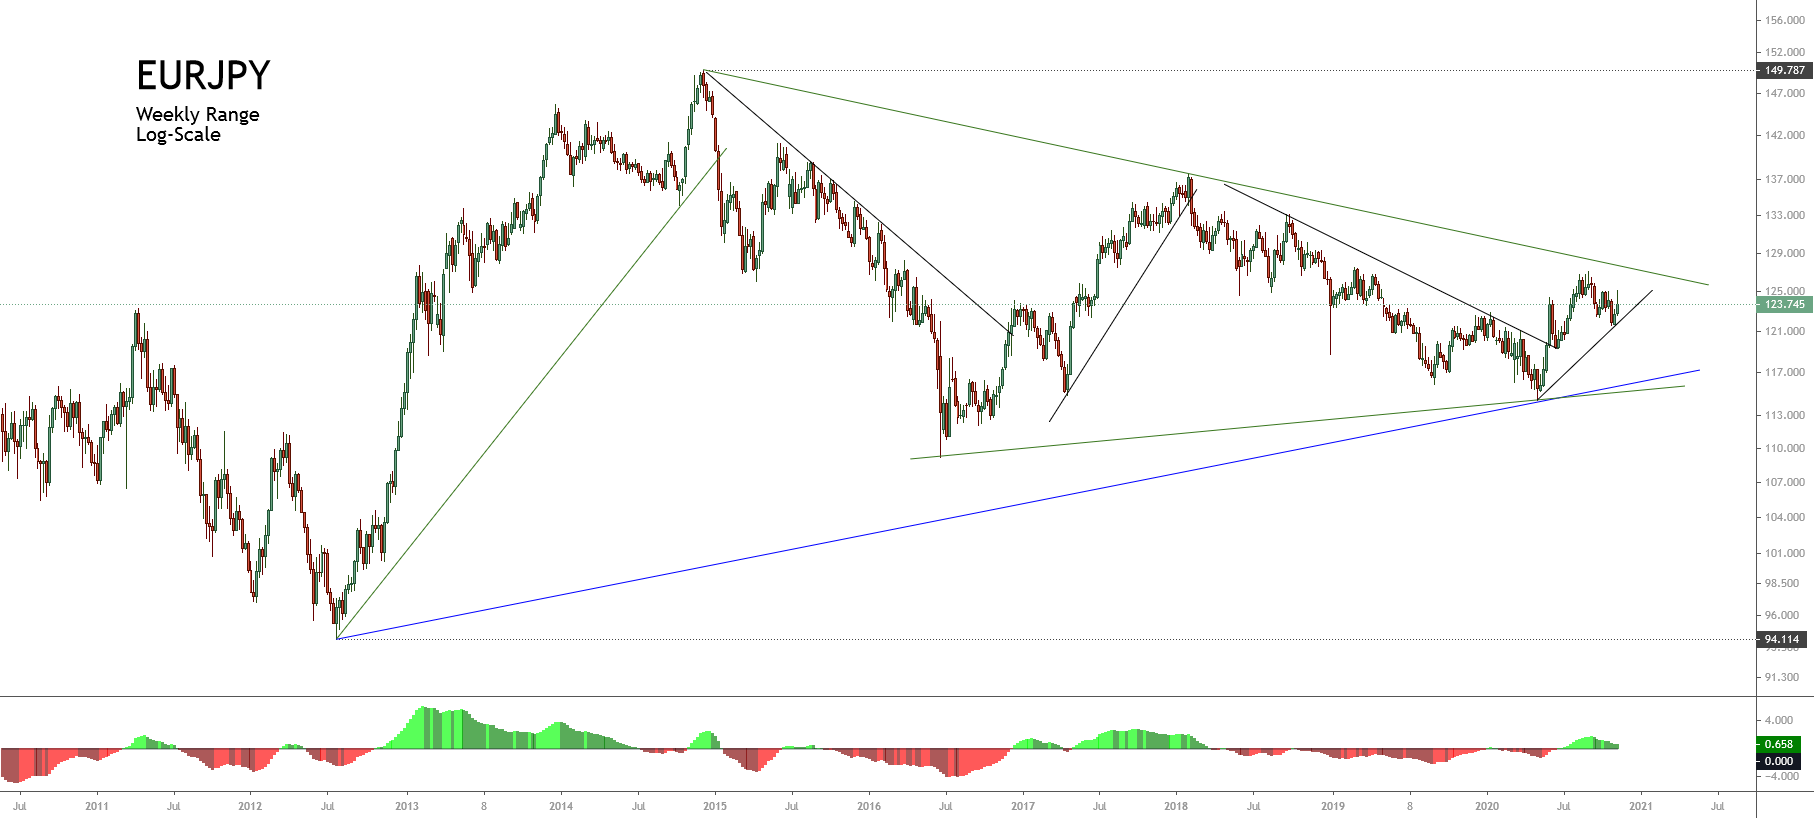
The EUJPY long-term trend under the Dow Theory perspective and exposed in the next log scale weekly chart reveals the primary trend identified in blue that remains slightly bullish.

At the same time, the secondary trend exposes the sideways movement developing as a pennant pattern, which began in early December 2016 when the price found resistance at 149.787 and could break soon.

According to the classic chartist theory, the pennant pattern is a technical figure that calls for the continuation of the previous movement. In this case, the pennant could resume the rally developed since late July 2012 at 94.114 ended at 149.787 in early December 2014.

Short-term Technical Outlook

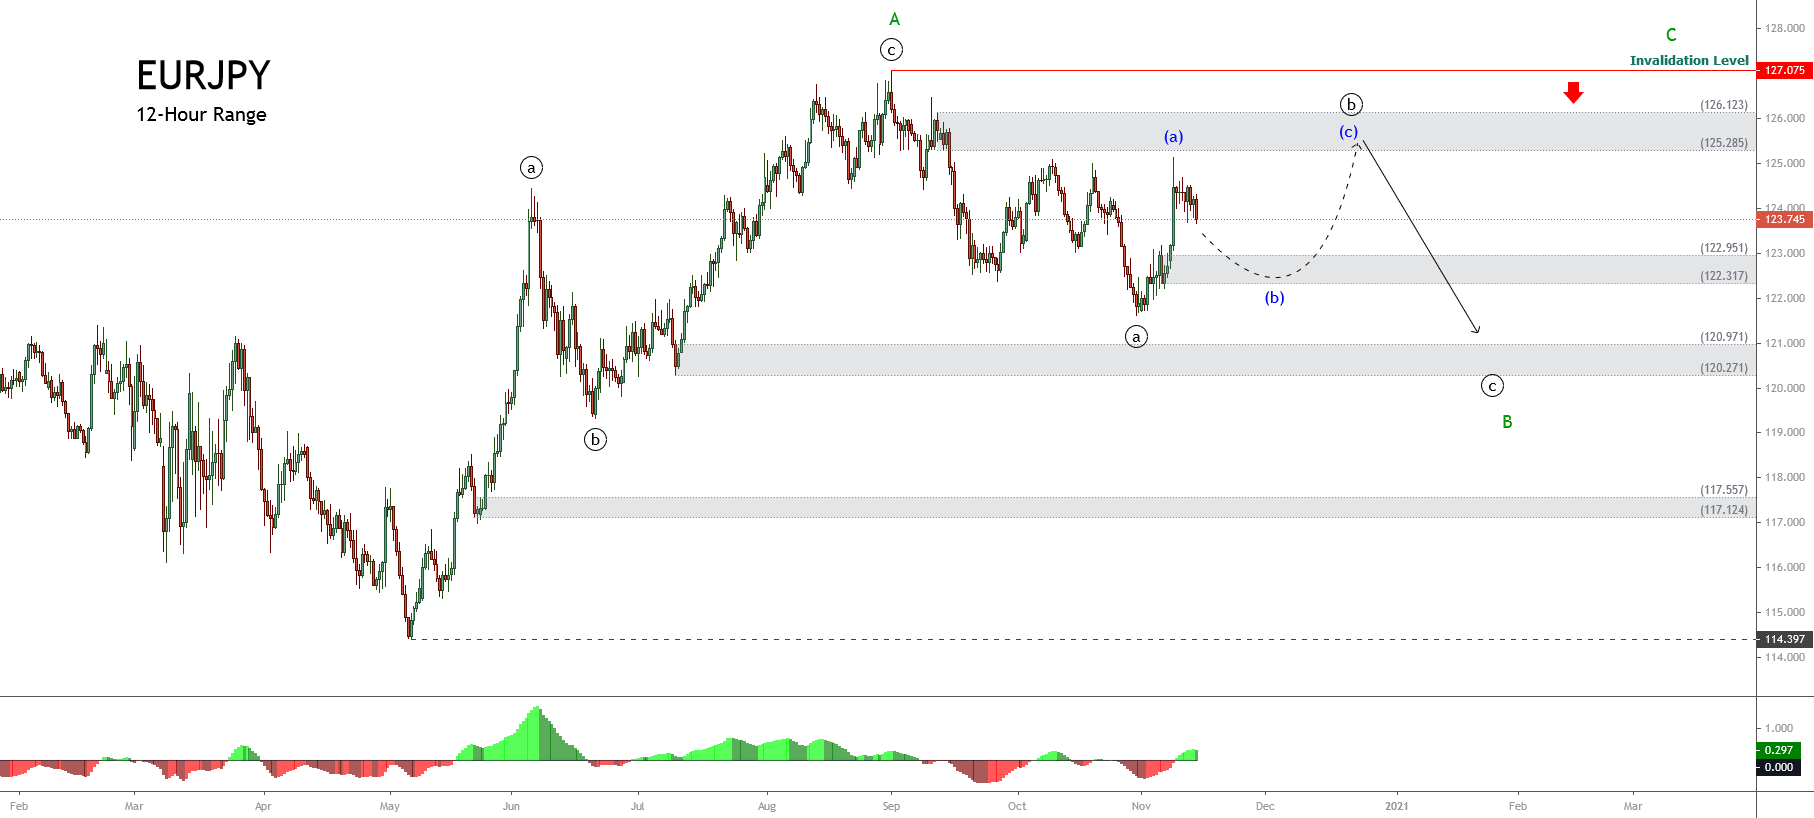
The short-term Elliott wave view for EURJPY shows in its 12-hour chart advancing in an incomplete corrective sequence that began on May 06th at 114.397, where it completed its wave A of Minor degree labeled in green.

Once the price found fresh sellers at the highest level of the year, the cross started to advance in its wave B, still in progress. In this context, the previous chart unveils the intraday upward sequence corresponding to the incomplete wave ((b)) of Minute degree identified in black.

The price action could boost the cross until the next supply zone, located between 125.285 and 126.123, where the EURJPY could start to decline in an internal five-wave sequence corresponding to wave ((c)), in black, that may drop to 120.271, though, the price could extend its drops until 117.124.

The short-term bearish scenario’s invalidation level locates above the end of wave A in green at 127.075.

Categories
Forex Elliott Wave Forex Market Analysis

Is GBPUSD Ready for a New Decline?

Overview

The GBPUSD pair advances in an incomplete bearish corrective formation that corresponds to a wave B of Minor degree. In this context, the completion of wave B could lead to a new decline, which could drag the price below Septembers’ low.

Market Sentiment

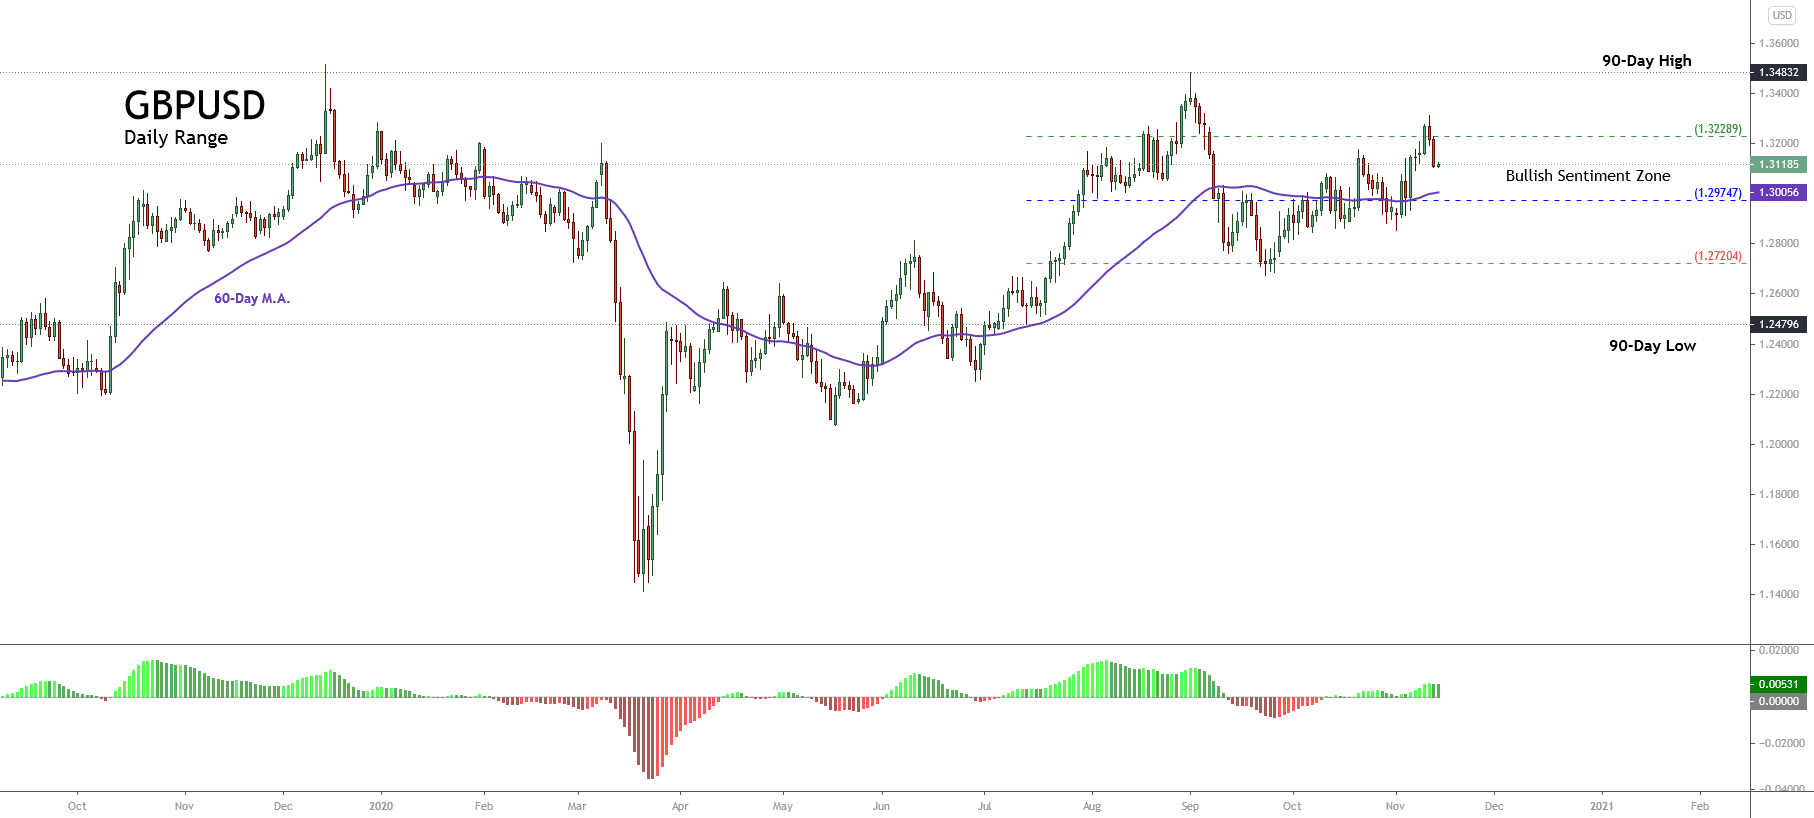
The GBPUSD pair suffered another drop for the second day in a row, falling from the extreme bullish to a bullish sentiment zone, where it found support in the psychological barrier of level 1.31.

The following daily chart illustrates the 90-day high and low range, revealing the mid-term market participant’s sentiment. The figure shows the price action moving mostly sideways in a range that oscillates between the bearish and bullish sentiment zones; that is, between 1.27204 and 1.32289.

Furthermore, the 60-day weighted moving average is seen moving below the Pound’s price, which confirms the short-term bullish bias that carries the price.

Considering the indecision, the cable is exhibiting since last August. The intraday bias will stay neutral until the GBPUSD pair confirms its next movement, for example, through a breakout.

Technical Overview

The GBPUSD price reveals a yearly long-tailed candlestick that suggests the price will continue being dominated by the upward bias. As exposed in the following 2-day chart, the Pound erased the first 2020 quarter losses that reached up to 13.89%. The cable currently eases 0.67%(YTD).

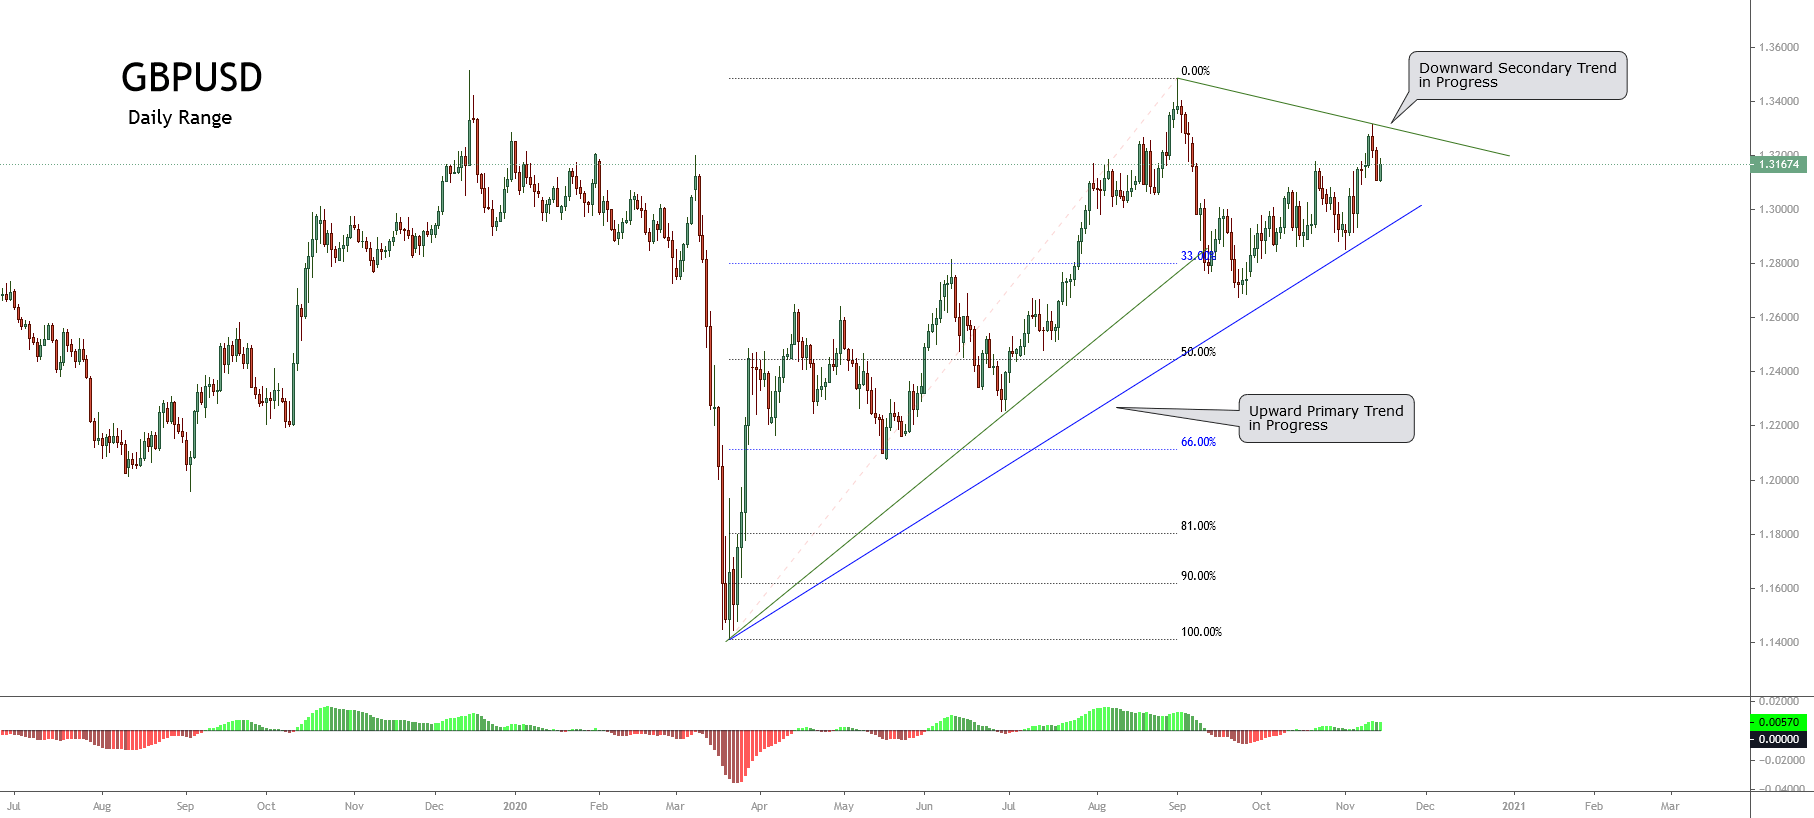
The big picture of GBPUSD and under the Dow Theory unfolded in the next daily chart illustrates the cable developing a primary upward trend in progress, which currently could be forming a corrective secondary trend.

In this context, according to Dow Theory, the price retraced below 33% of the first upward movement, which accomplishes with the minimum requirement for a correction of the previous move of a similar level.

Nevertheless, considering that the price remains in a short-term downward trend, the price could continue developing a new bearish sequence.

Short-term Technical Outlook

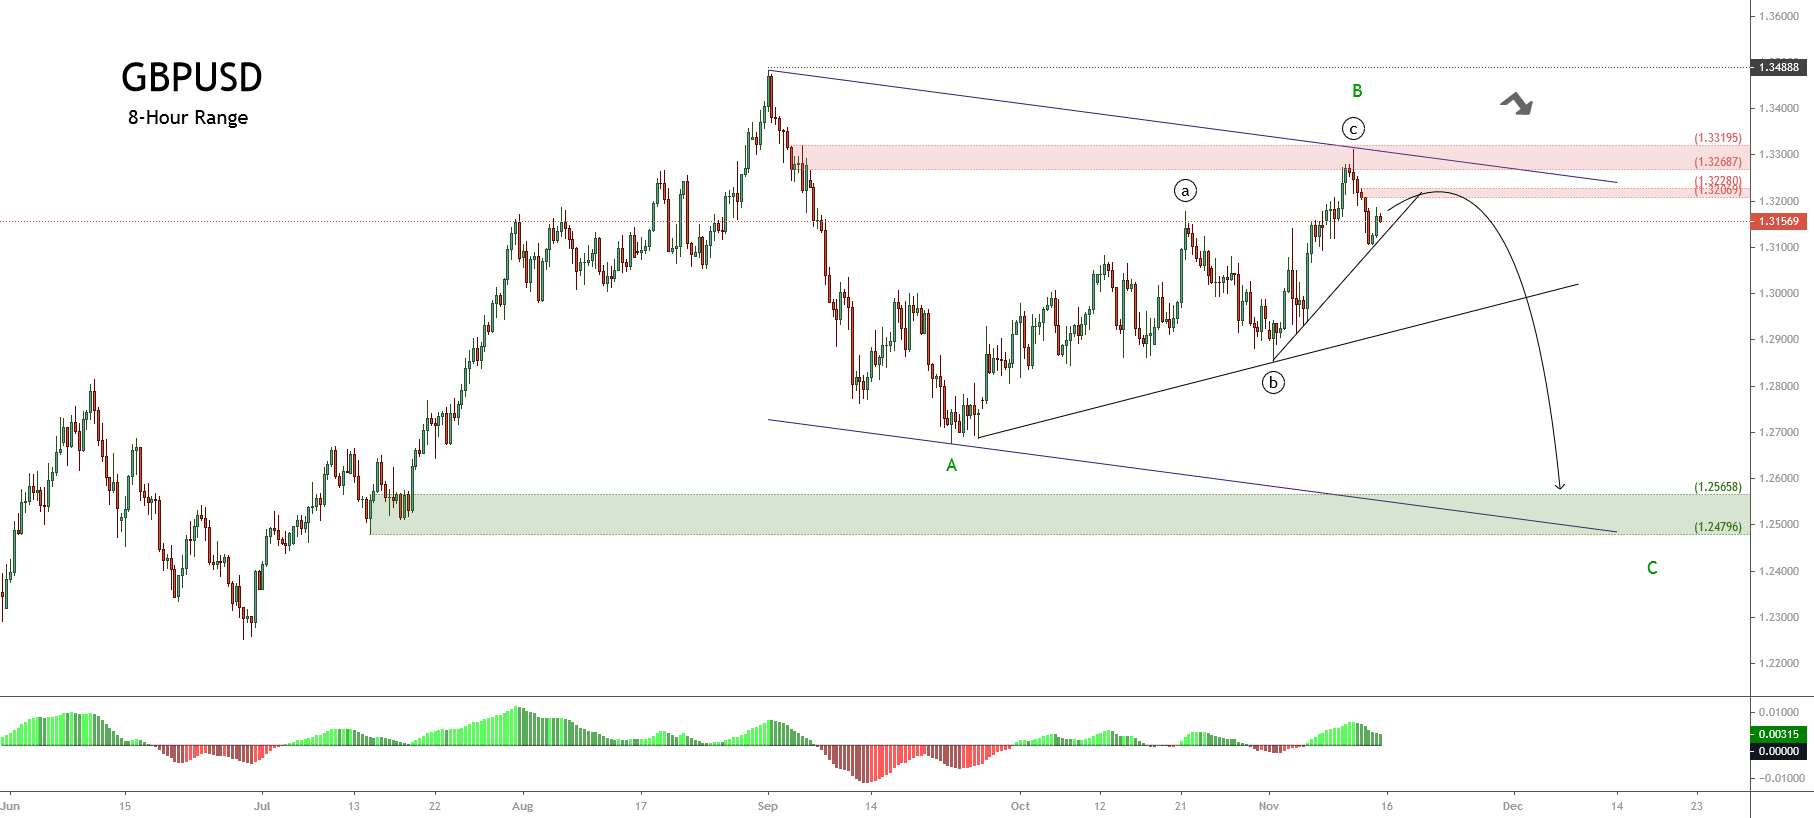
The short-term Elliott wave outlook for GBPUSD unfolded in its 8-hour chart reveals the corrective rally that corresponds to an incomplete wave B of Minor degree identified in green, which leads us to expect a decline in a five-wave sequence for the following trading sessions.


The previous chart exposes a corrective structural series that began on September 01st when the price found fresh sellers at 1.34832 and dragged the cable until 1.26751 on September 23rd, where the pound started to advance in its wave B that remains in progress. 

In this regard, the current upward movement could find resistance in the first supply zone between 1.32069 and 1.32280. If the price extends its previous progression, creating a bull trap, it could climb until 1.33195. There, the price could start to decline in a five-wave sequence corresponding to wave C identified in green.

The potential next wave C could extend until the demand zone between 1.25658 and 1.24796, which corresponds with the mid-term descending channel’s base.

Finally, the bearish scenario’s invalidation level locates at 1.34832, which agrees with the origin of wave A in green. Nevertheless, before positioning on the downward side, the GBPUSD pair should confirm (or discard) the bearish entry. 


Categories
Forex Elliott Wave Forex Market Analysis

AUDNZD Continues Under Bearish Pressure

Overview

The AUDNZD cross remains moving mostly bearish in the bullish sentiment zone. It alters the price surpassing the 1.10 psychological barrier and begins a corrective sequence that remains in progress; however, this downward movement could end soon.

Market Sentiment

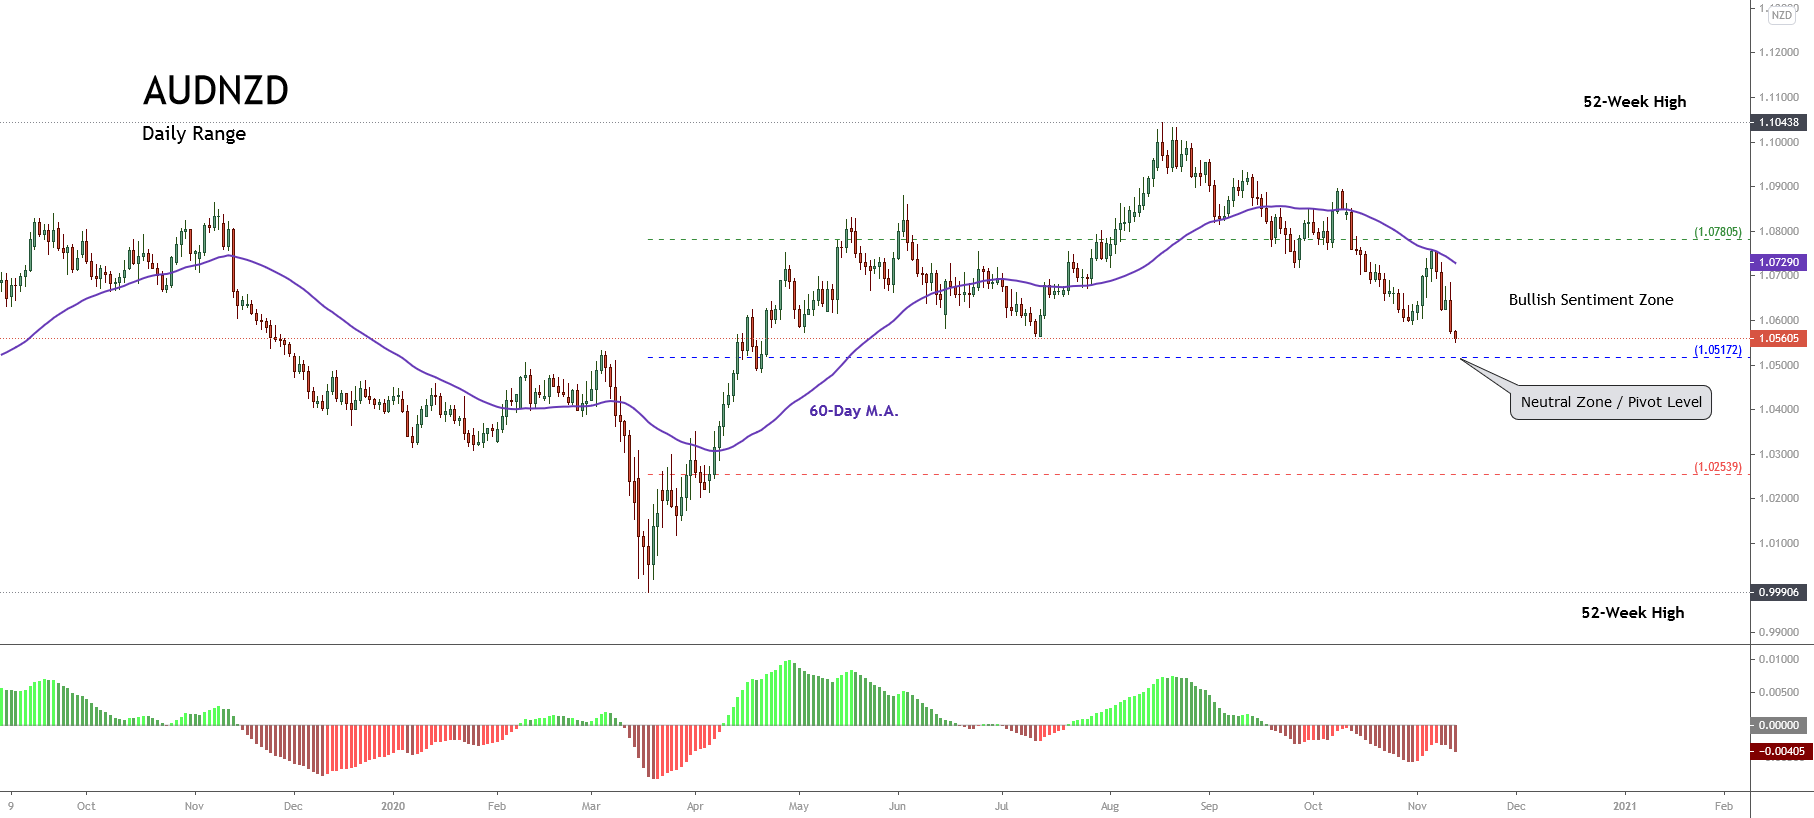
The AUDNZD moves mostly downward in the bullish sentiment zone, piercing July’s low area at 1.056. The Oceanic Cross advances over 1.5% (YTD).

The following figure exposes the AUDNZD cross in its daily timeframe. The chart reveals the long-term market participants’ sentiment bounded by its 52-week high and low range. The price action began a downward sequence; after that, the cross surpassed its last 52-week high of June 02nd, located on 1.08807 in a rally that elapsed six sessions in a row.


Moreover, the 60-day weighted moving average confirms the downward short-term bearish bias that favors the price action. Nevertheless, considering that the cross moves in the bullish sentiment zone, the AUDNZD cross’s decline could be a correction of the upward cycle that began last mid-March.

Technical Overview

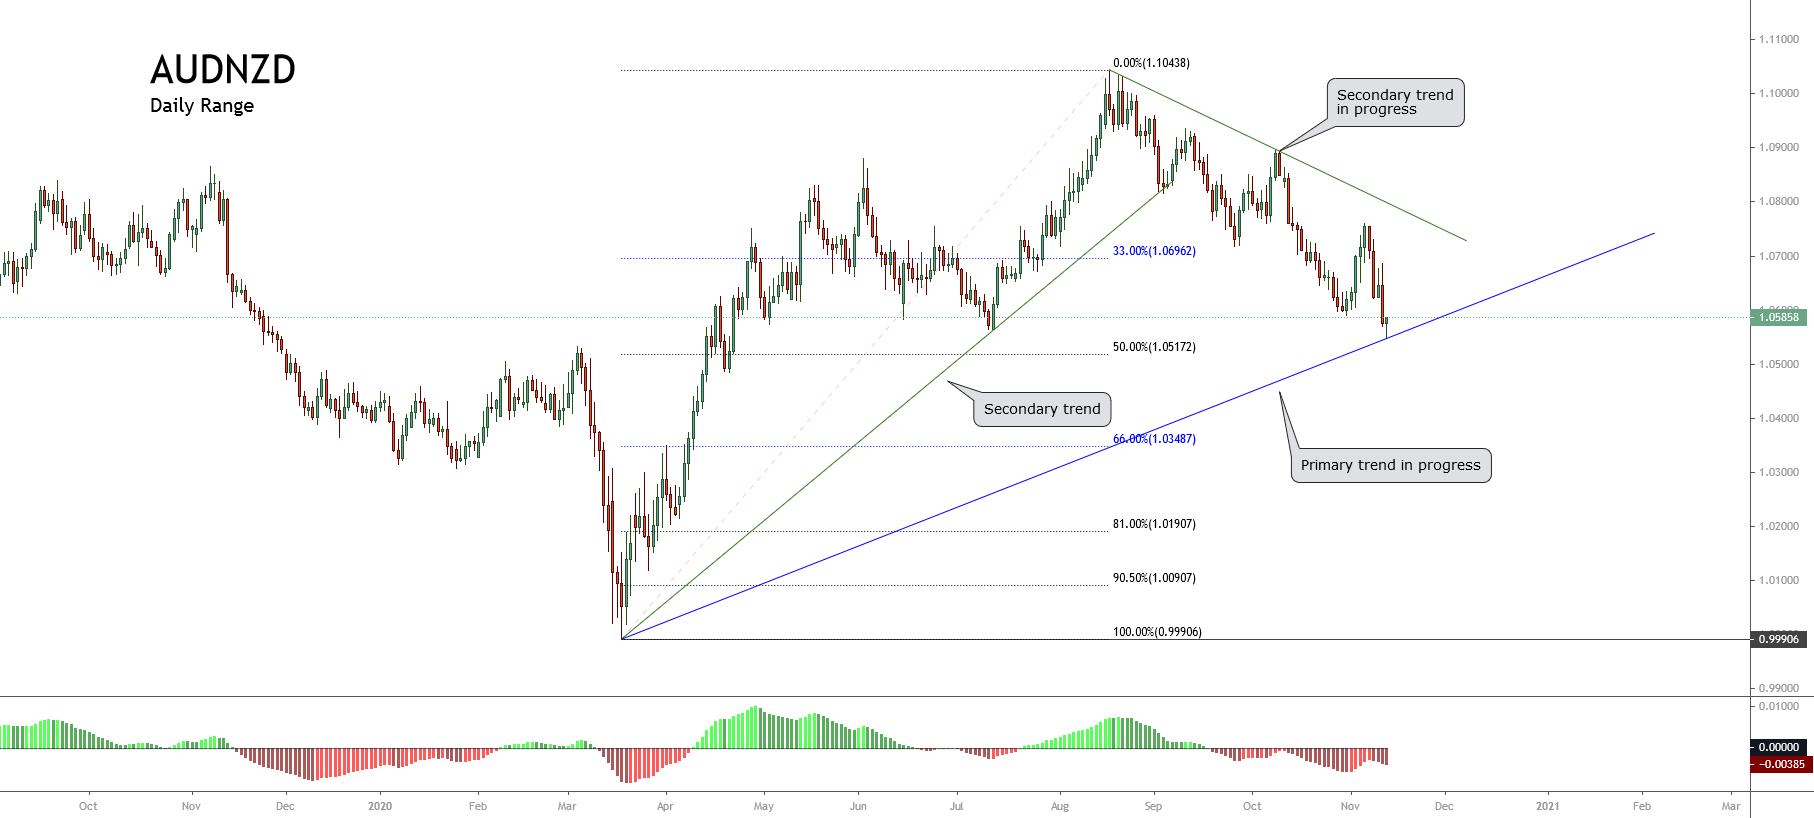
The AUDNZD cross under the Dow Theory perspective reveals that the price has started to develop a bullish primary trend that began on March 18th when the price found fresh buyers at 0.99906.

The following chart illustrates AUDNZD in its daily timeframe. The figure exposes the demand incorporation below the parity, which carried up the price until 1.10438, from where the price started to decline in a secondary trend.

The retracement developed by the Oceanic cross beyond the 33% leads us to confirm that the latest decline in progress corresponds to the rally’s corrective movement that began on March 18th.

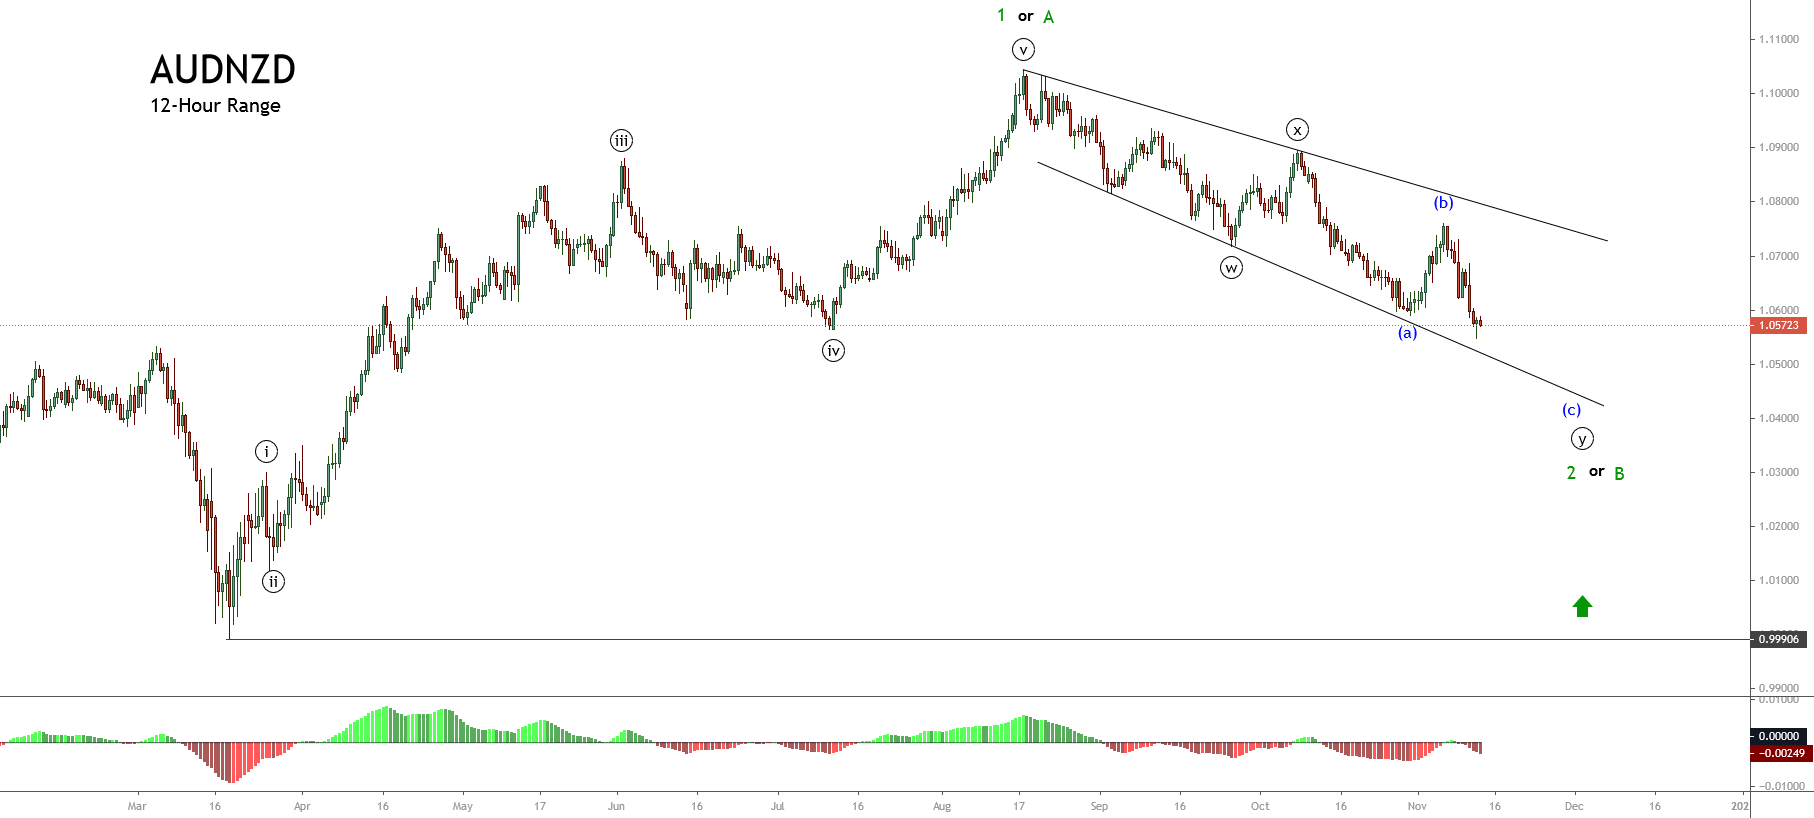
The mid-term Elliott wave view of the AUDNZD cross illustrates in its 12-hour chart the downward move in a complex corrective structure that looks like an incomplete double-three pattern (3-3-3).

The previous chart reveals the price action is moving in its wave (c) of Minuette degree labeled in blue, which belongs to wave ((y)) of Minute degree in black. Likewise, this entire move corresponds to wave 2 or B, which retraces the upward five-wave sequence that began on March 18th at 0.99906.

Technical Outlook

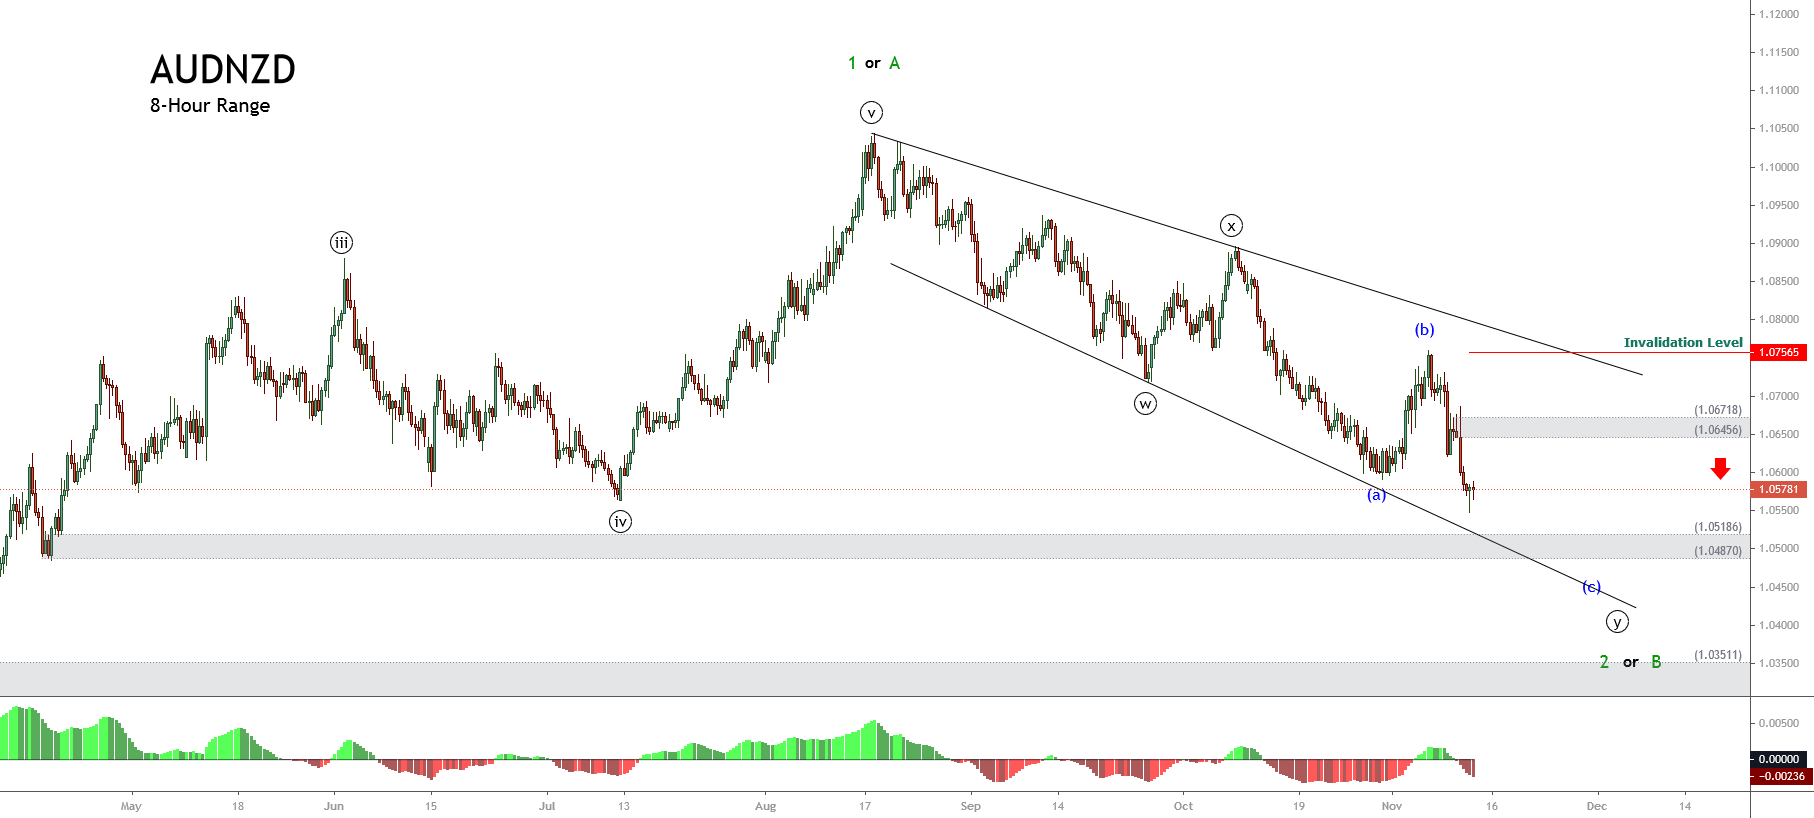
Once the AUDNZD found sellers at 1.07565, the Oceanic cross began its wave (c) of Minuette degree labeled in green that remains in progress.

As illustrated in the following 8-hour chart, the price could extend its declines to the area between 1.05186 and 1.04870, where the price could find support. Likewise, if the price extends its drops below 1.03511, the next movement’s strength could be limited to a re-test of the August 18th high located on 1.103.

On the other hand, if the price action breaks and closes above the supply zone between 1.06456 and 1.06718, there exists the possibility of a new rally. This new bullish leg could surpass the 1.103 mark.

Finally, the invalidation level for the short-term bearish scenario is located at 1.07565.

Categories
Forex Elliott Wave Forex Market Analysis

Is USDCAD Ready for a Short-Term Rally?

The USDCAD pair reveals a strong bearish movement that seems have found a short-term bottom. In this regard, the price could start a rally that could boost the price toward October’s highs zone.

Market Sentiment

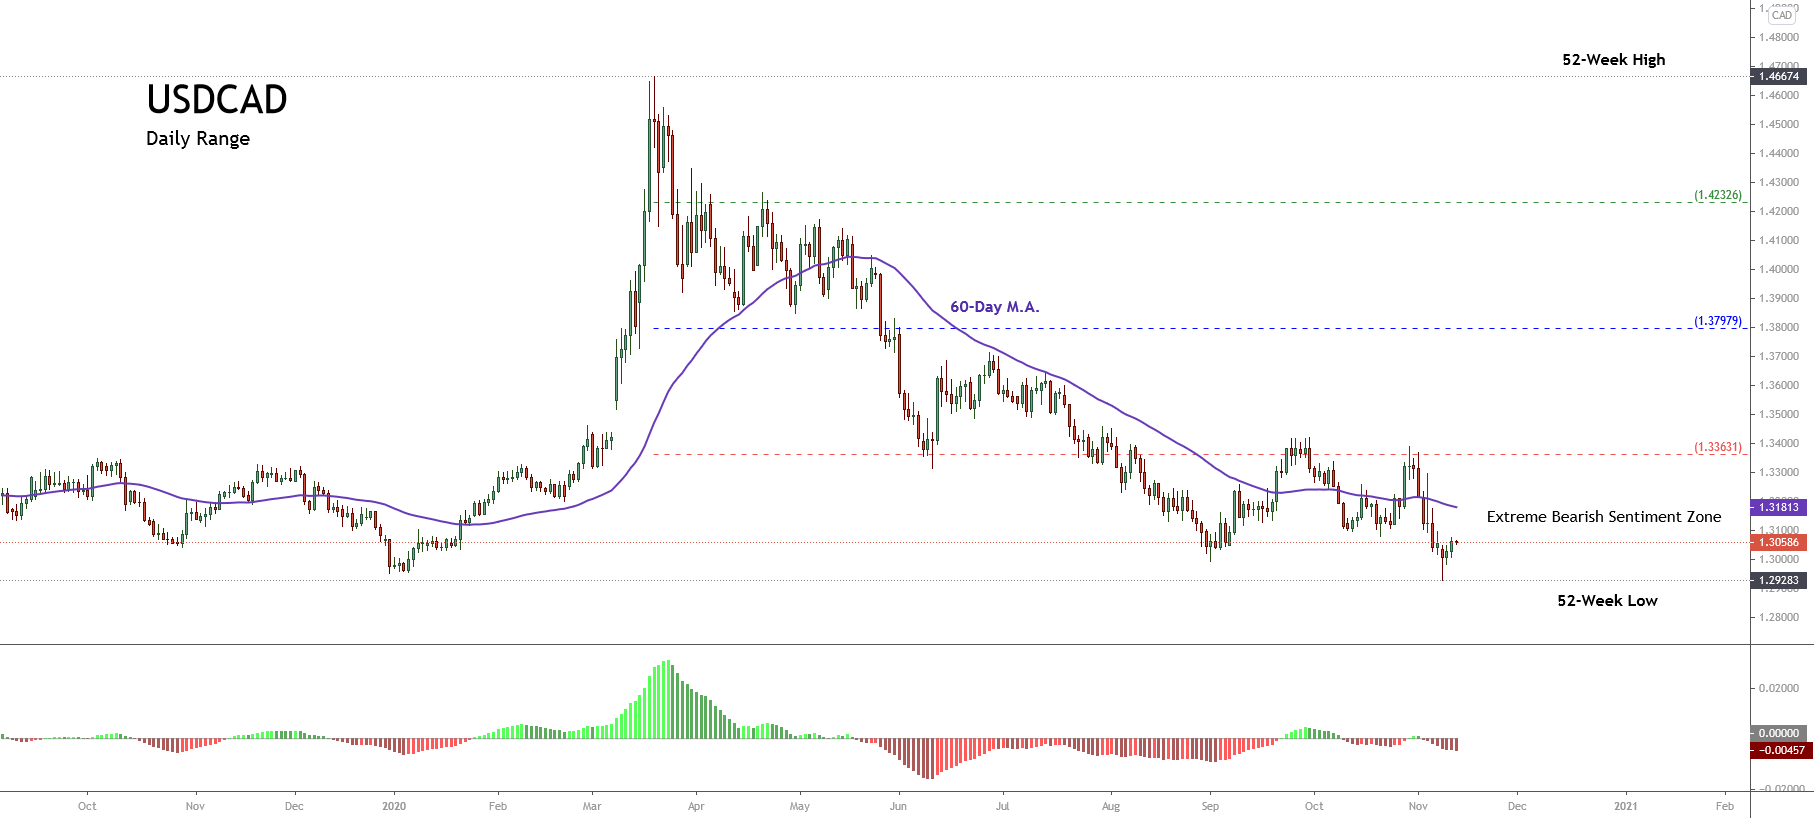
The USDCAD pair continues moving in its extreme bearish sentiment zone, erasing the gains reached during the first quarter of the year when the price advanced over 13%. Currently, the Loonie gains a modest 0.67% YTD.

The next figure illustrates the USDCAD pair in its daily timeframe. The chart exposes the long-term market participants sentiment bounded by the 52-week high and low range. 

The chart reveals the price action continues developing fresh lower lows, which leads us to observe that market participants continue holding bearish positions on the pair. Furthermore, the 60-day weighted moving average continues above the price, which confirms the bearish bias that advances the price.

On the other hand, as long as the USDCAD price remains below 1.33631, the Loonie will stay under bearish pressure.

Technical Overview

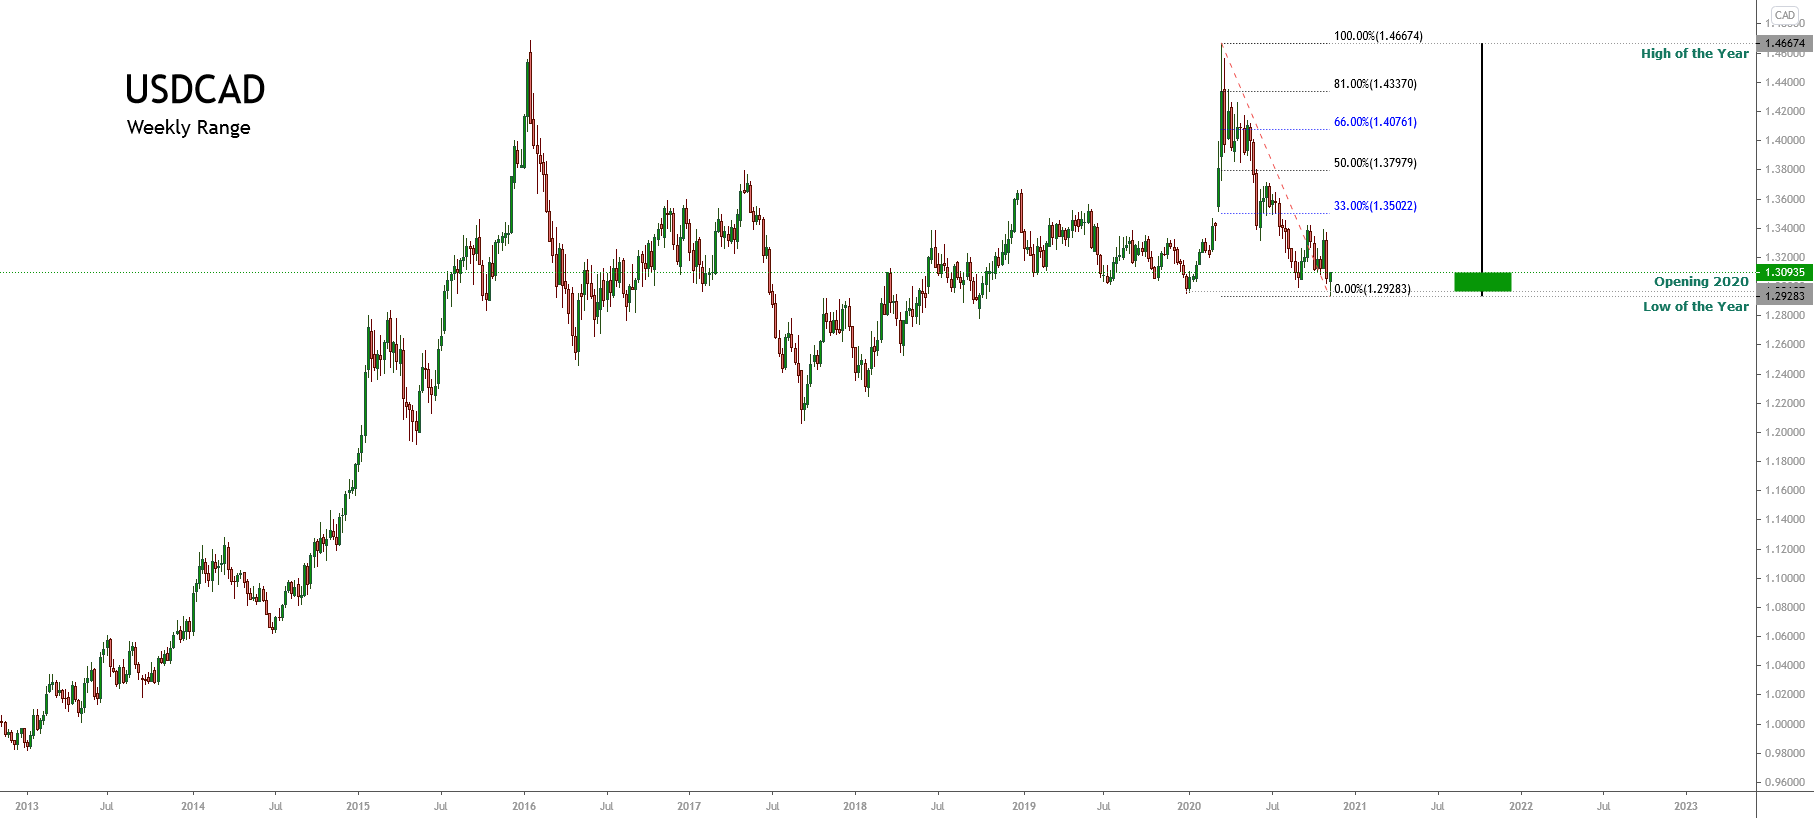
The USDCAD pair exposes a bearish reversal formation that erased the progress developed during the first quarter of the year. The following weekly chart reveals a powerful bearish long-tailed candle in terms of a yearly candlestick, suggesting that the price would continue developing more declines in the long-term.


On the other hand, the big picture exposes a long-term sideways formation that persists since mid-2015. Likewise, the last downward movement that began at 1.46674 appears to have found a bottom on 1.29238 the current trading week. 

In this regard, if the price starts to develop a corrective rally, according to the Dow Theory, the USDCAD pair should advance to 1.35022 and up to 1.40761; this upward sequence would correspond to a valid correction of the same degree that the last bearish move developed by the pair since last mid-March.

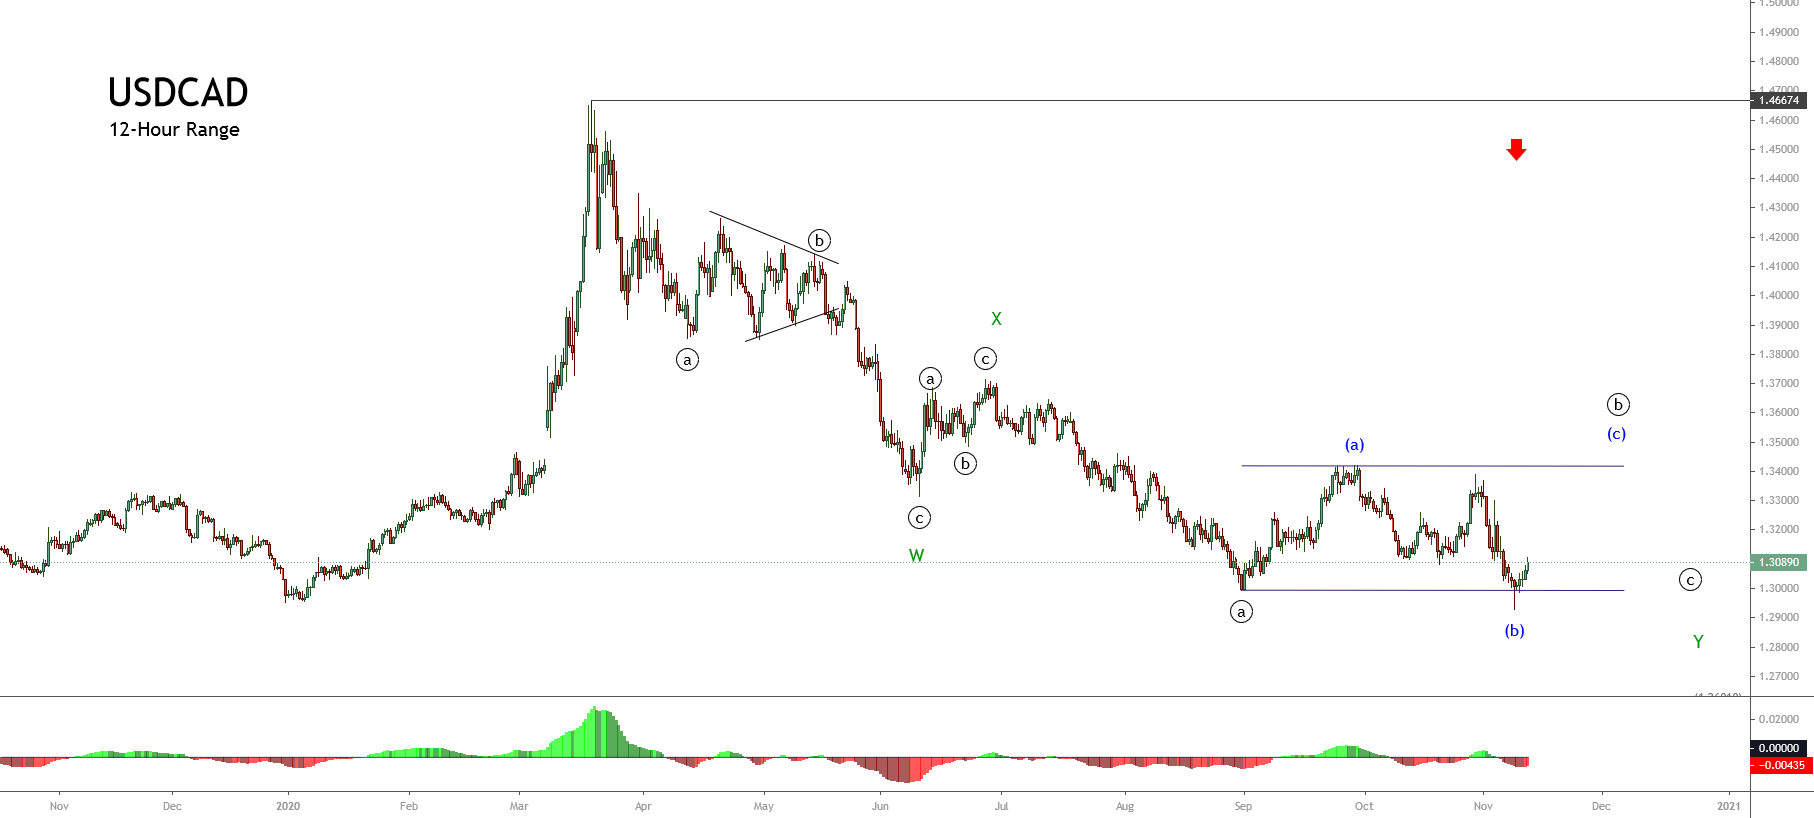
The mid-term Elliott wave view of USDCAD illustrated in the next 12-hour chart reveals an incomplete corrective sequence that looks like a double three pattern (3-3-3) of Minor degree labeled, in green, which began on March 18th at 1.46674.

Currently, the USDCAD develops its wave ((b)) of Minute degree identified in black, which belongs to wave Y in green. In this context, the wave ((b)) looks like an incomplete flat pattern (3-3-5), which subdivides into a 3-3-5 sequence. Moreover, the actual structural series suggests that the Loonie started to develop its wave (c) of the Minuette degree labeled in blue. 

Short-term Technical Outlook

The short-term Elliott wave view of the USDCAD unfolded in the following 8-hour chart, anticipates its progress in an incomplete flat pattern, which could be starting to advance on its wave (c) of Minuette degree labeled in blue.

If the Loonie find fresh buyers in a retracement to the demand zone between 1.30433 and 1.30086, and the price breaks and closes above 1.31473, then the price could confirm the potential rally that corresponds to wave (c) of Minute degree with a potential target in the supply zone between 1.33970 and 1.34592.

Lastly, the invalidation level for the intraday bullish scenario locates at 1.29283

Categories
Forex Market Analysis

Australian Dollar Prepares for Interest Rate Decision and Retail Sales Data Ahead

Overview

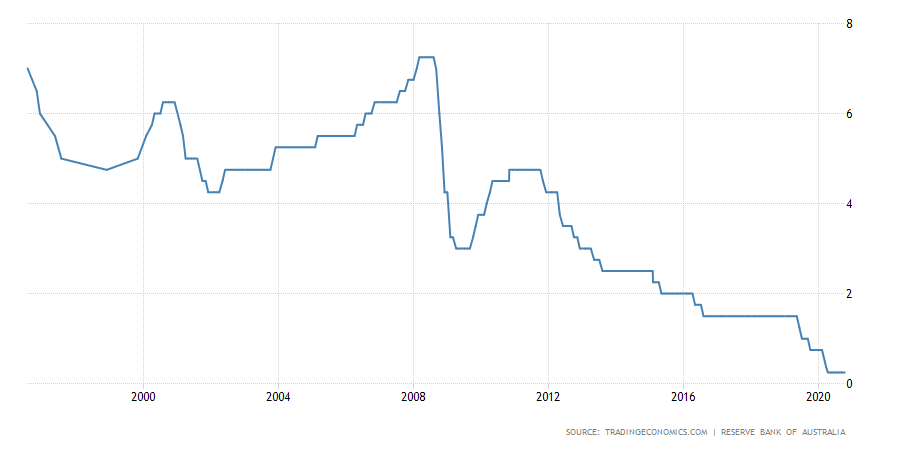
The Australian Dollar will face two high volatility events; the first one corresponds to the interest rate decision, for which the analysts’ consensus foresees a rate cut to 0.1% from the current 0.25%. The second one corresponds to September’s Retail Sales figures, where the consensus expects a recovery. Nevertheless, the price action suggests a new decline before reversing.

Market Sentiment

From a fundamental perspective, the Australian Dollar will have two high volatility events that will drive the next week’s oceanic currency movements.

The first event corresponds to the Interest Rate Decision, which will occur on Monday the 2nd during the overnight session. The analysts’ consensus foresees a reduction from the current rate of 0.25% to 0.10%. 

The last interest rate cut by the Reserve Bank of Australia’s broad members occurred in March 2020, where policymakers decided to cut the reference rate from 0.5% to 0.25%.

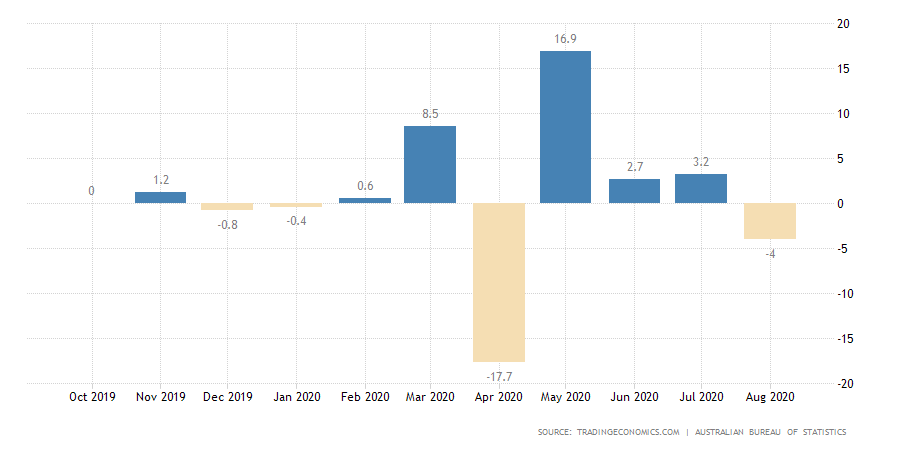
The second high impact will occur in the overnight trading session of Tuesday 03rd, where the Australian Bureau of Statistics will release the Retail Sales (MoM) data corresponding to September. The analysts’ consensus foresees a decline to 1.5%. 

Although the analysts’ polled foresee a contraction for September, they expect an improvement in the retail sector after falling 4% in August.

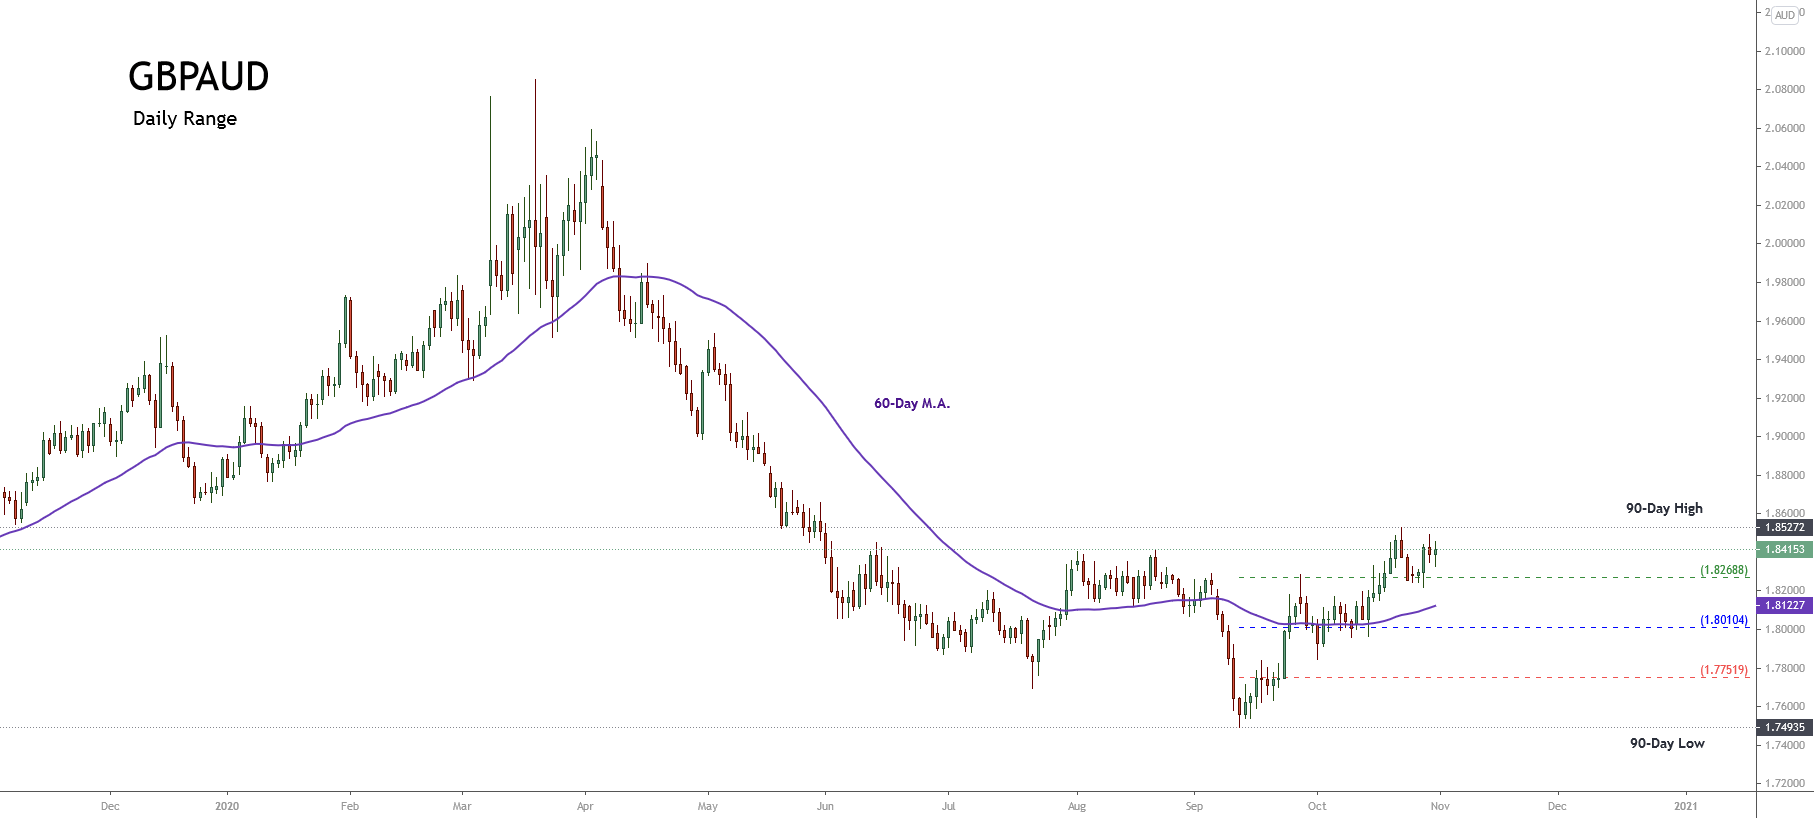
On the market sentiment side, the GBPAUD cross in its daily chart exposes the 90-day high and low range, which reveals the short-term participants’ sentiment. 

The previous chart illustrates the price action moving in an upward sequence that began on September 11th that pushed the cross from the extreme bearish sentiment zone toward the extreme bullish sentiment zone. 

In fact, the 60-day moving average movement below the price confirms the bullish bias that carries the cross. The next supports locates at 1.82688, which corresponds to the extreme bullish sentiment zone support, and 1.81227 corresponds to the 60-day moving average that acts as a dynamic support.

In summary, considering the pessimistic forecasts by the Australian data analysts and the extreme bullish sentiment unveiled in the GBPAUD cross, there exist the possibility of further weakness in the oceanic currency.

Technical Analysis Outlook

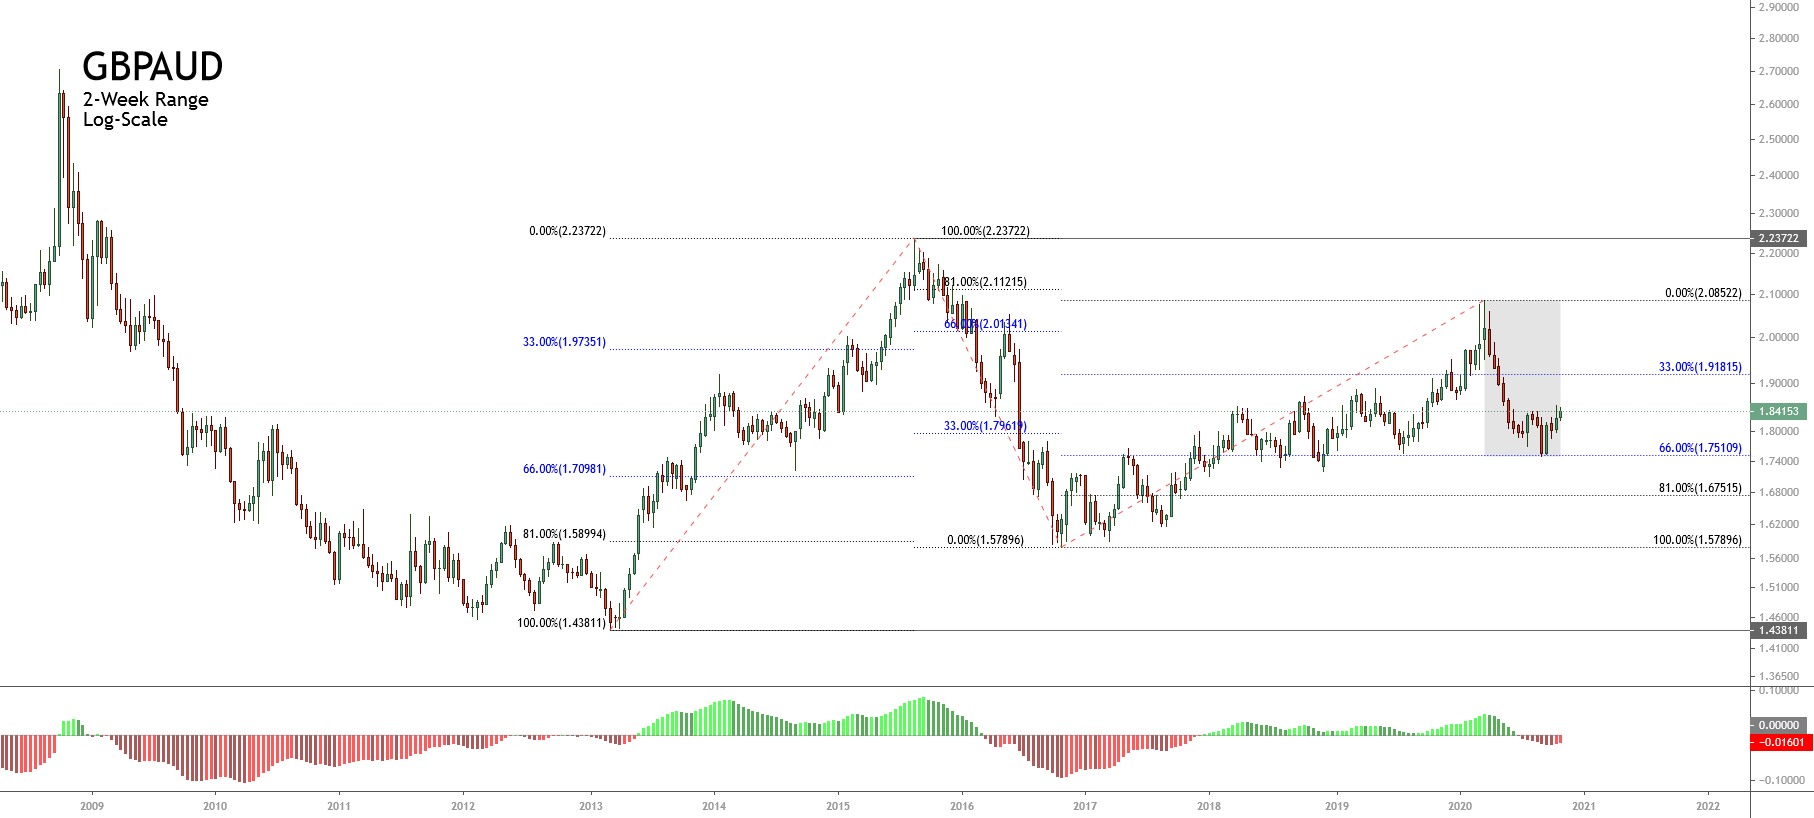
The big picture of the GBPAUD cross under the Dow Theory exposed in its 2-week log-scale chart reveals the price is moving mostly sideways since early March 2013, when the price touched its bottom of 1.43811. Once the cross found buyers, the price raised until 2.23722 reached in mid-August 2015. 

Once the March 2015 high was reached, the pair started to correct the Primary trend finding support at 1.57896 in late October 2016. This correction accomplishes the Dow Theory rule that says that the Secondary trend retraces between 33% to 66% of the Primary trend. 

The same situation occurs with the ascending sequence that advances from 1.57896 toward 2.08522 reached in mid-March 2020, which retraces beyond 66% of the previous decline. 

Likewise, the GBPAUD cross started to develop a downward sequence, which found a bottom at 66% of the previous rally. Nevertheless, considering the price and time relationship between the last decline and the previous two movements, we conclude that this decline corresponds to the Minor trend of the Secondary upward trend, which looks incomplete. 

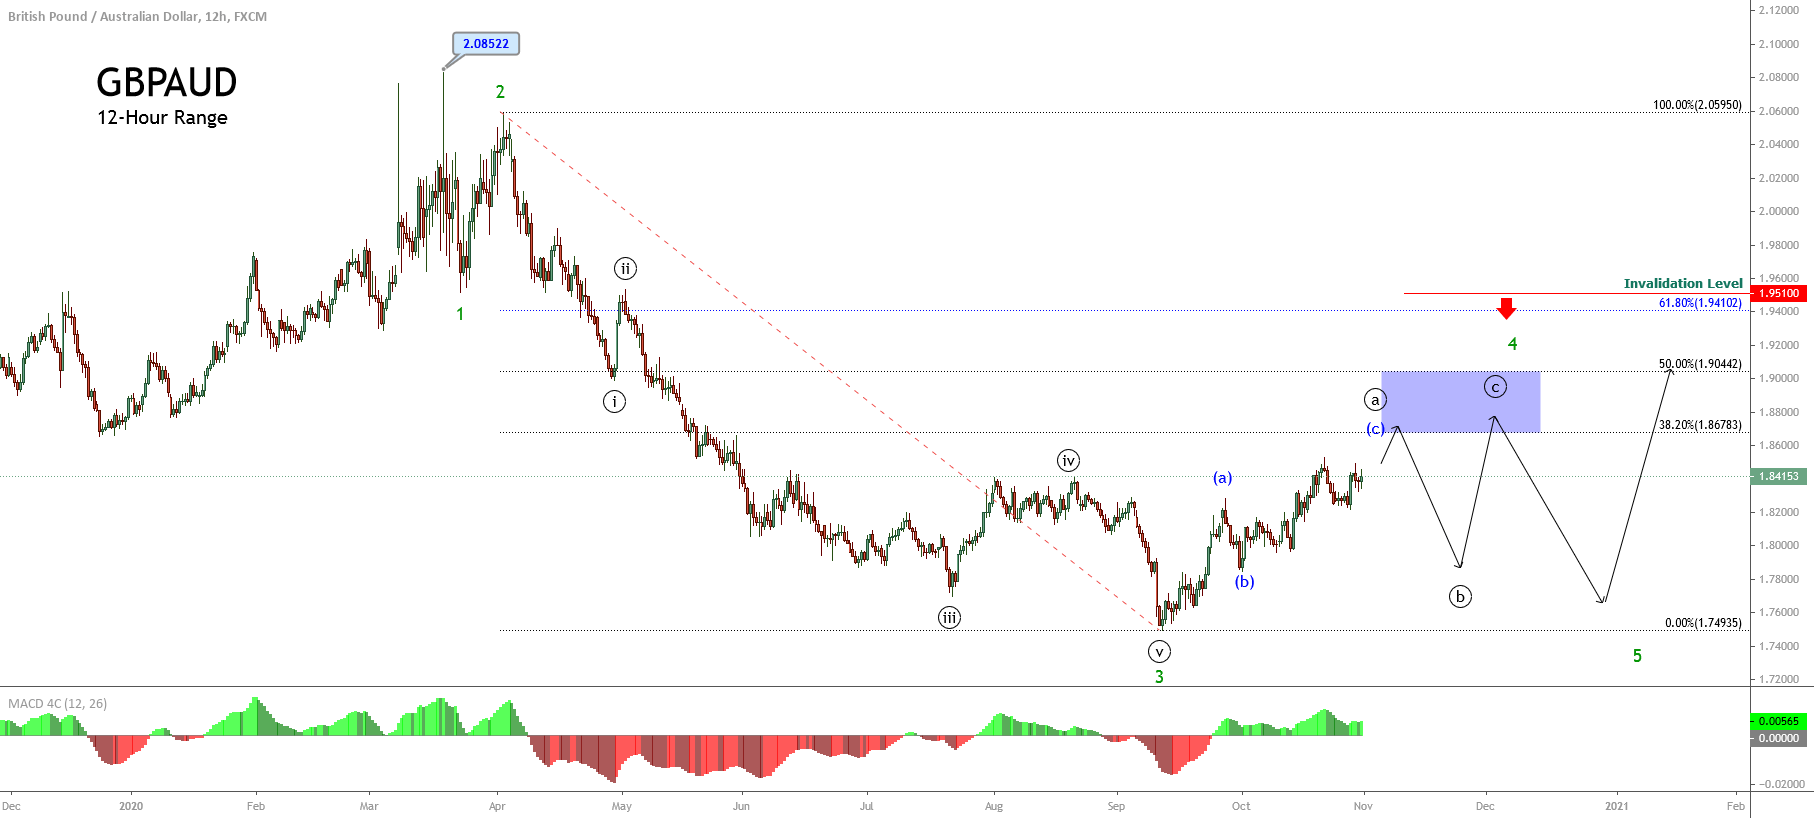
The GBPAUD outlook under the Elliott Wave Theory exposes the progress in a downward five-wave sequence, which advances in its incomplete wave 4 of Minor degree labeled in green. This corrective structural series currently moves in its wave ((a)) of Minute degree identified in black.

Considering the elliott Wave theory, the current wave in progress should develop three internal segments and advance until the zone between 1.86783 to 1.90442, where the cross could find resistance and start its wave ((b)) in black.

Likewise, considering that the third wave of Minor degree is the extended wave, the fifth wave should fail to reach a lower low than the end of the third wave of Minor degree located at 1.74935. Finally, the invalidation level of the bearish scenario is located above 1.95100.

Categories
Forex Market Analysis

US Dollar Index Advances Boosted by Surprising Economic Growth

Overview

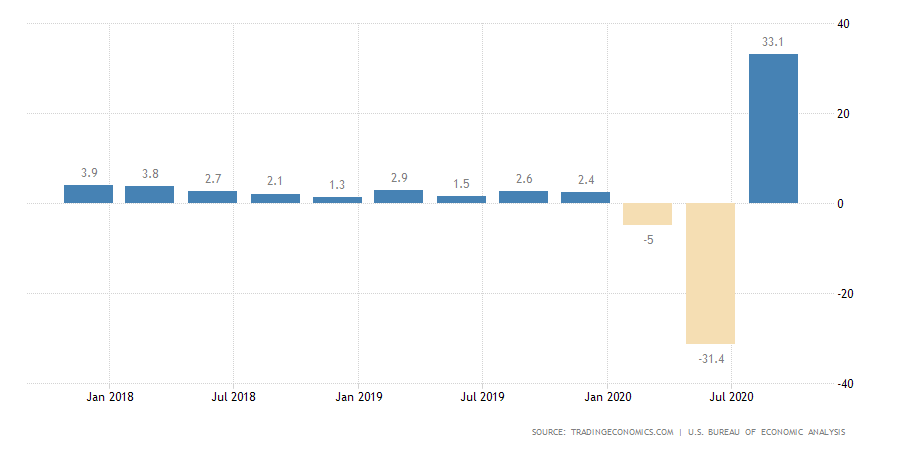
The US Dollar Index accelerated its gains on Thursday’s trading session boosted by the surprising economic recovery in Q3 2020 that advanced 33.1%, beating analysts’ expectations. Nevertheless, although Greenback’s intraday recovers, the price could see a new decline in the coming trading sessions.

Market Sentiment 

The US Dollar Index (DXY) raises on Thursday trading session by 0.54%, boosted by Q3’s GDP growth rate, which beat the analysts’ expectations.

The US economy expanded in the third quarter by 33.1% in Q3 2020, beating the analysts’ consensus of a 31% raise. This reading is the biggest expansion in the economy following the previous  Q2 period, which unveiled a record 31.4% plunge triggered by the coronavirus lockdown.

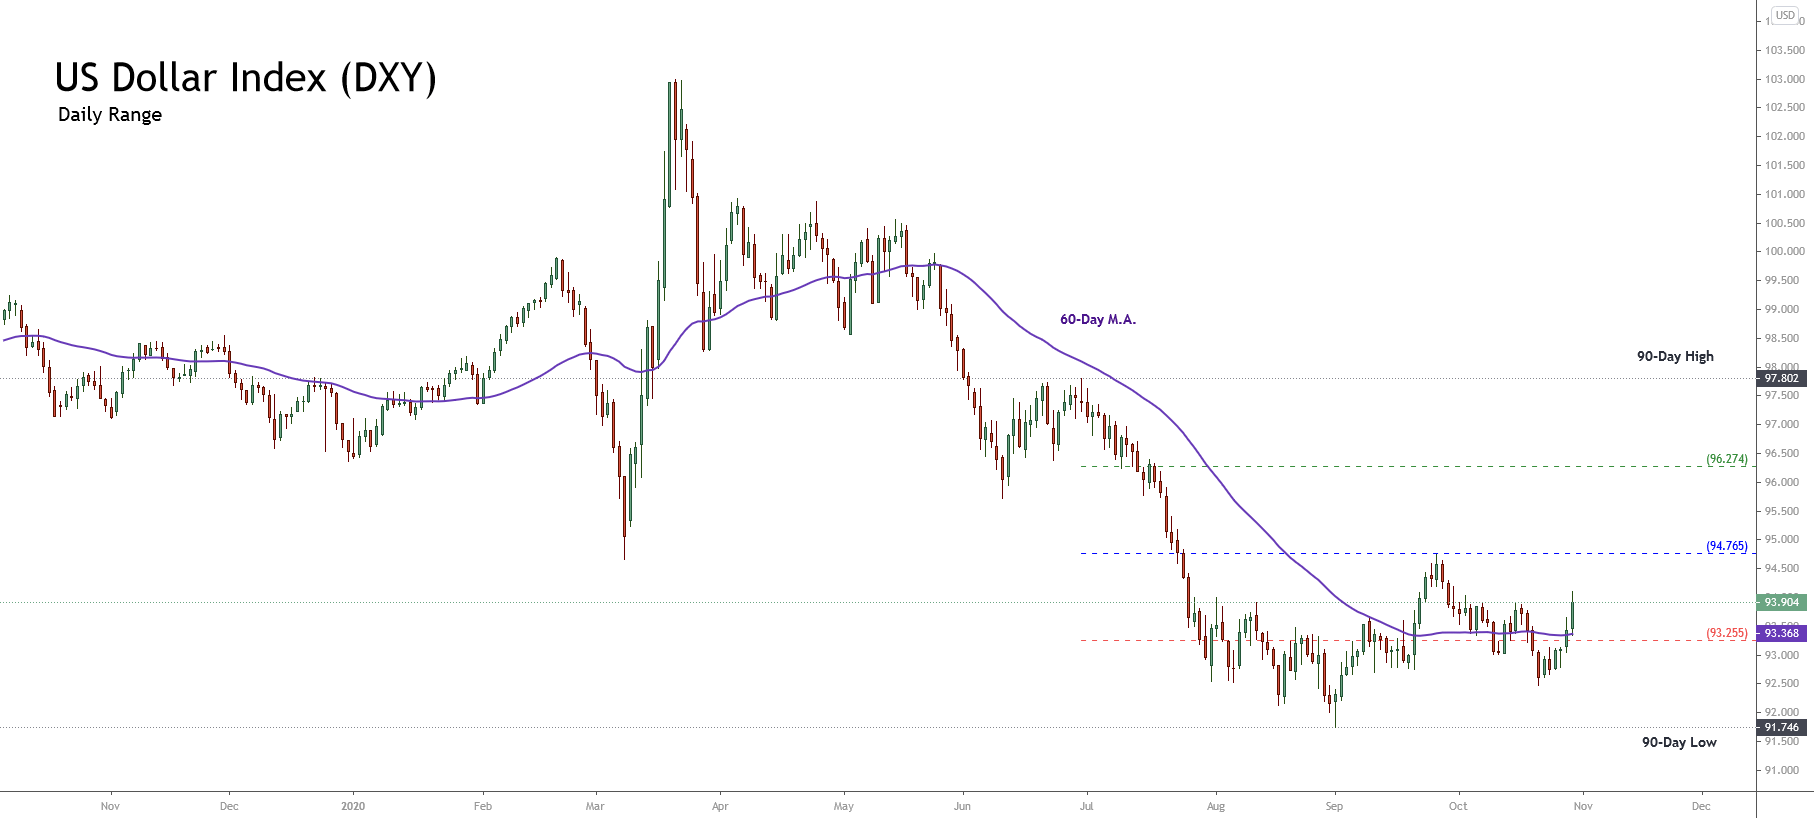
The following chart exposes the US Dollar Index in its daily timeframe. The figure unveils the 90-day high and low range, the price action moving mostly sideways in the bearish sentiment zone. 

Likewise, the intraday activity develops a strong bullish movement during its Thursday’s trading session, which looks accelerating, supported, as already said, by the surprising Q3 GDP growth, whose figure was released on Thursday before the US session’s opening bell. 

In summary, the US Dollar Index context shows that the big picture of the market is on the bearish side. However, the intraday activity reveals an upward thrust representing an upward correction of the Greenback’s primary bearish trend.

Technical Analysis Outlook

On the technical side, the US Dollar Index unveils its price movements in an incomplete corrective formation, which still could visit fresh lows.

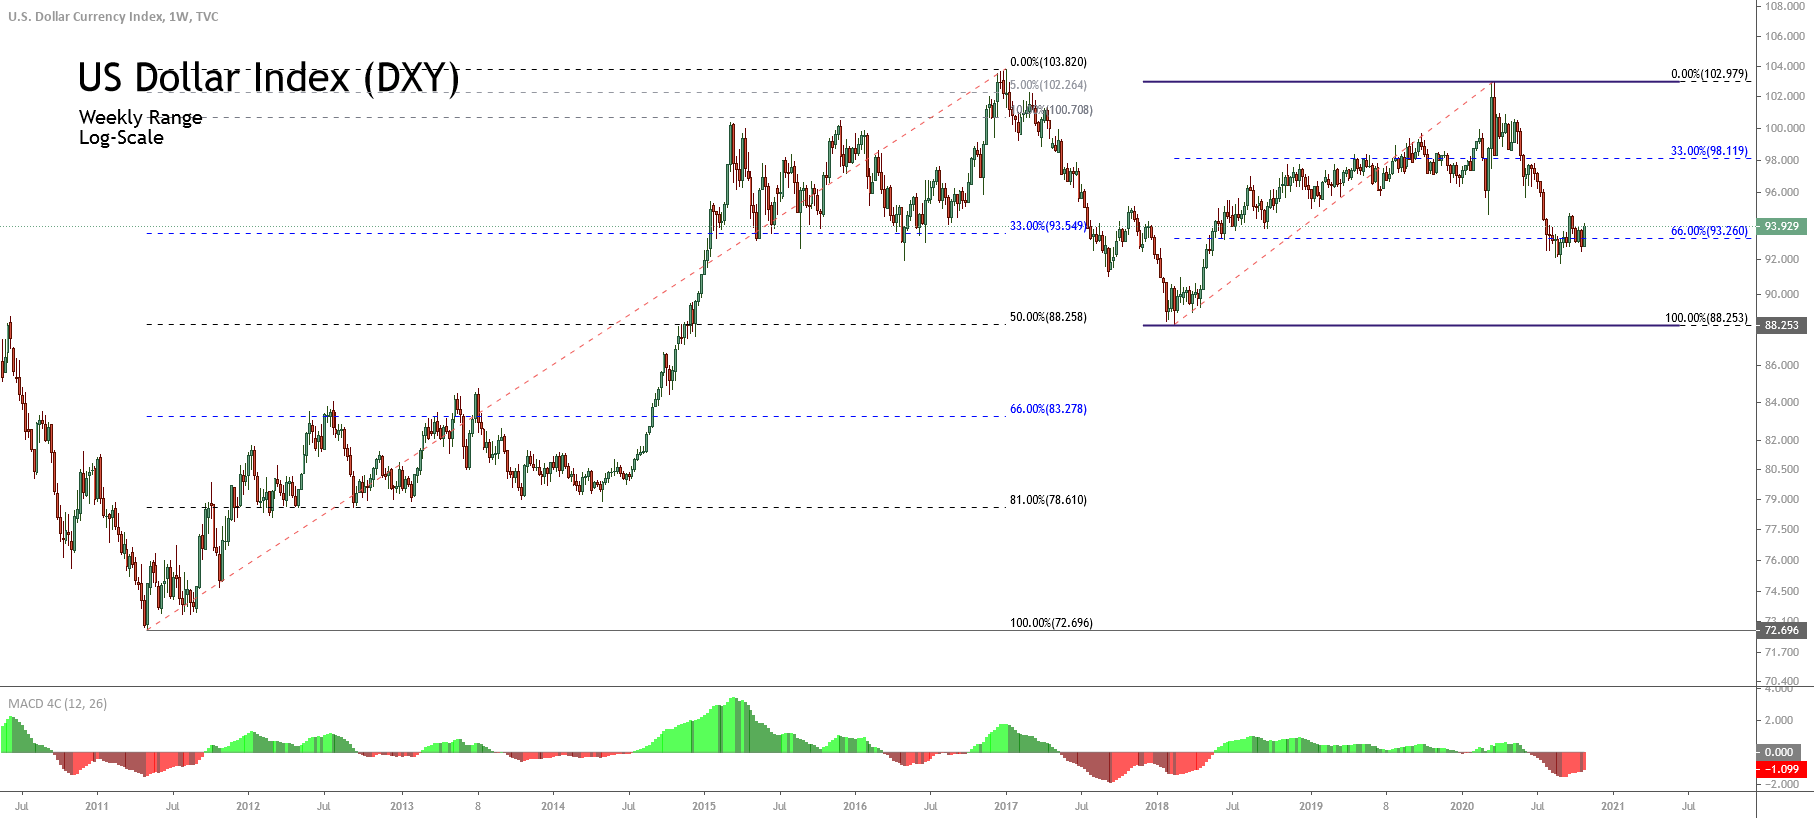
The next weekly chart and in log scale reveals the DXY under the perspective of the Dow Theory, which exposes to its primary trend developing an incomplete correction of the rally that the Greenback began in early May 2011 and found resistance at 103.82 in late December 2016.

Once the Dollar Index found fresh buyers, the public activity raised, driving the price towards the level of 103.82, where DXY began to develop a corrective move, which remains in progress. The first decline fell to 50% of the previous rally, finding support at 88.25, where the price reacted, developing an upward sequence.

Actually, the price action develops a consolidation structure following a sideways formation, which is in progress since early January 2018. The third segment, which looks in place, accumulates a retracement of around 66% of the corrective formation’s second internal leg. This reading leads us to observe that the current decline could be in an exhaustion stage.

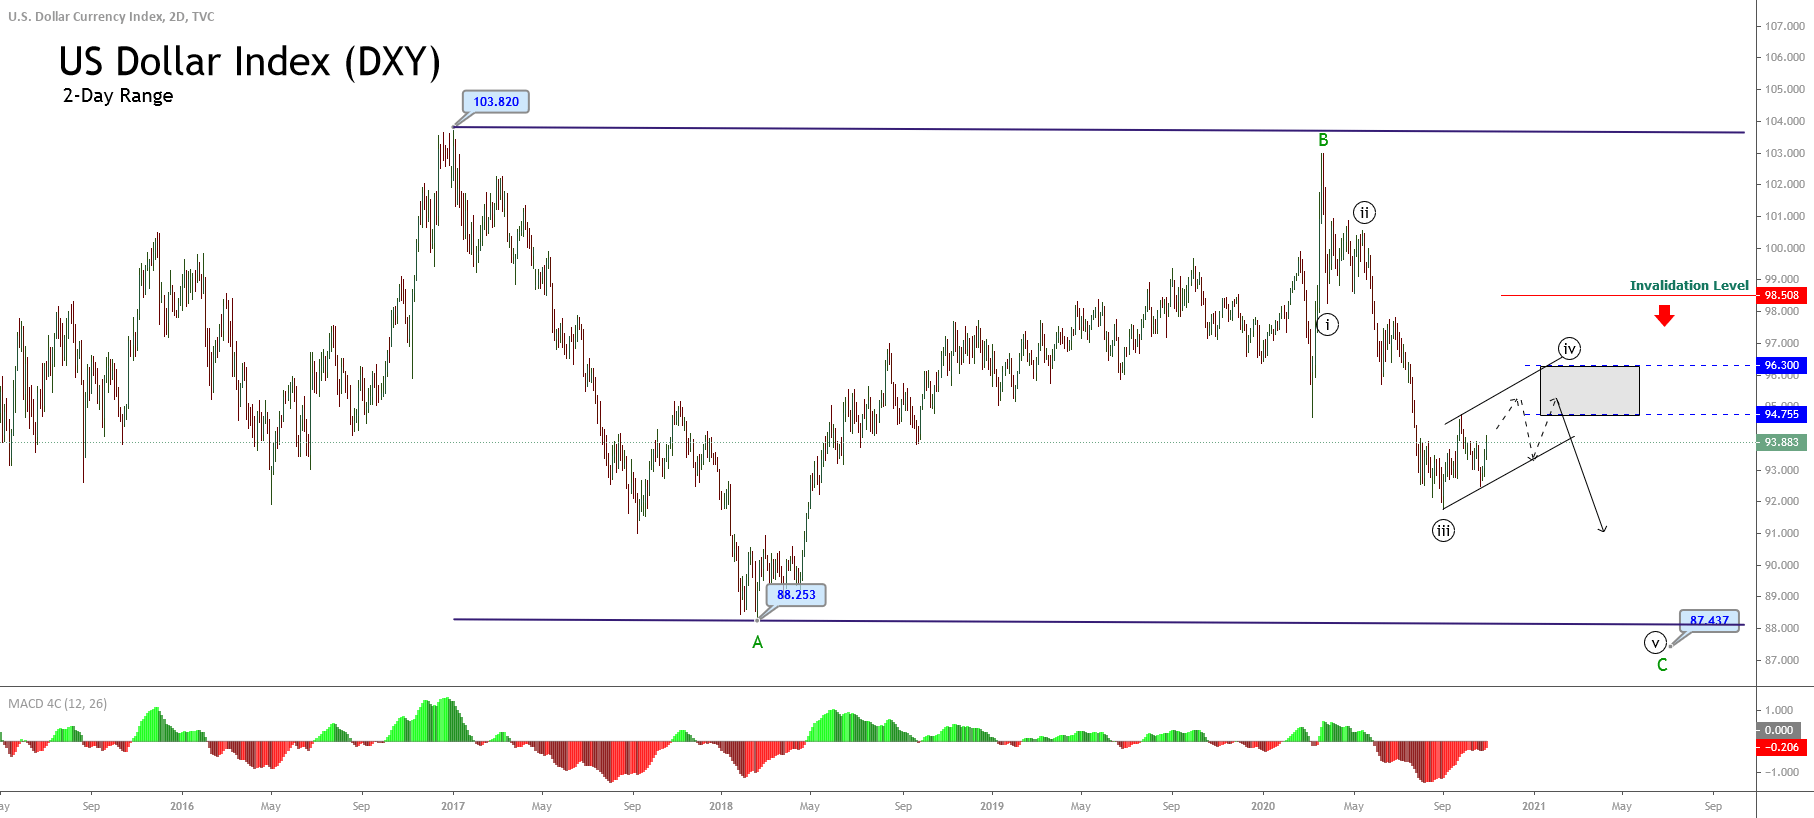
The long-term Elliott Wave perspective for DXY marks its advancement in an incomplete flat pattern (3-3-5), which currently advances in its wave C of Minor degree labeled in green. This current leg could see further declines in the coming trading sessions.

As illustrated in the next 2-day chart, DXY advances its wave ((iv)) of Minute degree identified in black. According to the alternation principle, the internal segment should take more time than wave 2. In this regard, the level of complexity of this corrective formation should be higher than on the second wave. In other words, the fourth wave could be a triangle formation or a double or triple correction.
Finally, the wave C’s potential bearish target can be located below the mid-February 2018 low; it is near the 87.5 level, where the Greenback could start to develop a new bullish cycle of upper degree. The invalidation level of the current bearish scenario is placed at 98.50.

Categories
Forex Market Analysis

How Elliott Wave View of NASDAQ Anticipates Trump’s Coronavirus Outcome

Overview

The NASDAQ 100 Index fell 2.2 percent on Friday’s trading session on the news of the US President Donald Trump’s positive coronavirus test. Still, the price action unveiled the wave B completion, suggests further declines for the US technologic benchmark in the following trading sessions.

Market Sentiment Overview

During the last trading week, the NASDAQ 100 volatility has been driven by market participants’ expectations facing the first presidential debate between US President Donald Trump and former Vice President Joe Biden.

The advance experienced by the technology index was boosted by the expectation of new economic stimulus, driving the NASDAQ 100 to raise over 4%. However, its gains were lowered after the announcement of President Trump’s positive Coronavirus test, leading it to ease up to 2.74% on Friday’s trading session.

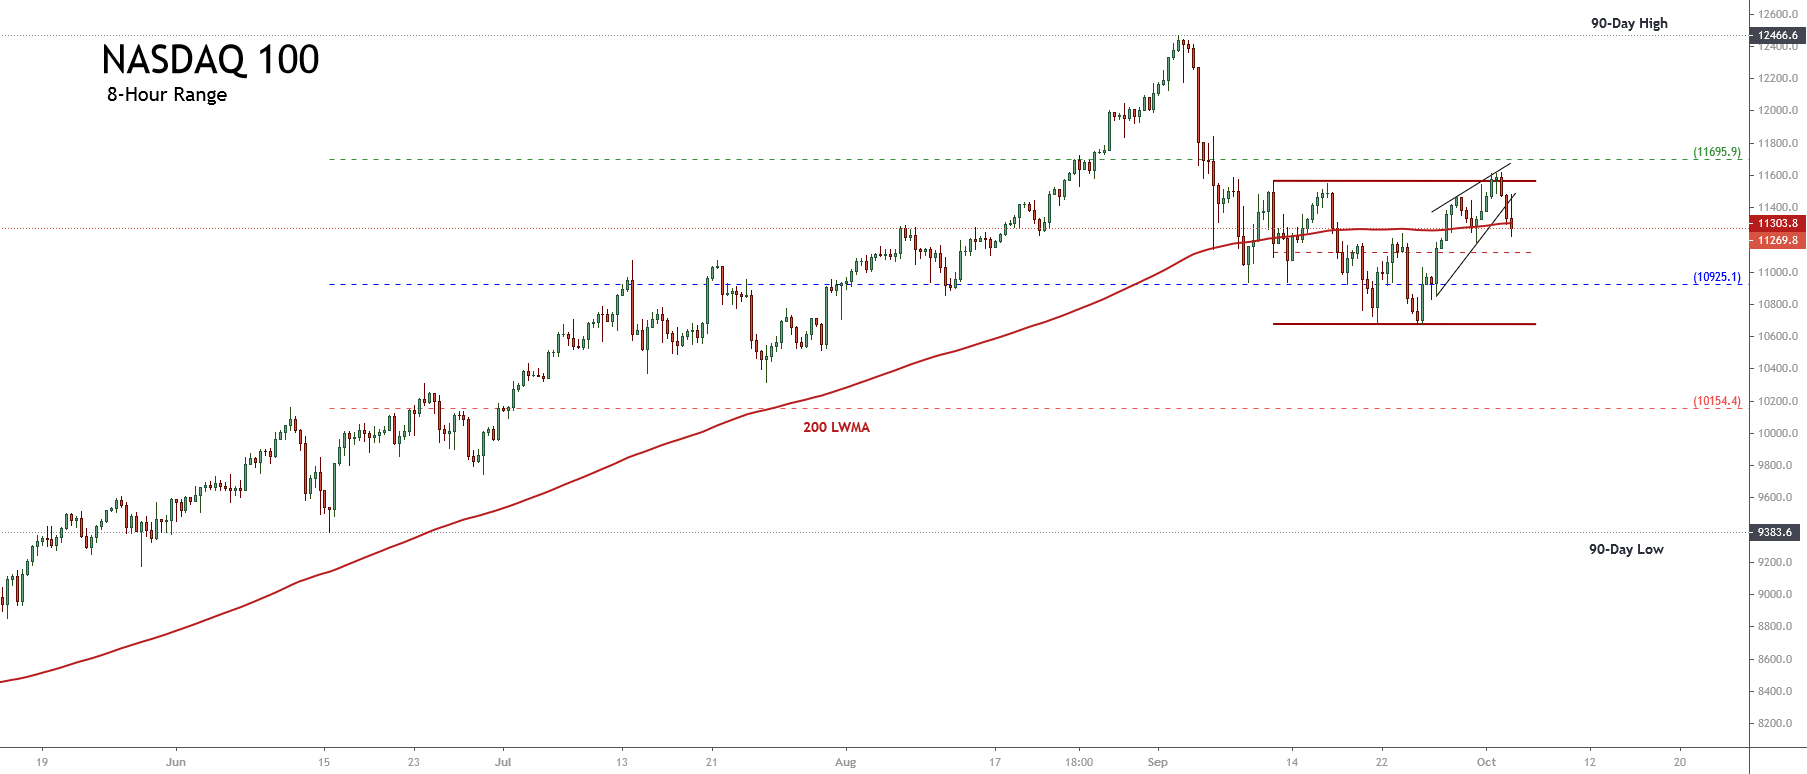
The following 8-hour chart of NASDAQ 100 reflects the 90 days high and low range. In the figure, we distinguish that the price halted its advance towards the extreme bullish sentiment zone, closing the trading week in the bullish market sentiment area and under the weighted 200-day moving average. This market context leads us to weight a neutral market sentiment.

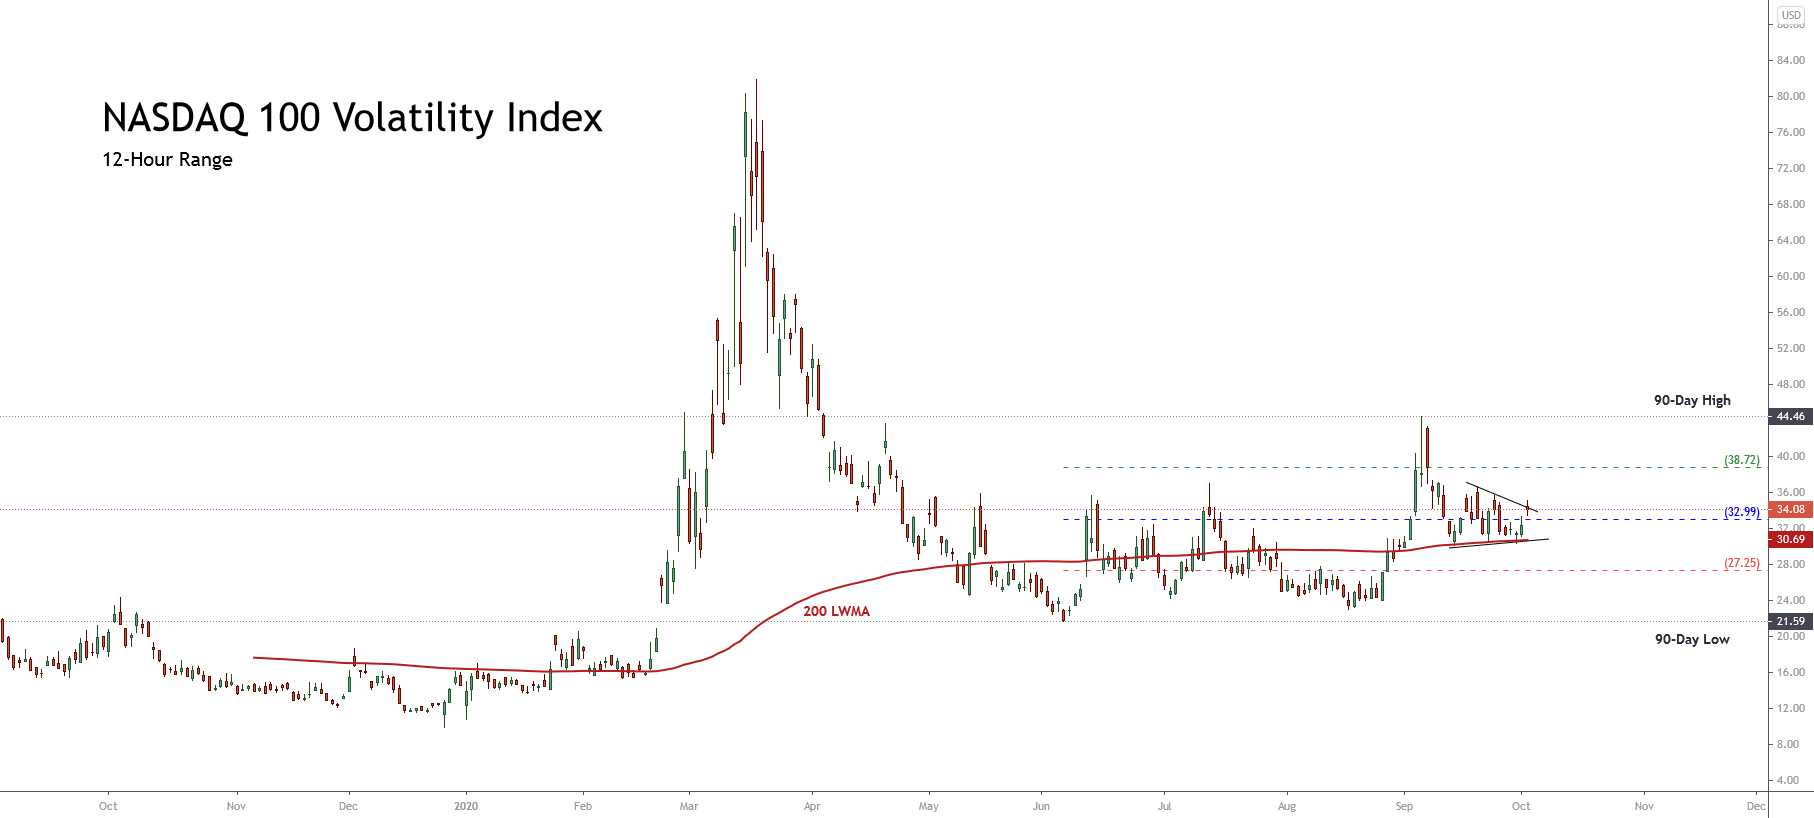
On the other hand, the 12-hour chart corresponding to the NASDAQ 100 Volatility Index shows the 90 days high and low range where we distinguish a sideways movement consolidating above the 200-period weighted moving average. This volatility context of the NASDAQ 100 index, added to the new test of the upper-line of the consolidation structure, leads us to expect an increase in volatility within the coming trading sessions.

Summarizing, NASDAQ 100’s market sentiment unveils that this index and its volatility figures will be driven by the news on the upcoming presidential elections on Tuesday, November 03. In particular, NASDAQ 100 could turn bearish in the following trading sessions.

Elliott Wave Outlook

The overview of NASDAQ 100 shows the full development of a five-wave bullish sequence, which began on June 15, when the price found fresh buyers at 9,383.6 pts pushing the price towards new record highs September 02 at 12,466.6 pts. Once reached the all-time high, the technological index began to perform a bearish corrective movement, which remains in progress.

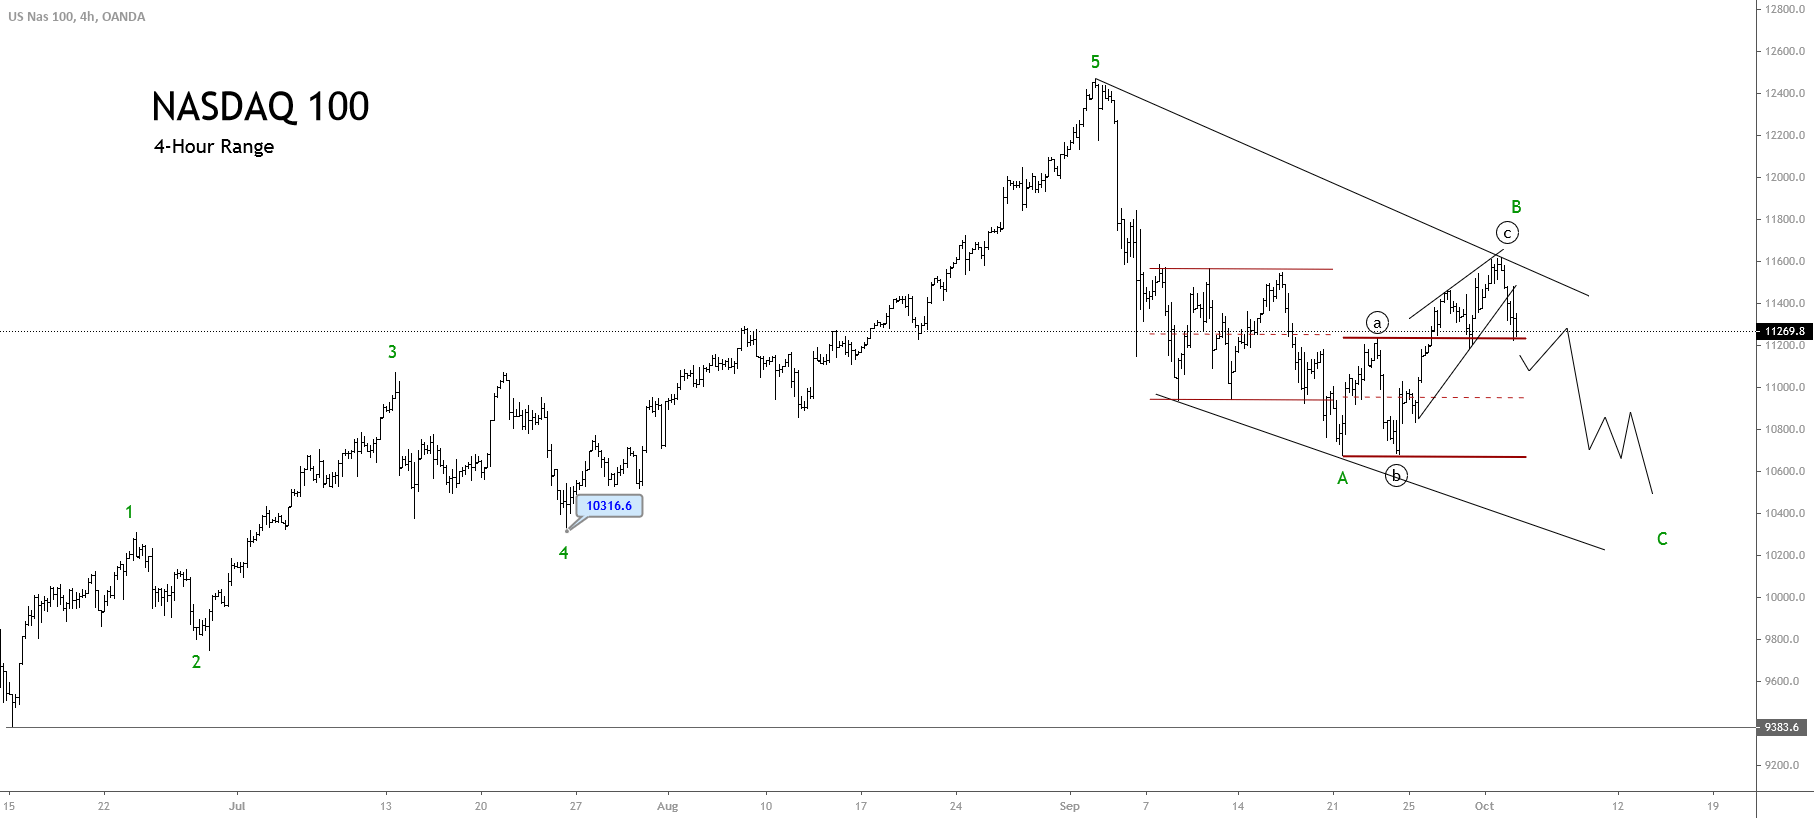
The following chart shows the NASDAQ 100 in its 4-hour timeframe, where we distinguish that the price has completed a five-wave impulsive structure of Minor degree labeled green. At the same time, we can confirm that the Elliott wave theory rule, stating that there must be only one extended wave. In this case, the NASDAQ 100 index developed a fifth extended wave that ended on September 02 when the price found resistance at 12,466.6 pts. Once the fifth wave of Minor degree concluded, the NASDAQ 100 began performing a corrective sequence, which remains in progress.

In particular, the completion of the wave ((c)) of Minute degree identified in black, which completed the wave B of Minor degree, coincided with the news media release concerning the US President Trump’s positive test, activating the beginning of the wave C, labeled in green.

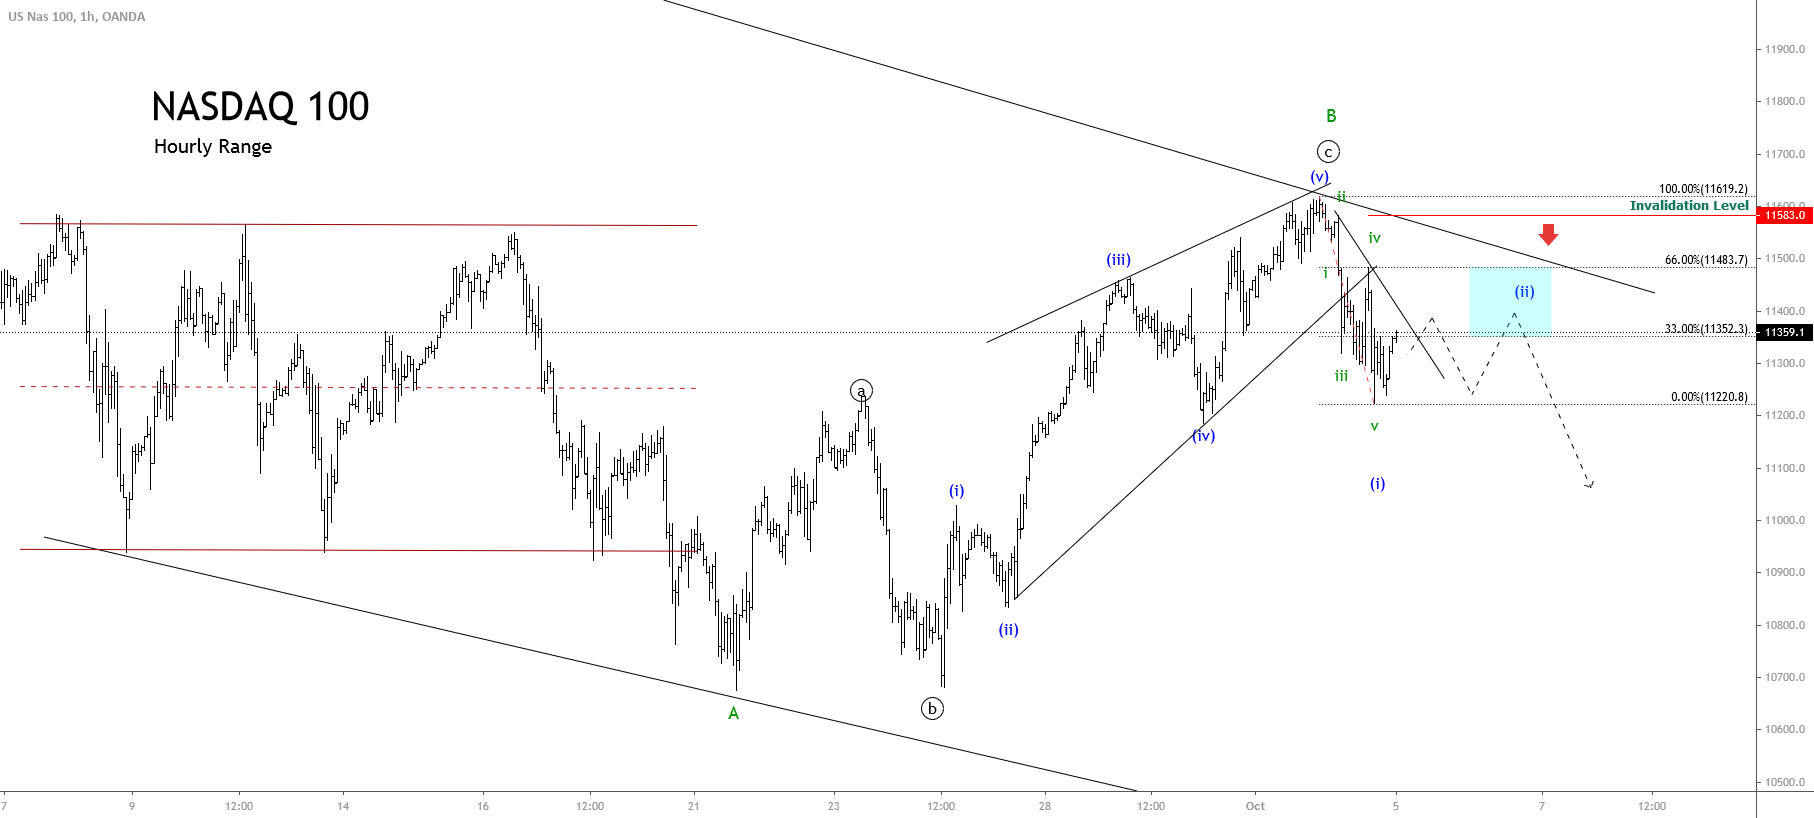
The following hourly chart of NASDAQ 100 illustrates the first bearish movement’s internal structure corresponding to its wave (i) of the Minuette degree identified in blue. This first downward wave reveals a drop in five moves of Subminuette degree identified in green in its internal formation. Once this second move has been completed, the technological benchmark should resume its declines.
Finally, considering that wave (i) of Minuette degree completed its descending move at 11,220.8 pts on Friday 02nd, the price could retrace, forming its second wave of the same degree. In terms of the Dow Theory, this retrace could be between 33% and 66%, or between the 11,352.3 pts and 11,483.7 pts, where NASDAQ 100 might start to develop a new decline, corresponding to wave (iii) in blue.