The EURUSD eased the last trading week, losing 1.18%, leaving away from the yearly high at 1.23495 reached on last January 06th. The common currency accumulates losses by 1.14% (YTD), which, added to other market conditions commented in our current analysis, carries us to expect further declines in the following trading sessions.
1. Retail Traders Seems to Look for Long Positions
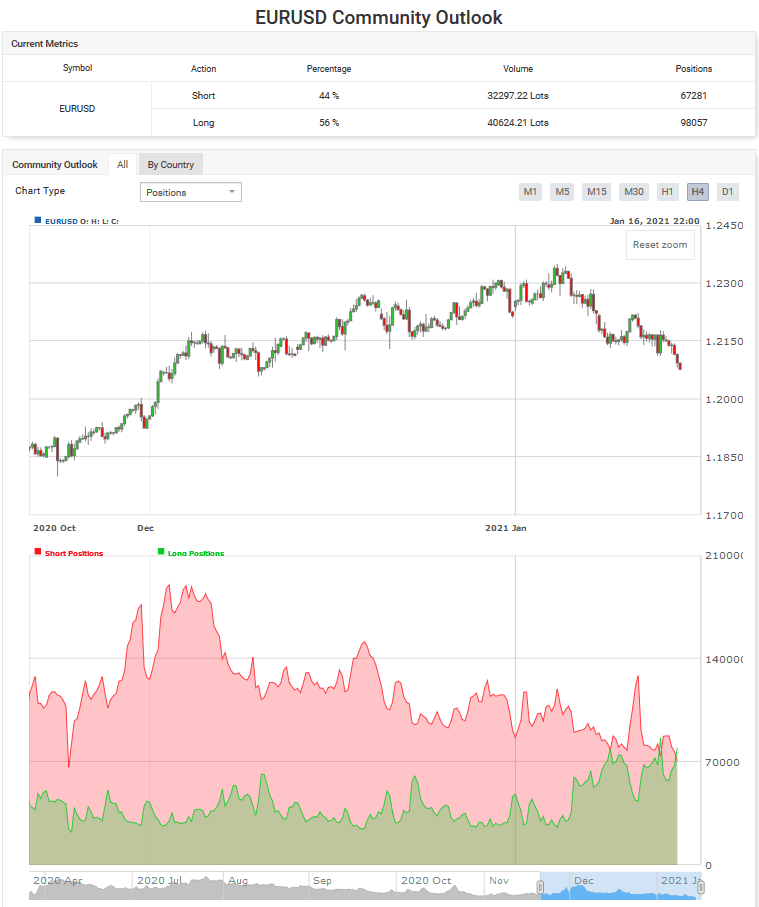
Retail traders tend to place their trades against the primary trend, remaining on the wrong side on most occasions. Regarding this market participant behavior context, retail traders reduced their short positions from 79.77% reached last January 06th to 44% last Friday’s session, as the EURUSD pair accelerated its decline.
Source: myfxbook.com
Retail traders’ increasing positioning to the long-side carries us to sustain the prospect for further declines in the following trading sessions.
2. The Price Violated its Short-Term Upward Trendline
The big picture of EURUSD illustrated in its daily chart reveals the violation of the secondary trendline plotted in green, corresponding to the last rally developed by the common currency since November 04th from the 1.16025 level, which found resistance on January 06th at 1.23495. This market context leads us to observe that the price could develop a correction proportional to the last rally.
In this regard, the Dow Theory view suggests that EURUSD’s corrective move depth might lie between 33% (1.21030) and 66% (1.18565). Moreover, the price could find support in the long-term upward trendline plotted in blue.
3. Timing and Momentum Oscillator Supports the Elliott Wave View.
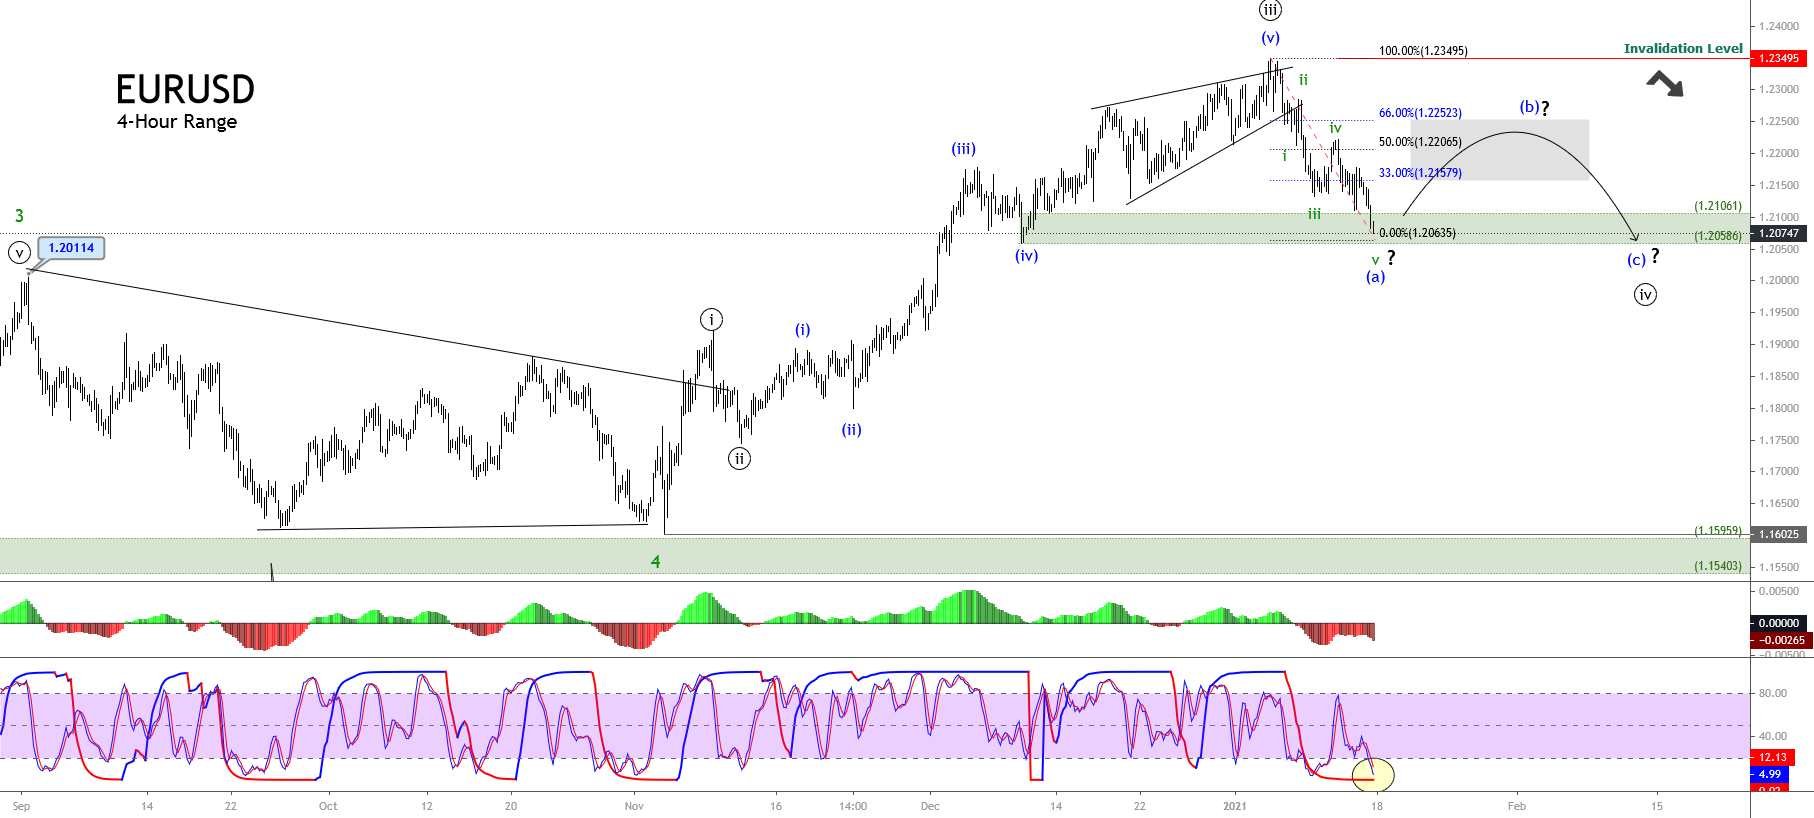
The intraday Elliott wave view for the EURUSD pair exposed in the next 4-hour chart shows the completion of an ending diagonal pattern corresponding to wave (v) of Minuette degree labeled in blue and its bearish reaction after its finalization.
Once the common currency topped at 1.23495, the price developed an intraday corrective move subdivided into five internal segments of Subminuette degree identified in green. This five-wave sequence of lesser degree carries us to expect the progress in a potential zigzag pattern (5-3-5).
On the other hand, the timing and momentum oscillator lead us to observe the first downward sequence’s exhaustion corresponding to wave (a) in blue. In consequence, the common currency should develop a corrective rally corresponding to wave (b). This upward move could hit the zone between 1.21576 and 1.22523.
Once the EURUSD completes its wave (b) in blue, the price action should start its bearish wave (c), which follows an internal structure subdivided into five waves. In this context, the bearish scenario’s invalidation level can be found at the end of wave (v) at 1.23495.
What’s Next?
According to Myfxbook.com’s Community Outlook, 56% of retail EURUSD traders are positioned to the long side. Likewise, the violation of a short-term upward trendline carries to expect further declines in the common currency for the coming trading sessions. Nevertheless, the EURUSD could be at the end of the first segment of a corrective formation. In this context, the price could develop an upward bounce that could reach the zone between 1.21579 and 1.22523. After the bounce conclusion, the common currency could find fresh sellers expecting to join a new downward sequence corresponding to wave (c).
If you are interested in finding trading opportunities using the Elliott Wave Principle, follow our Forex.Academy Educational Section.


