Categories
Forex Elliott Wave Forex Technical Analysis

Three Things you Ought to Know Before Buying EURUSD

The EURUSD eased the last trading week, losing 1.18%, leaving away from the yearly high at 1.23495 reached on last January 06th. The common currency accumulates losses by 1.14% (YTD), which, added to other market conditions commented in our current analysis, carries us to expect further declines in the following trading sessions.  

1. Retail Traders Seems to Look for Long Positions

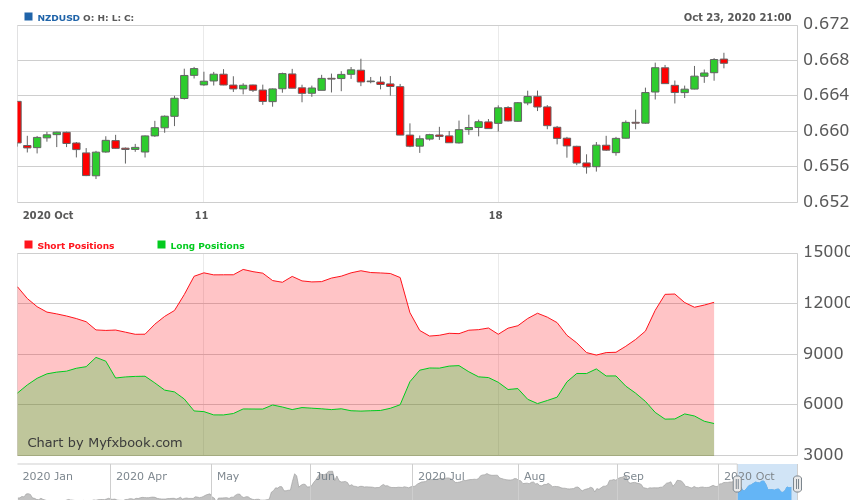
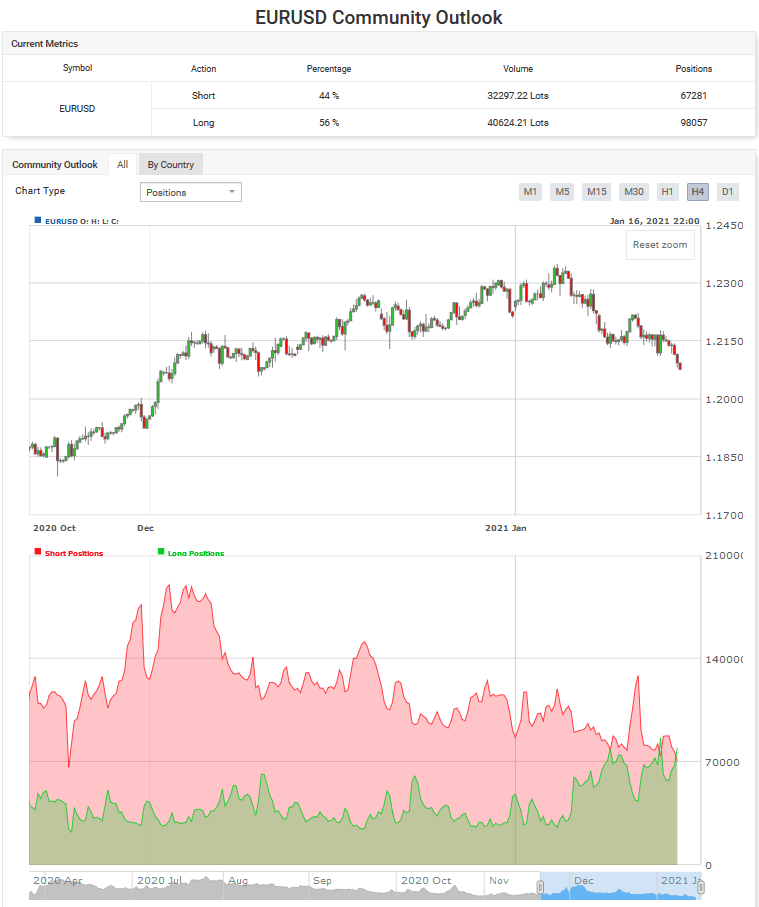
Retail traders tend to place their trades against the primary trend, remaining on the wrong side on most occasions. Regarding this market participant behavior context, retail traders reduced their short positions from 79.77% reached last January 06th to 44% last Friday’s session, as the EURUSD pair accelerated its decline. 

Source: myfxbook.com

Retail traders’ increasing positioning to the long-side carries us to sustain the prospect for further declines in the following trading sessions.

2. The Price Violated its Short-Term Upward Trendline

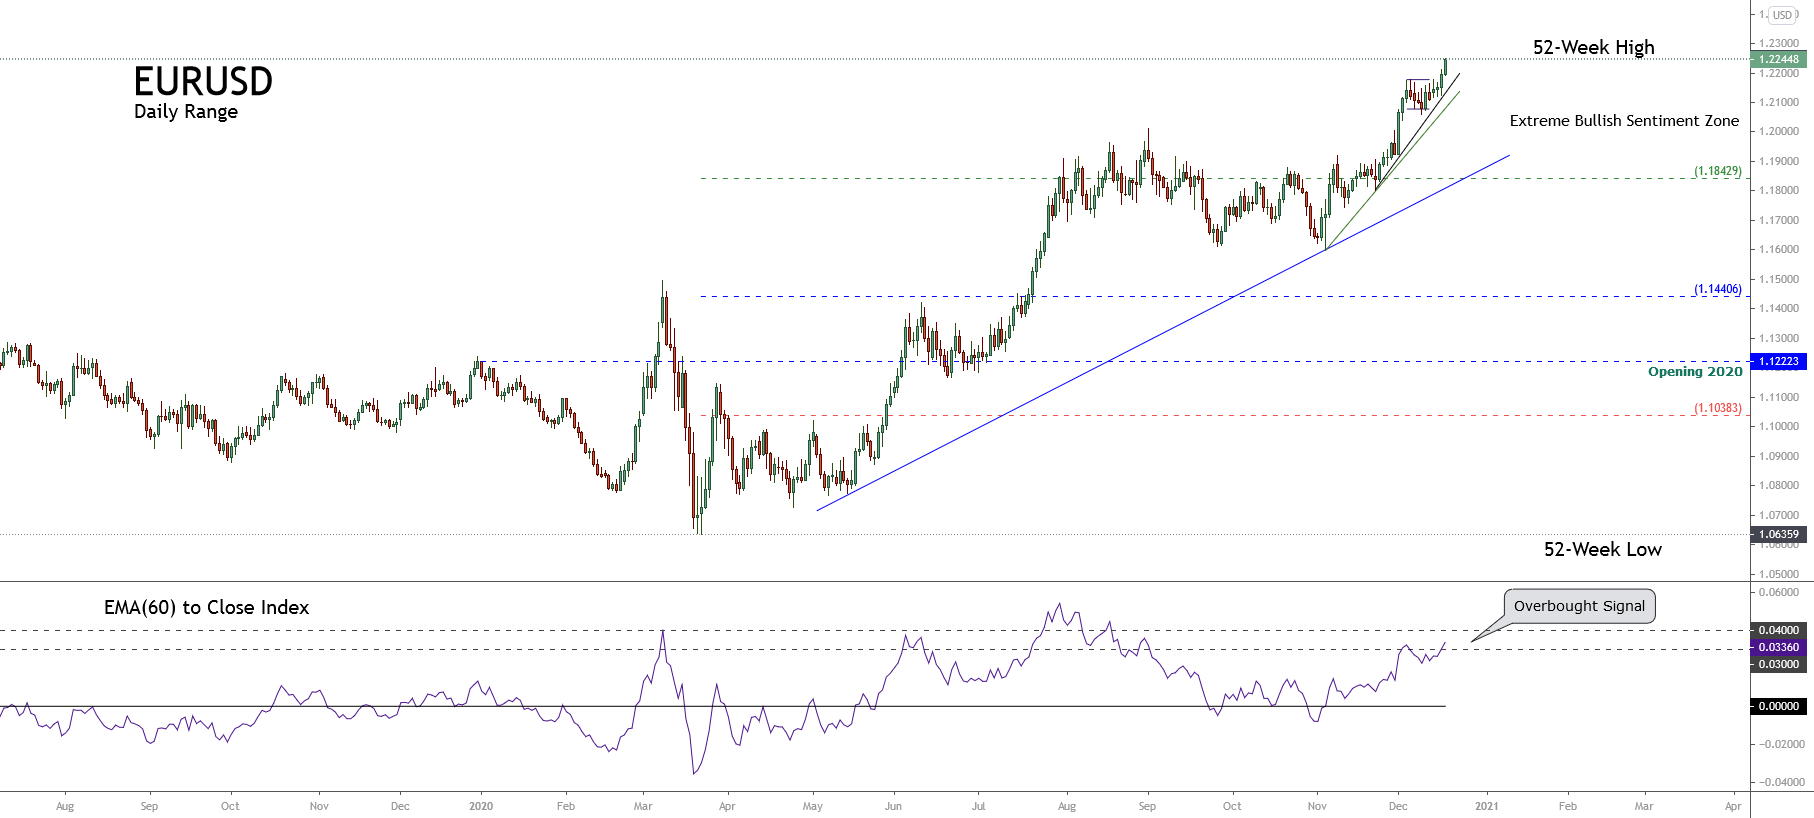
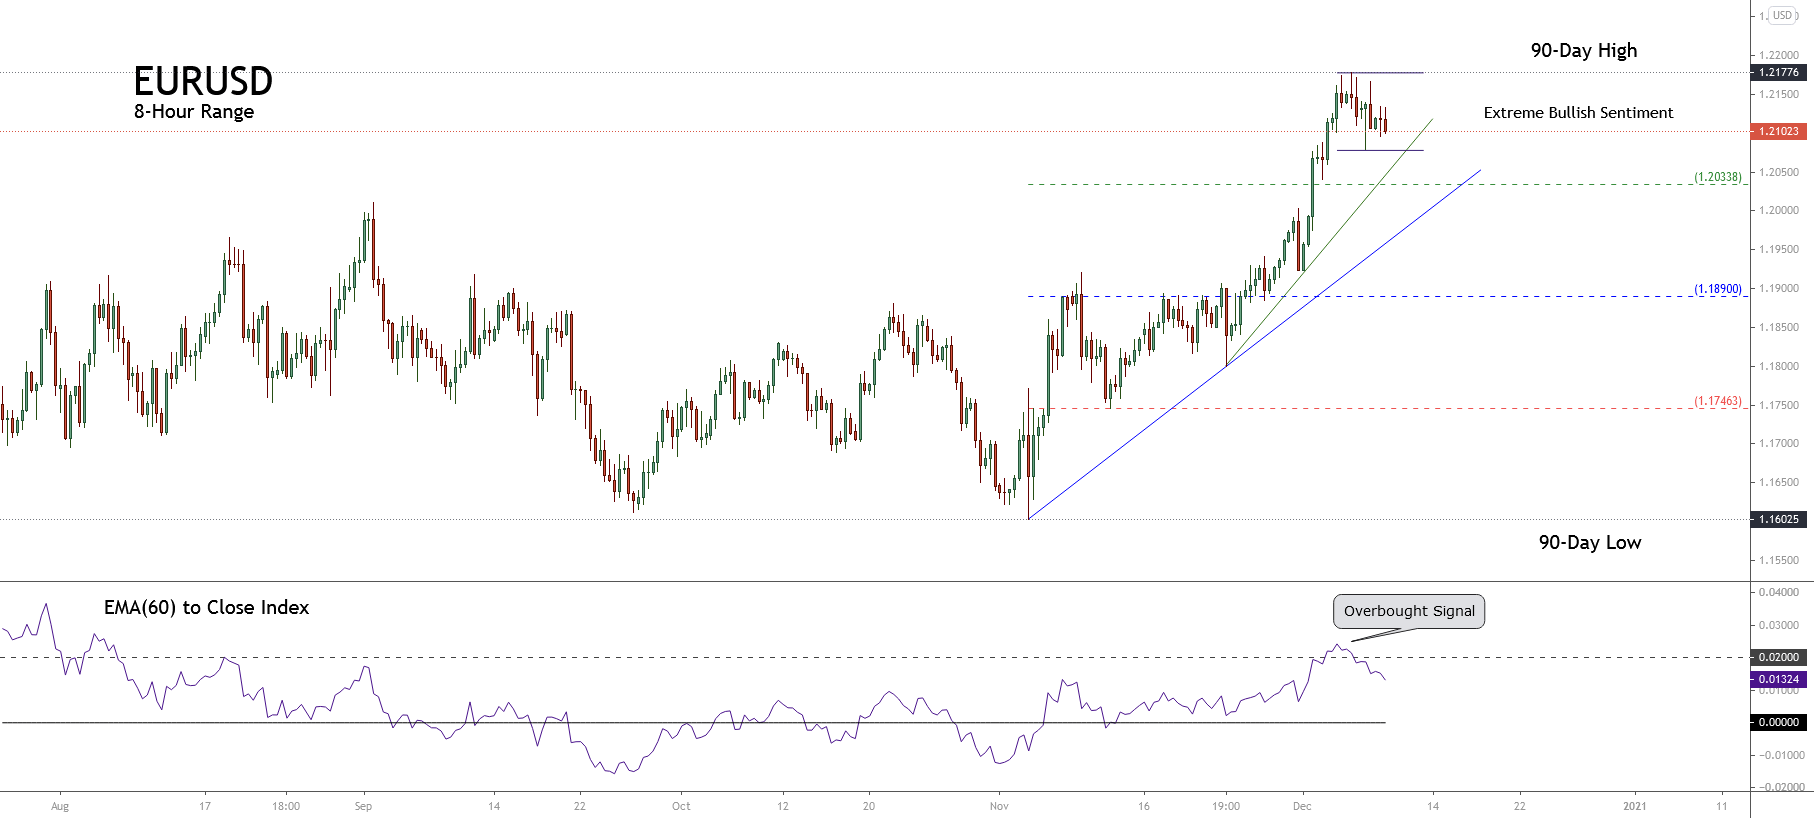
The big picture of EURUSD illustrated in its daily chart reveals the violation of the secondary trendline plotted in green, corresponding to the last rally developed by the common currency since November 04th from the 1.16025 level, which found resistance on January 06th at 1.23495. This market context leads us to observe that the price could develop a correction proportional to the last rally.

In this regard, the Dow Theory view suggests that EURUSD’s corrective move depth might lie between 33% (1.21030) and 66% (1.18565). Moreover, the price could find support in the long-term upward trendline plotted in blue.

3. Timing and Momentum Oscillator Supports the Elliott Wave View.

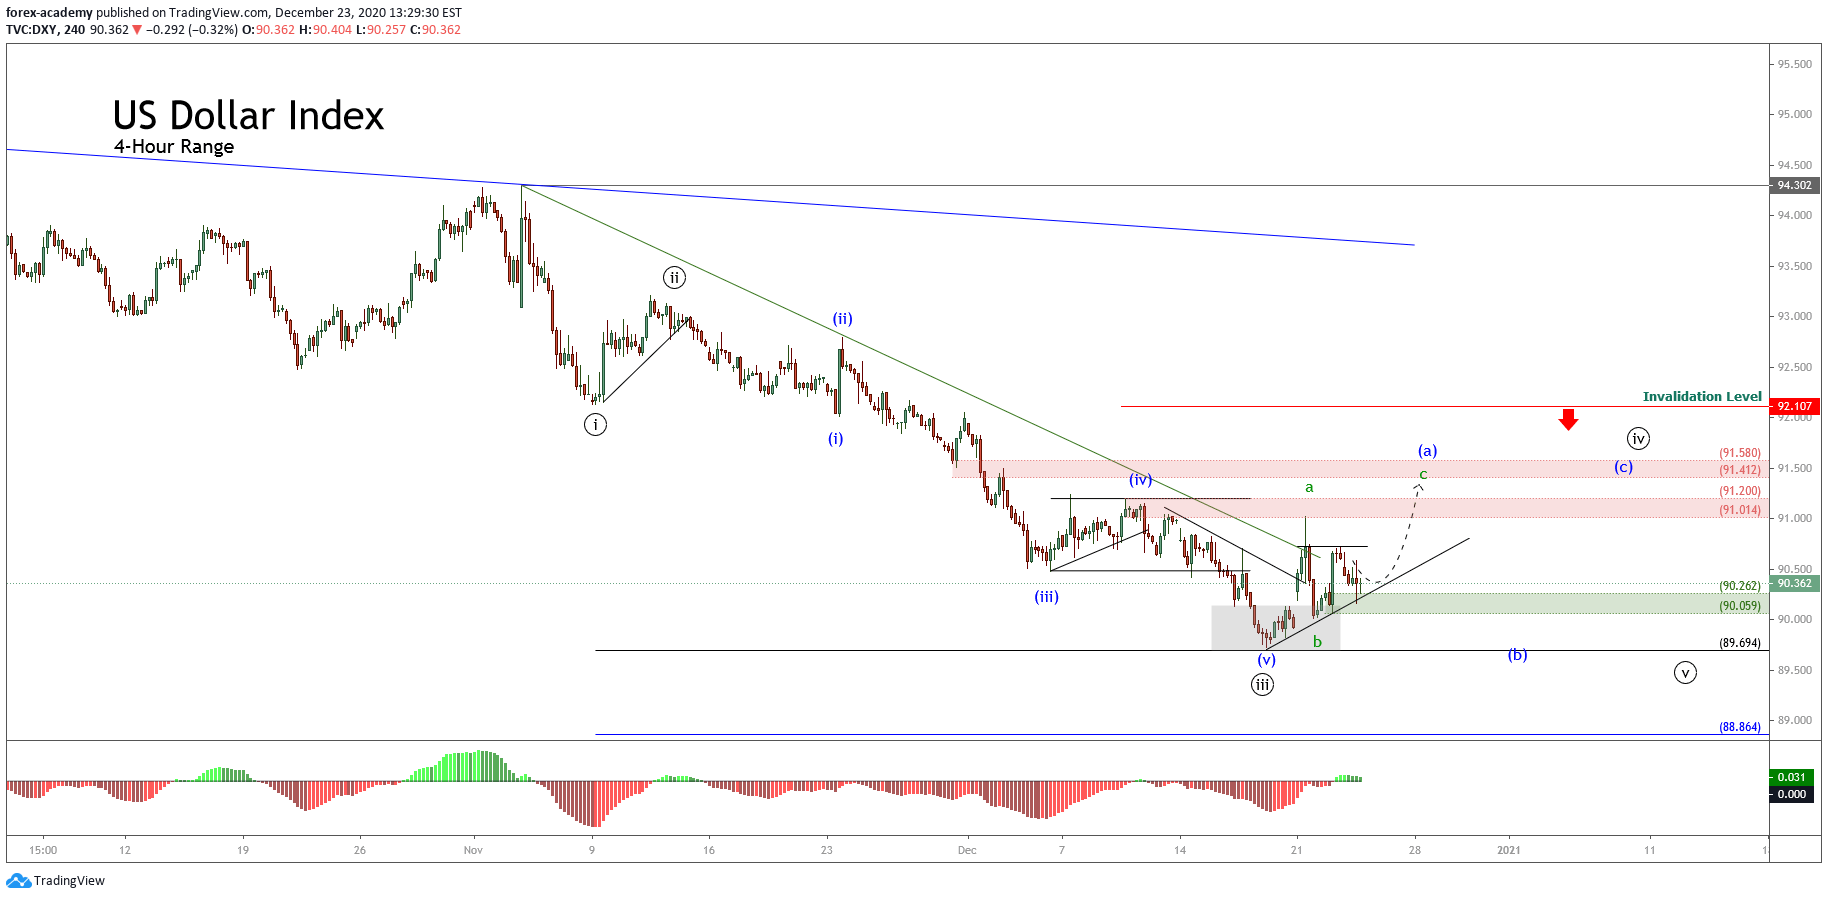
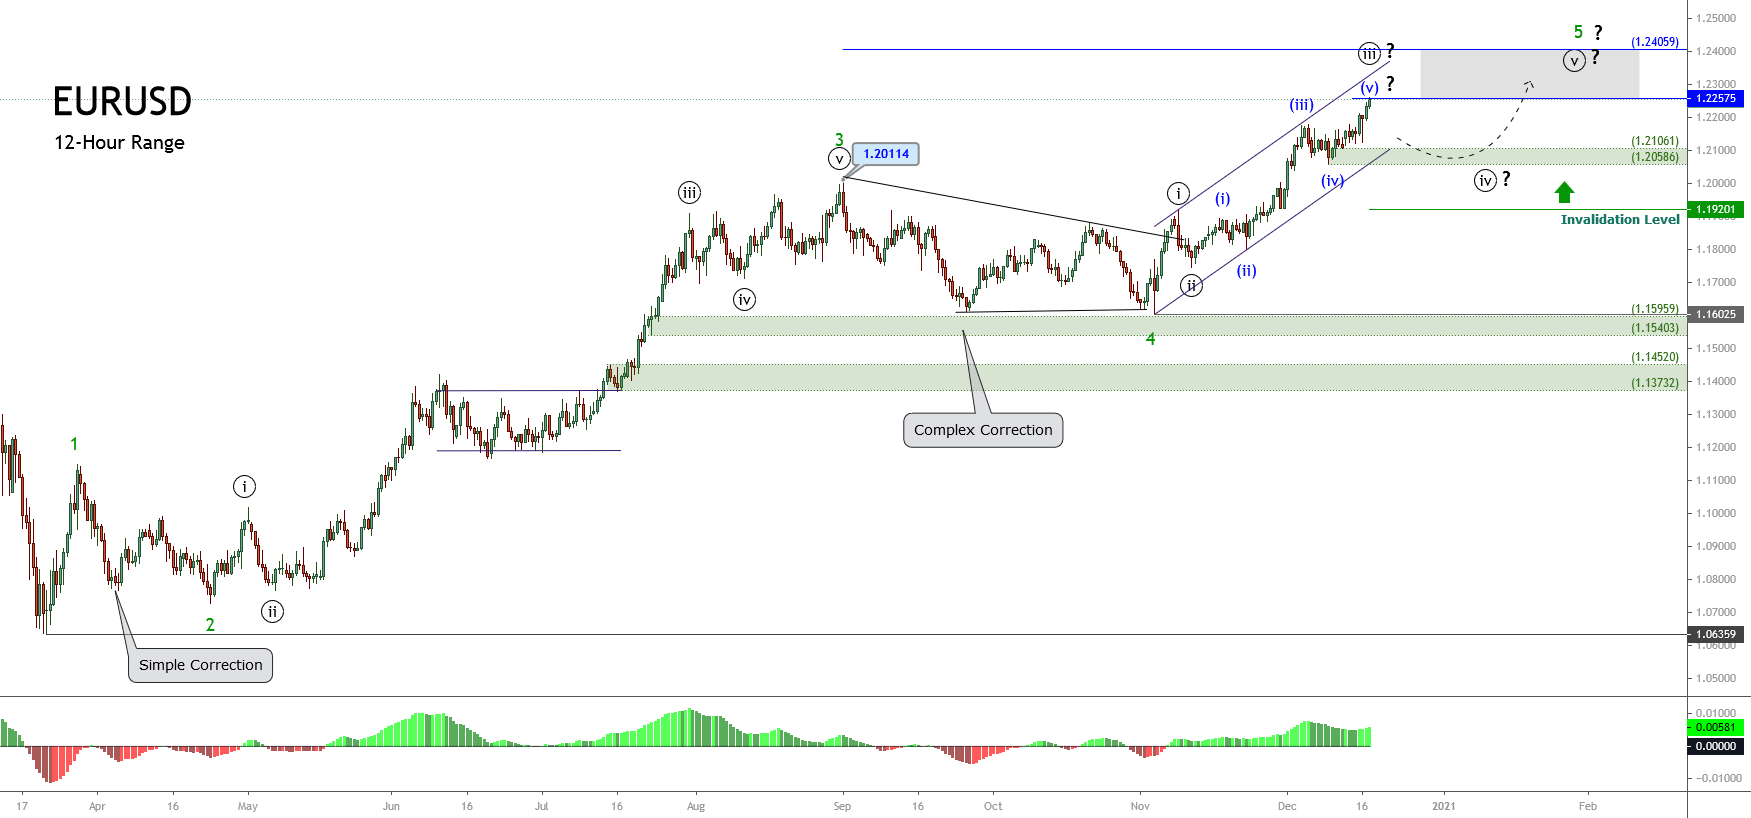
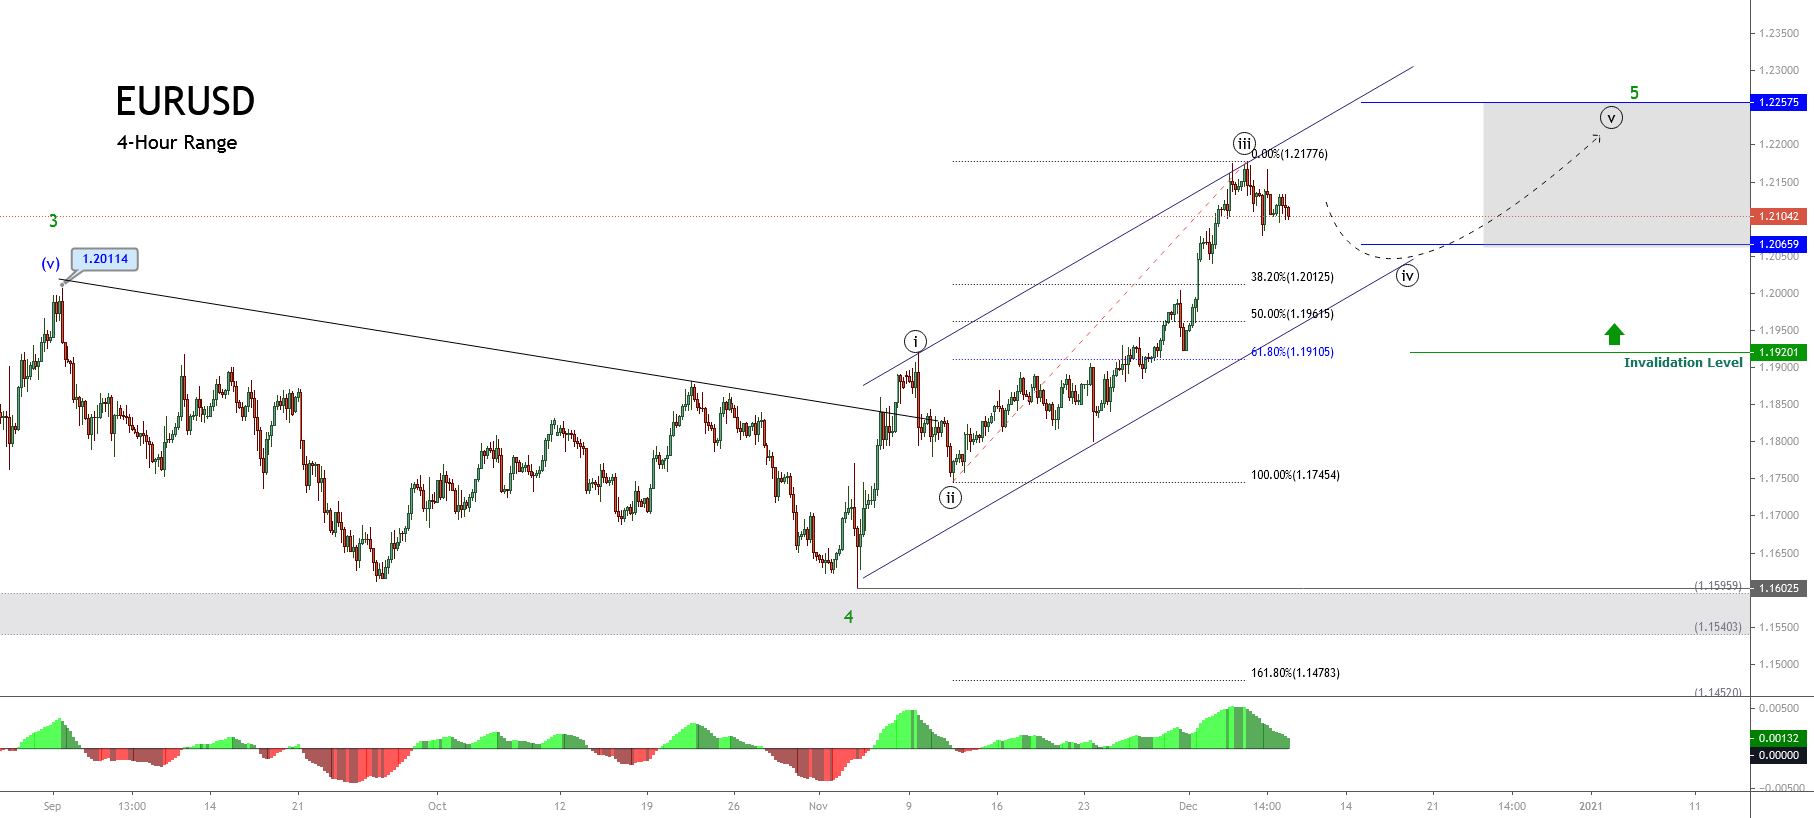
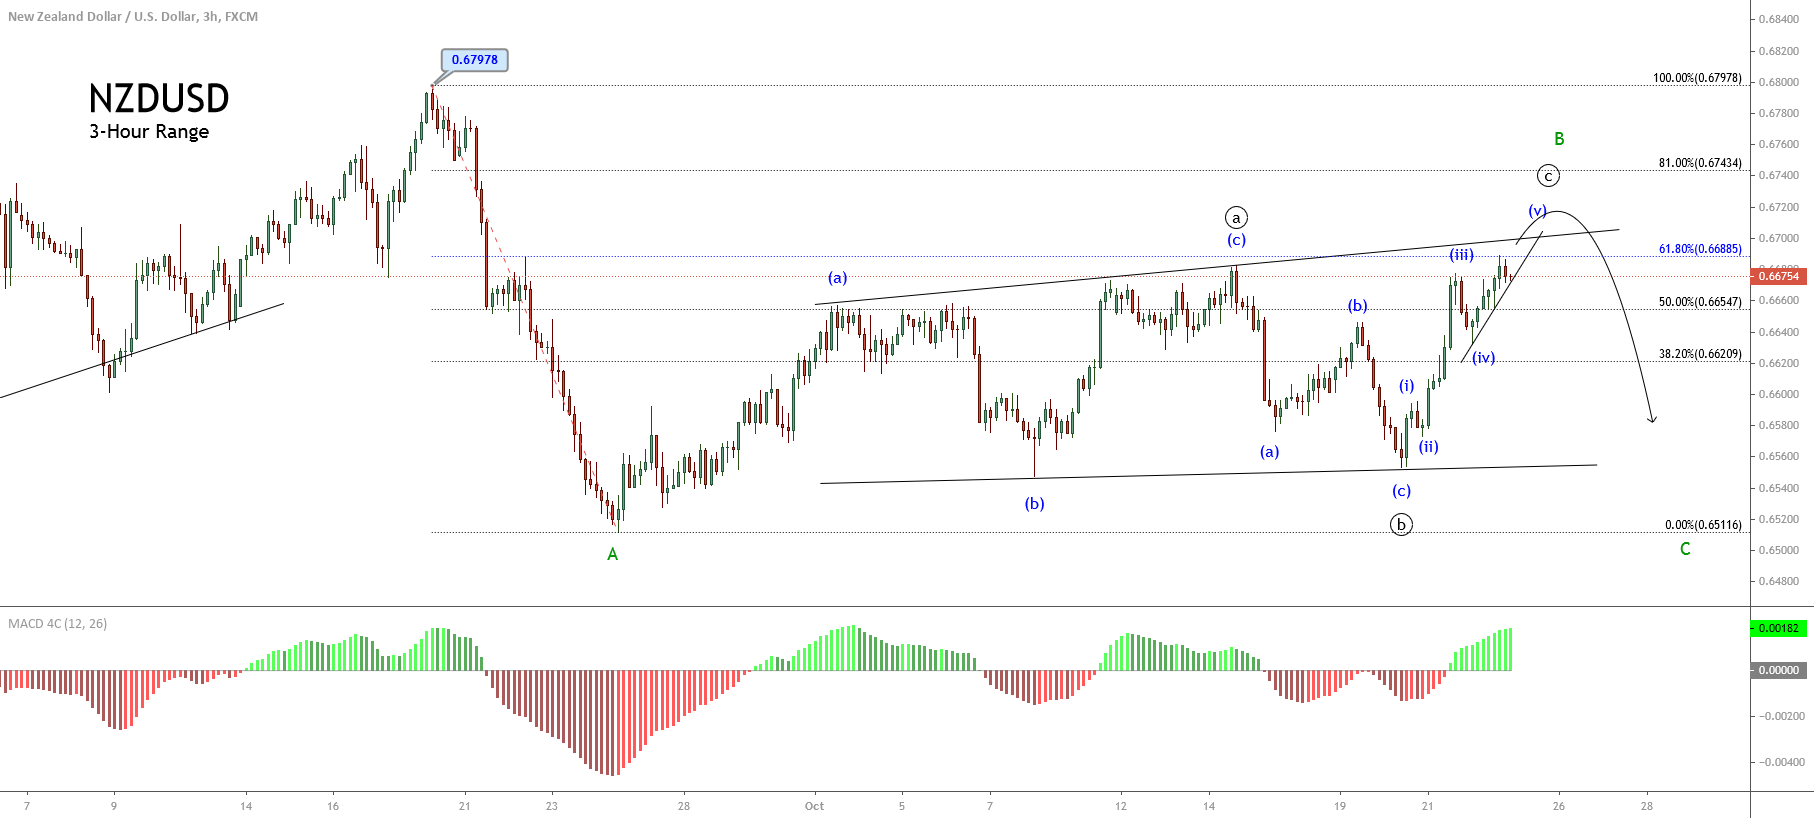
The intraday Elliott wave view for the EURUSD pair exposed in the next 4-hour chart shows the completion of an ending diagonal pattern corresponding to wave (v) of Minuette degree labeled in blue and its bearish reaction after its finalization.

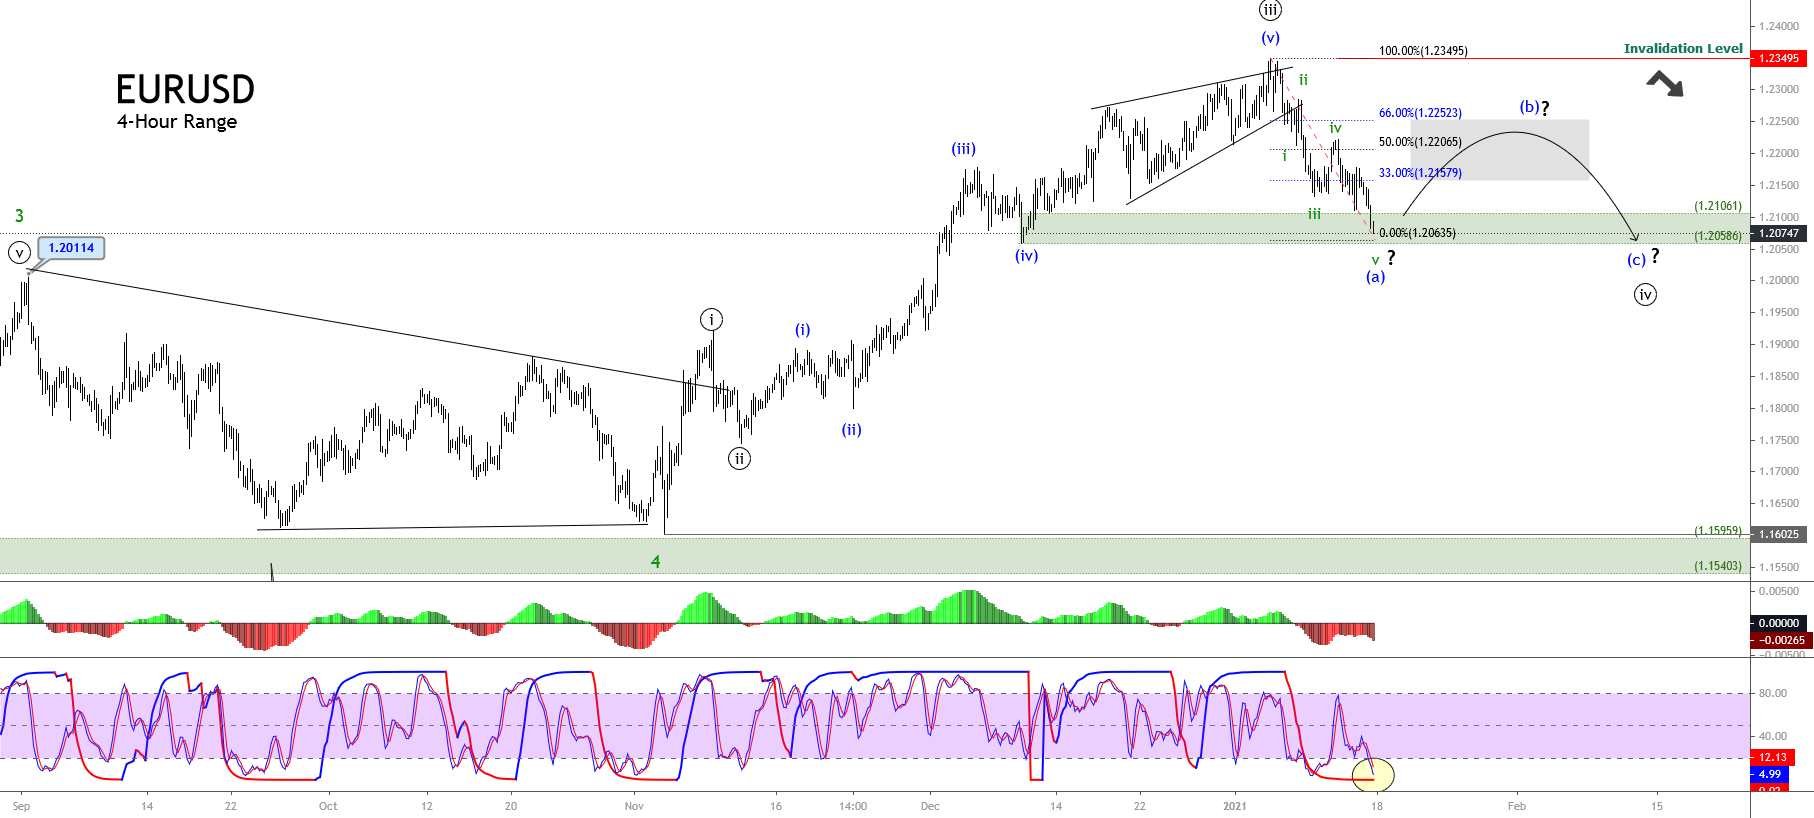
Once the common currency topped at 1.23495, the price developed an intraday corrective move subdivided into five internal segments of Subminuette degree identified in green. This five-wave sequence of lesser degree carries us to expect the progress in a potential zigzag pattern (5-3-5). 

On the other hand, the timing and momentum oscillator lead us to observe the first downward sequence’s exhaustion corresponding to wave (a) in blue. In consequence, the common currency should develop a corrective rally corresponding to wave (b). This upward move could hit the zone between 1.21576 and 1.22523.

Once the EURUSD completes its wave (b) in blue, the price action should start its bearish wave (c), which follows an internal structure subdivided into five waves. In this context, the bearish scenario’s invalidation level can be found at the end of wave (v) at 1.23495.

What’s Next?

According to Myfxbook.com’s Community Outlook, 56% of retail EURUSD traders are positioned to the long side. Likewise, the violation of a short-term upward trendline carries to expect further declines in the common currency for the coming trading sessions. Nevertheless, the EURUSD could be at the end of the first segment of a corrective formation. In this context, the price could develop an upward bounce that could reach the zone between 1.21579 and 1.22523. After the bounce conclusion, the common currency could find fresh sellers expecting to join a new downward sequence corresponding to wave (c).

If you are interested in finding trading opportunities using the Elliott Wave Principle, follow our Forex.Academy Educational Section.

Categories
Forex Elliott Wave Forex Market Analysis

Why GBPJPY Plummeted in Friday’s Session?

The GBPJPY cross declined on Friday trading session dragged 0.70% after the price surpassed the psychological barrier of 142, being the highest level reached since early September 2020.

Technical Overview

The GBPJPY cross drops over 100 pips on the last trading session of the week, accumulating a modest advance of 0.02% (YTD) since the yearly opening.

On the fundamental side, the industrial production in the United Kingdom eased 4.7% (YoY) in November 2020, informed the Office for National Statistics on Friday. The reading is worse than the decline of 4.2% expected by analysts. Likewise, both coronavirus lockdown and the Brexit uncertainty contributed to the decline in the industrial output.

Source: TradingEconomics.com

On the other hand, the doubts in the fourth quarter 2020 earnings season kick-off and the elected U.S. President Biden’s stimulus plan seem not enough to keep fueling the stock market participants’ euphoric sentiment. This context looks fading the record highs in the stock market, boosting the risk-off bias pushing lower the GBPJPY cross.

The big-picture illustrated in the next daily chart shows the price action moving in the extreme bullish sentiment where the cross ended the Friday session unveiling a bearish engulfing pattern, which carries to expect further declines in the coming trading sessions.

Finally, the piercing below the yearly opening level at 140.779 suggests potential declines during the first quarter of 2021.

Technical Outlook

Our previous analysis saw the progress in a complex correction identified as a double-three pattern (3-3-3). Nevertheless, the corrective rally suggests that the GBPJPY moves in a triple-three formation (3-3-3-3-3), which looks in its terminal stage.

The following 4-hour chart shows the completion of a triple-three pattern of Minute degree labeled in black, which moves inside a wave B of Minor degree identified in green since the cross found support at 133.040 touched in last September 22nd.

The internal structure of wave ((z)) in black shows its last corrective leg corresponding to wave (c) in blue, developing an ending diagonal pattern, which seems finished its wave v of Subminuette degree labeled in green. The breakdown of the guideline that connects the end of waves ii with iv carries to support the ending diagonal pattern’s finalization.

On the other hand, the timing indicator exposes the intraday oversold (see the yellow circle), which leads to the conclusion that the GBPJPY cross should develop an upward retracement as a flag pattern before continuing with its potential further decline.

In summary, the GBPJPY cross plummeted in last Friday’s session dragged by the completion of an ending diagonal pattern, which belongs to wave ((z)) of a triple-three formation, where its upper degree sequence corresponds to wave B of Minor degree. Although the news media continue supporting hopes in the stimulus plan for the U.S. economy, the Elliott wave structure showed by the cross unveils a different story.

According to the Elliott wave theory, the price should develop a downward wave C of Minor degree. The timing oscillator also suggests an intraday upward consolidation likely as a flag pattern before continuing its drops.

If you are interested in expanding your knowledge about the Elliott wave theory from the basics to advanced, visit our Forex.Academy Educational Section.

Categories
Forex Elliott Wave Forex Market Analysis

EURAUD Under Bearish Pressure, What’s ahead?

The EURAUD cross is advancing in its incomplete third wave from a mid-term downward sequence that remains in play. Follow with us on what the Elliott wave theory tells about its next movement.

Technical Overview 

The big picture of the EURAUD cross unveiled in the following 12-hour chart exposes the price action moving in the extreme bearish sentiment zone during the second week of the year. However, both the acceleration and oversold could suggest the exhaustion of the bear market.

The following 12-hour chart exposes the market participants’ sentiment, unfolded by the 90-day high and low range. The figure reveals the institutional activity pushing the cross in the extreme bearish zone and consolidating under the yearly opening price at 1.58763.

On the other hand, the EMA(60) to Close Index recently pierced the -0.0300 level. This reading suggests both the oversold and the exhaustion of its accelerated downtrend identified with the black trend-line.

In this context, the accelerated downward trend-line breakout and the close above yearly opening price should warn about potential recoveries in the EURAUD cross.

Technical Outlook

The short-term Elliott wave outlook for the EURAUD cross unfolded in the 8-hour chart reveals the progress of an incomplete bearish impulsive wave of Minuette degree labeled in blue, suggesting further drops.

The previous chart illustrates the downward sequence that began on October 20th when the cross found fresh sellers at 1.68273 and started a bearish structural series of Minute degree labeled in black, which currently could be in its wave ((c)) or ((iii)). The internal structure seems developing its wave (iii) of Minuette degree identified in blue. 

The wave (iii) potential bearish target can be found between 1.56175 and 1.55359, which coincides with the descending channel’s base-line. Once the price tests the possible target area, the market participants could carry up the EURAUD cross toward the short-term descending channel’s upper line.

Regarding the wave (iv) in blue, considering the alternation principle, as wave (ii) is a simple corrective formation in price and time, wave (iv) should be complex and should last longer than wave (ii).

On the other hand, both the trend indicator and the timing plus momentum oscillator remain, supporting the bearish bias. Each rally could represent an opportunity to add positions to the bearish side.

In summary, the EURAUD cross continues in the extreme bearish sentiment zone advancing in an incomplete downward sequence, which could find support in the potential target zone between 1.56175 and 1.55539. Once the price finds support, the cross could start to bounce toward the upper line of its short-term descending channel. Finally, the bearish scenario analyzed will be invalid if the price soars above 1.60416, corresponding to the end of wave (i) in blue.

Categories
Forex Elliott Wave Forex Market Analysis

Is US Dollar Index Ready for a Rally?

The US Dollar Index reveals exhaustion signals of its bearish trend. A trend that remains in progress since the currency basket topped at 102.992 pm mid-March 2020. Follow with us what signs show the Greenback to expect a rally during the first quarter of the year.

Technical Overview

The big picture of the US Dollar Index (DXY) illustrated in the next weekly chart reveals the downtrend that remains active since the price found fresh sellers at 102.992 in mid-March 2020. The following figure also exposes the market participants’ sentiment represented by the 52-week high and low range.

The previous figure shows the extreme bearish sentiment dominating the big participants’ bias since mid-March 2020. Nevertheless, the long-tailed candlestick corresponding to the last trading week that was closed above the yearly opening, suggests the bearish trend’s exhaustion in progress.

On the other hand, the reading -4.26 observed in the EMA(52) to Close Index suggests the currency basket is oversold; thus, a potential corrective rally could occur in the coming weeks.

The mid-term Elliott wave view of the US Dollar Index exposed in the next 8-hour chart suggests completing an extended third wave of Minute degree labeled in black, when the price found support at 89.209 on January 06th.

Once the price found support, the price started to bounce, developing an incomplete wave (a) of Minuette degree identified in blue, which belongs to wave ((iv)) in black. Finally, the momentum and timing oscillator suggests that the bearish pressure persists, and the current upward movement could correspond to a corrective rally.

Technical Outlook

The mid-term outlook for the US Dollar Index unfolded in the next 8-hour chart shows the incomplete wave ((iv)) in black, which advances in wave (a) identified in blue. In this context, the current climb experienced by the Greenback could be a corrective rally.

According to Elliott Wave theory, the fourth wave in progress could retrace to 50% of wave ((iii)),  and reach 91.205. Likewise, considering that the second wave was a simple correction in terms of price and time, the current fourth wave should be complex in terms of price, time, or both. 

On the other hand, if the price extends beyond 50%, this could indicate weakness in the bearish pressure. If the price action advances above 92.107, the bearish scenario will be invalidated leading us to expect more upward movement.

In summary

The US Dollar Index completed a bearish third wave of Minute degree at 89.209 on January 06th, when it began to bounce, starting an upward corrective rally that remains in progress. The current intraday movement could reach 91.206 where the price could complete its wave (a) of Minuette degree labeled in blue. On the other hand, considering the alternation principle, the current corrective formation, the structure should be complex in terms of price, time, or both. Finally, the bearish scenario’s invalidation level locates at 92.107, corresponding to the end of wave ((i)) in black.

Categories
Forex Elliott Wave Forex Market Analysis

Is the US Dollar Index Finding A Bottom?

Technical Overview

The US Dollar Index (DXY) continues bouncing in the extreme bearish sentiment zone, testing the resistance at 90.983. The breakout of this resistance level could lead to expect further upsides in the following trading sessions.

The following figure shows the US Dollar Index in its 8-hour timeframe exposing the mid-term market participants’ sentiment unfolded by the 90-day high and low range, revealing the bearish trend’s exhaustion. In this context, the surpassing of the next resistance at 90.983 could warn about the Greenback recovery, which could boost the price until the next resistance is located at 92.236. Likewise, the exhaustion could imply the consolidation of the bearish trend.

On the other hand, the primary mid-term trend plotted in blue shows the bearish pressure that remains in progress and the current since DXY found resistance at 94.742 on September 25th. Likewise, the secondary trend identified with the accelerated green downward trendline shows a pause of the short-term downtrend started at 94.302 on November 04th. In this context, the pause in progress represented by the rising minor trend could develop a limited rally, which could carry the price to test the precious swing at 91.200 reached on December 09th.

Technical Outlook

The short-term Elliott wave view for DXY exposed in the next 4-hour chart reveals the end of the bearish wave ((iii)) of Minute degree labeled in black and the start of wave ((iv)) of the same degree, suggesting the possibility of a corrective rally, which could take until January 20212.

From the previous chart, we distinguish the start of wave ((iv)) identified in black, which began when DXY found support at 89.73 on December 17th, ending the third wave of Minute degree labeled in black. Likewise, the price action surpassed the short-term downward trendline plotted in green, suggesting the bearish sequence’s exhaustion that began at 94.302 on November 04th.

With the short-term trendline piercing, DXY developed the first segment of a corrective wave of Subminuette degree identified as wave a labeled in green, which found resistance in the supply zone between 91.014 and 91.200. Once topped at 91.018, the Greenback retraced, developing its wave b of the same degree, which found support in the intraday demand zone between 90.262 and 90.059. 

The textbook suggests that the price action should develop a third move identified as wave c in green, which could advance until the next supply zone bounded between 91.412 and 91.580. Once the US Dollar Index completes the third segment, the Greenback will complete the wave (a) of Minuette degree identified in blue corresponding to the first segment of the wave ((iv)) in black.

In summary, the US Dollar Index looks starting to develop the first segment of the fourth wave of Minute degree, suggesting the pause of the primary trend’s downtrend, which could last up until January 2021. In this regard, DXY currently found temporary support at 89.730, and the price could develop a new decline corresponding to the fifth wave of Minute degree. The potential next decline could pierce the previous low, being its potential next bearish target located at 88.864. Finally, if the price action surpasses the invalidation level placed at 92.107, the Greenback could start to show recovery signals, which could carry to expect a bullish reversal move.

Categories
Forex Elliott Wave Forex Technical Analysis

EURJPY Consolidates Expecting Further Upsides

Technical Overview

The EURJPY cross consolidates in the extreme bullish sentiment zone, suggesting a bullish continuation of the strong upward movement developed in early December.

The following daily chart exposes the EURJPY cross developing a consolidation pattern, which looks like a flag pattern bounded between 125.77 and 126.70. According to the chartist analysis, the formation suggests the continuation of the previous movement. In this case, the cross could extend its gains surpassing the next resistance corresponding to the 52-week high located at 127.075.

The mid-term overview for the EURJPY cross reveals its primary trend plotted in blue, supporting a rally that remains in progress since the price confirmed its bottom at 114.397 touched on last May 07th. The secondary trend traced in green and minor trend drawn in black supports the price acceleration, which currently consolidates carrying to expect the bullish continuation for the following trading sessions.

Technical Outlook

The big picture for the EURJPY cross under the Elliott wave perspective unfolded in the next 12-hour chart shows the incomplete corrective rally corresponding to wave ((b)) of Minute degree labeled in black. This corrective rally remains in progress since the price found fresh buyers at 121.617 on last October 29th and could reach new yearly highs.

The upper degree structure of the EURJPY cross illustrated in the previous chart exposes the progress in wave B of Minor degree labeled in green, which began when the cross completed its wave A at 127.075 on last September 01st. Currently, the price advances in its wave ((b)) in black. Likewise, its internal structural series shows the development in the wave (c) of Minuette degree labeled in blue, which at the same time, looks starting to develop the wave v of Suminuette degree identified in green.

In this context, the EURJPY cross could extend its gains toward the potential target zone bounded between 126.96 until 128.08, where the cross could find fresh sellers expecting to drag the price to new lows developing the wave ((c)) in black. 

In this regard, if the price confirms its new bearish leg, the cross could complete the third segment of wave B in green. On the other hand, considering both the alternation principle and the wave ((a)) and ((b)) looks extended in terms of time, the wave ((c)) could be a sharp decline.

In conclusion, the EURJPY cross moves mostly upward in a corrective rally that belongs to wave ((b)), corresponding to the second segment of the upper degree wave B. If the price breaks the sideways consolidation structure developed since early December, the cross could strike the potential target zone between 126.96 and 128.08. Likewise, the invalidation level of the bullish scenario locates at 125.130.

Categories
Forex Elliott Wave Forex Market Analysis

Will 1.24 be the Next EURUSD Yearly High?

The EURUSD pair continues extending its gains after surpass its psychological resistance of $1.22 for the first time since late April 2018. The common currency gained over 9.20% (YTD), encouraged by the US Dollar weakness.

Technical Overview

The following daily chart illustrates the long-term market participants’ sentiment unfolded within the 52-week high and low range. The figure shows the progression starting from 1.06359, which corresponds to the lowest level of the year. 

The long-term primary trend identified with the trend-line in blue reveals that bull traders remain the market control since last March 23rd when the price found and confirmed the bottom at 1.06359 after the massive sell-off occurred last mid-February. Moreover, both the secondary trend (green trend-line) and the minor trend (black trend-line) show the bullish acceleration that carries the cross from November 04th when the EURUSD found fresh buyers expecting further upsides. 

On the other hand, although the trend looks mostly bullish, the EMA(60) to close index is moving in its overbought zone; thus, we should be prepared fr the upward movement in progress to end soon. Under this context, the main bias for bulls should change from buy to hold. Also, Bearish traders should expect confirmation signals such as a significative breakdown before placing their short positions.

Technical Overview

The mid-term Elliott wave view of the EURUSD pair exposed in the next 12-hour timeframe chart reveals the price action is reaching its second target level of $1.22575 proposed in our previous analysis. Also, the chart illustrates its progress in an incomplete wave 5 of Minor degree labeled in green.

The lesser degree structure observed in the fifth wave in green shows the progression of the wave ((iii)) of Minute degree labeled in black, which simultaneously appears advancing in its internal fifth wave of Minuette degree identified in blue. The Elliott Wave textbook suggests that, currently, the common currency moves in an extended wave. In this context, once the pair completes its rally, it should start to consolidate in its wave ((iv)) in black. This corrective formation could find support in the demand zone between 1.21061 and 1.20586, which could bring the possibility to join the long-term bullish trend. The potential target for wave 5 in green is $1.2405.

In summary, the EURUSD pair moves in its third wave of Minute degree, which should complete its rally in the coming trading sessions. The next path corresponding to wave ((iv)) in black could drag the price until the demand zone between 1.21061 and 1.20586, where the common currency could start a new rally with a potential target at 1.2405. Finally, the invalidation level of the bullish scenario is $1.19201.

Categories
Forex Technical Analysis

US Dollar Index awaiting FOMC Meeting in the Extreme Bearish Zone

The US Dollar Index (DXY) reached a new yearly low of 90.128, expecting the last FOMC interest rate decision meeting of the year. The analysts’ consensus anticipates the rate unchanged at 0.25% by the FED.

Source: TradingEconomics.com

Technical Overview

The short-term overview for the Greenback illustrated in the following 8-hour chart displays the short-term market participants’ sentiment unfolded by the 90-day high and low range, which shows the price action moving in the extreme bearish sentiment zone. Likewise, the bullish divergence observed on the EMA(60) to Close Index carries to expect a recovery for the following trading sessions.

On the other hand, the short-term primary trend outlined with its trend-line drawn in blue reveals that the bearish bias remains intact since September 25th, when the price topped at 94.742. The secondary trend plotted with the trend-line in green shows the acceleration of the downward movement that began on November 04th at 94.302.

Nevertheless, the breakdown of the last sideways range developed by DXY during the latest trading session, combined with the bullish divergence observed between the price and the EMA to Close indicator, makes us suspect a bounce, which could hit the resistance of the extreme bearish sentiment zone at 91.282.

Short-term Technical Outlook

The short-term Elliott wave view for the US Dollar Index unfolded by the next 4-hour chart exposes the bearish progression of wave ((iii)) of Minute degree labeled in black that belongs to the downward sequence that began on November 04th at 94.302. 


According to the textbook, the price action requires to confirm the third wave’s completion before acknowledging the start of the wave ((iv)) in black. In this regard, the internal structure of the wave ((iii)) added to the bullish divergence observed in the MACD oscillator; thus, suggesting the advance in wave (v) of Minuette degree identified in blue.

On the other hand, considering both the alternation principle and that the second wave of the same degree looks simple in terms of price and time, the next corrective structure should be complex in terms of price, time, or both.

In this context, the next DXY path could produce a bounce corresponding to the fourth wave of Minute degree, advancing to the supply zone between 91.014 and 91.200, and even strike the 91.580 level.

In summary, the US Dollar Index looks advancing in the fifth wave of Minuette degree that belongs to the third wave of Minute degree. In this context, the price action could experience a bounce corresponding to the fourth wave of Minute degree, which could move up to 91.850. Nevertheless, if the price surpasses the invalidation level located at 92.107, the Greenback could be showing the start of a reversal of the current bearish trend.

Categories
Forex Elliott Wave Forex Market Analysis

EURAUD Advances Supported by the RBA Minutes

Technical Overview

The EURAUD cross advanced on the overnight trading session, expecting the minutes from the last Reserve Australia Bank (RBA) interest rate decision meeting, where policymakers decided to keep unchanged the rate at 0.1% for the second month in a row.

Source: TradingEconomics.com

On the technical side, the following 12-hour chart shows the short-term market sentiment unfolded by the 90-day high and low range, which illustrates the cross consolidating in the extreme bearish sentiment zone

The bullish candlestick formation developed during the recent trading sessions carries to suspect the possibility of a short-term bounce. This bounce could find strike the level 1.62374 that corresponds to the resistance of the extreme bearish zone.

On the other hand, the short-term primary trend plotted in blue shows the bearish bias that remains in progress. The secondary trend also shows the intraday downward acceleration, which dragged the price until 1.60408, where the cross found support. Likewise, the bounce observed on the EMA(60) to Close Index carries to support the possibility of a limited recovery.

Technical Outlook

The short-term Elliott wave view for the EURAUD cross shows the downward progress of the incomplete five-wave sequence of Minute degree labeled in black, suggesting a limited recovery in the following trading sessions.

The next 4-hour chart shows the bearish movement subdivided into a five-wave sequence of Minute degree identified in black. It began on October 20th at 1.68273 and found its temporary bottom at 1.60408 on December 11th.

The previous figure illustrates the price looks advancing in its fifth wave in black, which after the bottom reached on the last Friday 11 session completed its wave (iii) of Minuette degree labeled in blue. In this context, according to the Elliott wave theory, the price action should start to develop a corrective formation, which could find resistance in the supply zone between 1.61786 and 1.62271.

On the other hand, considering that the wave ((iii)) in black looks like the extended wave, the fifth wave could have a limited extension. In this context, the lesser degree structure of the wave ((v)) could pierce slightly below the end of wave (iii) in blue.

In conclusion, the EURAUD cross shows the possibility of a limited recovery, which could strike the supply zone between 1.61786 and 1.62271, where the price could start to consolidate in a sideways range with support at the end of wave (iii) at 1.60408. On the other hand, if the cross surpasses the supply zone, it would indicate further recoveries, and the price could start a bullish rally. Finally, the invalidation level of the current bearish scenario locates at 1.62872.

Categories
Forex Elliott Wave Forex Market Analysis

EURNZD Consolidates after Bouncing from its Recent Lows

The EURNZD cross is seen consolidating near the extreme bearish sentiment zone backed by the strength of the New Zealand dollar. This consolidation suggests a pause of the downward sequence that began on August 20th and ended heavily oversold after its latest decline that drove it to 1.69472.

Technical Overview

The following 12-hour chart illustrates the short-term markets participants’ sentiment bounded by the 90 high and low range, which shows the price consolidating in the extreme bearish sentiment zone after the cross found support on 1.69472 on November 24th.

Furthermore, the previous chart shows the primary trend outlined a blue trend-line that tells the bias remains mostly bearish. Likewise, the secondary trend represented with the green trend-line exposes the downward acceleration, and, shows also its consolidation range between the levels of 1.69472 and 1.72664.

Finally, as long as the EURNZD cross keeps moving below level 1.72664, the bias will remain bearish, so we could expect further drops, likely below 1.69472. Whereas, the breakout of the extreme bearish zone of 1.72664 to the upside could indicate the start of a recovery.

Short-term Technical Outlook

The short-term outlook for the EURNZD cross under the Elliott Wave perspective is shown in the next 2-hour chart and seen moving in an incomplete downward sequence. The current leg in which is moving corresponds to the wave ((c)) of Minute degree labeled in black.  Within that wave ((c)), the price is advancing in its fourth wave of Minuette degree identified in blue.


We see all that the wave ((c)) of Minute degree labeled in black came after the completion of the wave ((b)), which ends on 1.80212 where the cross found fresh sellers dragging it in an accelerated bearish movement. In this context, the current wave ((c)) should develop an internal structure of five waves.

Right now, the chart shows the action is happening in its fourth wave, in blue, which could be advancing in its internal wave b of Subminuette degree identified in green. This leg could possibly test November’s lows. Likewise, considering that the third wave, in blue, looks like an extended wave, the fourth wave should be complex in price, time, or both. Therefore, the current corrective wave could continue evlving likely until early 2021.

Concerning the fifth wave, in blue, and considering that the third one of the same degree was the extended movement, there are two potential scenarios for the cross:

  • First scenario: the cross fails in its downward sequence finding fresh buyers above the end of the third wave, in blue, at 1.69472.
  • Second scenario: the cross penetrates below 1.69472, creating a new lower low. In this case, this new leg down could continue until the psychological barrier of 1.68.

In summary, the EURNZD cross currently moves in a corrective formation in the extreme bearish sentiment zone. In this context, our principal bias remains neutral until the completion of the fourth wave in blue. Once the cross ends the current consolidation, we could seek short positions following the direction of the fifth wave. Finally, the invalidation level of the bearish scenario locates at 1.73606.

Categories
Forex Elliott Wave Forex Market Analysis

EURUSD: is 1.22 at Hand?

The EURUSD pair advances in the extreme bullish sentiment range, consolidating the short-term rally that started on November 04th when the price found fresh buyers at 1.15615.

Technical Overview

The following 8-hour chart shows the short-term participants’ sentiment keeps pushing higher the price action. In this view, the common currency looks to consolidate the pair’s impulsive movement that began in early November.

In this chart, we can see that the current primary trend is clearly bullish. Simultaneously, the accelerated trendline identified with the green line shows the short-term bull market remains intact.

On the other hand, both the intraday sideways channel and the retracement observed in the EMA(60) to Close Index lead to a consolidation of the rally experienced by the common currency during the previous trading sessions.

Therefore, if the price action penetrates below 1.20338, the likelihood of a reversal movement in the EURUSD increases.

Short-term Technical Outlook

The short-term Elliott Wave view for the EURUSD pair unfolded in the next 4-hour chart reveals the advance in an incomplete bullish impulsive wave of Minor degree identified in green.

The EURUSD 4-hour chart illustrates the impulsive rally that began on November 04th when the price found fresh buyers at 1.16025. The price action currently looks to have completed its third wave of Minute degree labeled in black, confirmed by the broadest distance shown on the MACD oscillator

On the other hand, the consolidation structure in progress reveals the potential sideways advance of its fourth wave. Considering the Elliott Wave Principle, the fourth wave shouldn’t penetrate below the invalidation level located at 1.19201, which corresponds to the end of wave ((i)) in black.

Also, considering both the second wave, which looks like a simple corrective pattern, and the alternation principle on corrective waves, the fourth wave should be a complex correction. In this context, the fourth wave could be a triangle or a combination of simple waves grouped in a double-three or a triple-three formation.

Finally, the extension in terms of time should indicate the exhaustion of the bullish pressure; thus, the common currency could soon end its bullish cycle.

Categories
Forex Elliott Wave Forex Market Analysis

GBPAUD Consolidates in an Incomplete Correction

The GBPAUD cross continues consolidating in what is a corrective formation that continues in development since October 22nd when the price found fresh sellers on 1.85272. In this context, the current consolidation pattern suggests a coming rally in the following trading weeks.

Technical Overview

The next 12-hour chart illustrates the short-term market participants’ sentiment displaying the 90-day high and low range, which bounced in the bearish sentiment zone finding resistance in the neutral level of 1.80104, where the cross is still moving in the current trading session. However, as long as the GBPAUD cross doesn’t surpass and closes above the level of 1.80104, the bias will stay mostly bearish.

The primary trend identified in blue shows that the current uptrend remains in its formation process. In this context, the corrective movement in progress represents a secondary trend from the last upward move that carried the cross from 1.74935 to 1.85272.

Short-term Technical Outlook

The short-term Elliott wave view for the GBPAUD cross shown in the following 4-hour chart reveals the downward advance in an incomplete double-three pattern of Minute degree labeled in black, which suggests further declines for the following trading sessions.

The previous chart shows the GBPAUD developing a double three pattern. According to the textbook, this complex corrective formation follows an internal sequence subdivided into 3-3-3, where each three corresponds to a basic corrective structure.

Currently, the cross looks advancing in its wave (c) of Minuette degree labeled in blue, which belongs to the wave ((y)) of Minute degree identified in black. The movement developed until now fits two potential scenarios:

  • The first scenario considers the pause in the wave (c), which could see further declines to the demand zone between 1.7774 and 1.7716. The cross could even extend its drops until 1.7610 and 1.7554, where the price could find fresh buyers expecting a boost in its price to new highs.
  • The second occurs if the price ends its wave (c) in blue and rally toward fresh highs. In this context, the cross should confirm the breakout of the supply zone resistance at 1.8041. Also, the cross must break up the ((x))-(b) trend-line.

Finally, the invalidation level for this bearish sequence in progress can be found at the end of wave (b) in blue at 1.82144.

Categories
Forex Elliott Wave Forex Technical Analysis

US Dollar Index Under Bearish Pressure. What’s next?

The US Dollar Index (DXY) consolidates on Monday’s session in the extreme bearish sentiment zone bouncing a modest 0.06% from the last Friday 04th, from 90.476 to 90.757. However, the technical perspective is mostly bearish for the DXY basket of currencies.

Technical Overview

The following 8-hour chart shows the mid-term market participants’ sentiment unfolded in its 90-day high and low range. The figure reveals the bearish pressure that carries the Greenback in the extreme bearish zone between 90.476 and 91.543. Likewise, the intraday sideways candlestick formation suggests the likelihood of a pause and the downward continuation for the following trading sessions.

Regarding the US Dollar’s trend, the primary trend plotted in the blue line reveals the bearish bias. The secondary trend identified in green suggested the downward acceleration since November 04th when the price failed its bullish advance at 94.316. Likewise, the broader distance between the primary trend-line and the price leads to a limited correction before continuing the bearish path.

Short-term Technical Outlook

The short-term Elliott Wave perspective for the US Dollar Index exposed in the next 2-hour chart suggests the incomplete downward advance of a five-wave sequence, which could be starting to consolidate in its fourth wave of Minuette degree identified in blue.

The current bearish sequence began on November 04th when the price found fresh sellers at 90.302 and began a decline that is still present to date. The previous chart suggests the completion of the third wave of Minuette degree. This Elliott wave context is supported by the broadest distance observed in the MACD oscillator.

On the other hand, considering that the second corrective wave seems simple in terms of price and time, the alternation principle suggests that the fourth wave in progress should be complex in terms of price, time, or both. In this context, the next corrective pattern could be a triangle pattern or a combination such as a double-three or a triple-three formation.

The implication of the fourth wave’s extension could be indicative of the exhaustion of the bearish trend, and the price action should reverse soon.

Finally, if the price action rises and closes above the supply zone between 91.412 and 91.580, the US Dollar Index could reveal a possible reversion of the current bearish trend.

Categories
Forex Market Analysis

NZDCAD Heavy Drops driven by a Sharp Shift in Market Sentiment

In the last trading week, the NZDCAD cross  90-Day market sentiment declined from the extreme bullish to the bullish sentiment zone. The move was helped by the Canadian unemployment rate figures, which declined to 8.5% in November, beating the analysts’ expectations of 8.9%. 

Source: TradingEconomics.com

The last unemployment rate reading represents an improvement in the Canadian labor market, which showed a slight decline to 8.9% in October. On the other hand, during the current year, the data gathered from Statistics Canada stated that the record unemployment high was Mays figure of 13.7%, its highest level in more than four decades.

Technical Overview

The following 8-hour chart illustrates the market participants’ sentiment unfolded in the 90-day high and low range, revealing an aggressive decline in the Friday 04th trading session where the cross dropped over 1.7%. 

In this context, the downgrade on the market sentiment leads us to expect a corrective movement. This potential drop could find support in the neutral zone of 0.88698. Likewise, the descending of the NZDCAD EMA(60) to Close index below the zero-line drives us to anticipate a consolidation during the coming trading sessions before continuing a further decline.

Technical Outlook

The NZDCAD cross in its 8-hourly chart illustrates the mid-term uptrend that began on March 18th once the price confirmed its bottom of 0.80849. The primary trend plotted in blue reveals that the bull market remains intact.

Likewise, the breakdown observed in the last ascending secondary trend identified in green reveals a short-term correction with three potential key support levels: 0.89469, 0.88583, and 0.87489. Each of these levels shows a zone where the price action developed a polarization movement.

The following 2-hour chart shows an impulsive movement, which began on October 20th when the price found support at 0.86270. After completing its third wave of Minuette degree, in blue, the NZDCAD cross found resistance on December 03rd at 0.91630, where it started a decline in an incomplete corrective sequence that could correspond to wave (iv), in blue.

In this context, the cross could develop two potential scenarios:

  • The first scenario occurs if the price completes the third wave on 0.91630. In this case, the cross could advance mostly sideways in its wave (iv), in blue. In this scenario, the cross could find support in the demand zone between 0.89723 and 0.89490, where the price could begin to advance in its wave (v) of Minuette degree at least to the 0.9163 level.
  • The second scenario: considers an alternative count and occurs if the NZDCAD cross completes a wave (v), in blue, on 0.91630. If that is the case, it implies the price is currently advancing in a corrective formation of Minuette degree. Thus, the price could create a decline in a three-wave sequence toward the next demand zone between 0.88437 until 0.88234. 

In both scenarios, the invalidation level is found below the origin of wave (i) at 0.86270.

Categories
Forex Market Analysis Forex Technical Analysis

NZDJPY Fills the Gap Unfilled Since May 2019

The NZDJPY advanced 5.70% in November, consolidating the price in the extreme bullish sentiment zone. Likewise, as illustrated in the following daily chart, during December’s kickoff trading, the cross reached the yearly high of 73.831, filling the gap that opened on May 06th, 2019.

Technical Overview

The previous chart also exposes the cross advancing in a mid-term uptrend drawn in blue, which remains active since last March 18th, when the price found support at 59.490. Likewise, we distinguish an accelerated short-term bullish trend plotted in green, which began in early November. 

The 2.774 reading observed in the EMA(60) to Close Index leads us to suspect that the impulsive bull market developed in the NZDJPY cross seems to be in an exhaustion stage. Therefore, the cross is likely to develop a reversal movement in the following trading sessions.  

Nevertheless, before taking a position on the bearish side, the price action must confirm the reversal movement. 

Technical Outlook

The following 12-hour chart presents the mid-term Elliott Wave view or the NZDJPY cross. The drawings reveal the cross advancing in an incomplete fifth wave of Minuette degree, labeled in blue that belongs to the fifth wave of Minute degree, in black.

NZDJPY’s price movements reveal an impulsive five-wave sequence of Minute degree identified in black, which began last March 18th, when the cross found fresh sellers after the massive sell-off developed in the global stock market. 

Likewise, once the extended third wave (in black) ended, the cross developed a sideways movement as a flat pattern, which found fresh buyers at 68.633. In this context, considering the Elliott Wave theory and that wave ((iii)) was the extended wave, the next impulsive wave ((v)) (in black) can’t be extended and should look similar to wave ((i)), also in black. 

On the other hand, watching the fifth wave’s internal structure (in black), the wave (ii) (in blue) looks like a complex correction, and the third wave is the extended movement. In this context, the current wave (v) (in blue), which is still in development, shouldn’t be an extended rally.

Consequently, the cross could complete its fifth wave of Minute degree in the area defined by the psychological levels between 74.00 and 75.00. Finally, until the cross shows evidence of a reversal, such as a bearish engulfing candle, we should consider the cross’ trend as bullish.

Categories
Forex Market Analysis

Watchout the Potential Next Rally of GBPAUD

GBPAUD advances on Monday’s trading session in the bullish sentiment zone, testing the resistance level at 1.82688, which corresponds to the extreme bullish zone’s resistance.

Technical Overview

The following 12-hour chart illustrates the price that reached a new peak in the 90-day range at 1.85272. The cross began to retrace towards the neutral zone at level 1.80104, where the price found support and began to move mainly sideways on the bullish sentiment zone, finding resistance at level 1.82688.

Likewise, it highlights the support’s confirmation in the neutral level of the 90-day range, which leads to the observation of the upward pressure it shows the cross short term. In this context, the GBPAUD cross could experience a new rally that could lead to a test of the psychological resistance level located on 1.8500.

Short-term Technical Outlook

The short-term Elliott Wave graph of the GBPAUD cross unfolded in the following 12-hour chart shows the price action moving in an incomplete wave ((c)) of Minute degree labeled in black, which belong to the fourth wave of Minor degree identified in green.

The big picture reveals the cross is moving in an impulsive descending structure of Minor degree, in green, progressing in its fourth wave. This corrective structural series began last September 11th when the GBPAUD found fresh buyers at 1.74935.

The completion of the internal wave ((a)) at 1.85272 on October 21st and wave ((b)) at 1.79378 on November 09th leads to the anticipation of further upward movements in a five-wave internal sequence corresponding to wave ((c)) identified in black. In this regard, the previous chart shows the price starting to develop its third wave (iii) of Minuette degree, labeled in blue.

In this context, the current upward sequence in development has two potential targets as follows.

  • The first potential target is found in the supply zone between 1.84295 and 1.85272. If the price starts to decline from this zone, this could indicate a dominant bearish pressure that could drag the price toward the last September’s lows zone on 1.7500.
  • The second potential target zone is between 1.87353 and 1.89667, which corresponds with the ascending channel’s upper line. If the GBPAUD cross reaches this zone, this could indicate a dominant bullish pressure, and a correction could likely drive the price to the end of wave ((b)) on 1.7937, where the cross could find fresh buyers.

For the active intraday bullish scenario, the short-term invalidation level is located at 1.79378, which corresponds to the origin of wave ((c)).

Categories
Forex Elliott Wave Forex Market Analysis

NZDUSD Reaches a Fresh 90-Day High

The NZDUSD pair ends the last trading week reaching its seventh fresh 90-day range high soaring to 0.69507. This advance brought the Oceanic currency to a close in the extreme bullish sentiment zone. 

Technical Overview

The next chart unveils the NZDUSD pair in its 8-hour timeframe, which shows the market participants’ sentiment in the 90-day high and low range. The figure illustrates the previous 90-day high and low range located at 0.67978 from September 18th. In this regard, the latest rally started on November 02nd created seven fresh 90-day highs.

On the other hand, the EMA(60)-to-Close index shows a bearish divergence that suggests both the bullish trend’s exhaustion and the price’s potential reversion to the moving average. However, a price breakdown and close below the recent lows is needed to confirm the current bullish trend’s correction.

Short-term Technical Outlook

The short-term view of the NZDUSD cross displayed under the Elliott Wave perspective reveals the intraday upward movement advancing in an incomplete Ending diagonal pattern of Minuette degree labeled in blue. Likewise, the advance of the fifth wave in blue should correspond to the ending of the fifth wave of Minute degree identified in black. Nevertheless, the Elliott Wave formation still doesn’t confirm it.

The next4-hour chart reveals the bullish sequence developed by the NZDUSD pair since October 20th when the kiwi found fresh buyers at 0.65555. Until now, the price action advanced in an incomplete upward five-wave sequence, which reached the potential target zone forecasted in a previous analysis.

According to Elliott wave theory, the Ending Diagonal pattern follows an internal sequence subdivided into 3-3-3-3-3 waves. In this context, the previous chart exposes the terminal formation of the bullish impulsive structure advancing in its fifth wave of Subminuette degree labeled in green, which provides two potential scenarios.

  • First Scenario: The price breaks below the base-line that connects the waves ii and iv, confirming the end of the Ending Diagonal pattern and starting a corrective upper degree structure.
  • Second Scenario: The price advances slightly over last Friday’s high and starts to decline below the base-line between waves ii-iv, from where the NZDUSD should begin to develop a correction of upper degree.

In both scenarios, the confirmation of the ending diagonal completion comes from the breakdown and closing below the base-line that connects the end of waves ii and iv.

Finally, the downward scenario will have its invalidation level once the ending diagonal pattern confirms its completion.

Categories
Forex Elliott Wave Forex Market Analysis

GBPJPY Consolidates in the Bearish Sentiment Zone

The GBPJPY cross continues moving by its seventh session in a row in a sideways channel turning in the neutral zone. However, since the last Thursday trading session, the price is consolidating in the bearish sentiment zone.

Technical Overview


The following 8-hour chart illustrates the 90-day high and low range, which exposes the market participants’ sentiment. The figure shows the price action moving around the pivot level at 137.877. Nevertheless, the close below the pivot level pulled the price toward the bearish sentiment zone.

Additionally, the strong bearish rejection in the price action decreasing from the extreme bullish sentiment zone of 140.296 toward the pivot level leads to suspect that the intraday upward movement developed on November 09th couldn’t be as strong as it seemed.

On the other hand, both the positive EMA(60) to Price Index and the 200-period moving average moving below the price, leads to the conclusion that the mid-term sentiment remains on the bullish side. In this regard, the short-term sideways channel’s breakdown could confirm the turning bias from bullish to bearish.

Short-term Technical Outlook

The GBPJPY cross short-term view and under the Elliott Wave perspective reveals the sideways progress in an incomplete corrective sequence that corresponds to wave B of Minor degree labeled in green.

The next 4-hour chart illustrates the advance in a broadening structural series that could correspond to a possible double-three pattern that ended once the price topped at 140.315 on November 11th.

If this scenario is correct, then the pair’s action should be advancing in wave C of Minor degree labeled in green. In this context, the GBPJPY cross should confirm the end of its internal corrective wave corresponding to wave (ii) of Minuette degree identified in blue. In this scenario, the bearish pressure could drag the price toward the end of wave A zone located between levels 133.70 and 133.

The alternative count considers the possibility that wave B of Minor degree remains incomplete and the internal structural series corresponds to a triple-three pattern. In consequence, the current downward move would correspond to the second wave ((x)) of Minute degree. If this scenario is valid, the wave (c) of Minuette degree in blue should have a limited decline, likely until the previous lows located between 135 and 134.

Finally, the invalidation level for both short-term scenarios locates at 140.315, which corresponds to the end of wave ((y)) in black.

Categories
Forex Market Analysis

AUDUSD Prepares for Employment Data Ahead

Market Overview

The AUDUSD pair during the overnight trading session will be driven by October’s employment data, to be released by the Australian Bureau of Statistics in a few hours. The analysts’ consensus expects an increase of 7.1% in the unemployment rate (YoY), representing a deterioration in the labor market conditions and a rise over the 6.9% reported in September.

The unemployment rate jumped from 5.1% in January to 7.5% in August during the current year. In this context, the Governor of the Reserve Bank of Australia (RBA), Philip Lowe, confirmed the change in the focus from inflation rate to labor market conditions, which according to Governor Lowe, would face “an extended period of higher unemployment than we have become used to.”

On the other hand, the next 8-hour chart illustrates the market participants’ sentiment unveiled by the 90-day high and low range, where the price action looks testing the extreme bullish sentiment zone support located at 0.73009.

Likewise, the Aussie advances in a sideways movement. We can see that, after reaching its yearly high at 0.74135, the Aussie was dragged toward the extreme bearish sentiment zone, where the Australian currency bounced back to the extreme bullish sentiment.

Currently, the re-test of the recent intraday high at 0.7335 leads us to expect further upsides in the following sessions, likely to head to its early September highs at 0.7400.

Short-term Technical Outlook

The short-term Elliott Wave view exposed in the next 8-hour chart reveals the sideways advance in an incomplete flat pattern of Minuette degree identified in blue, which, according to the Elliott Wave theory, follows an internal sequence subdivided into 3-3-5. This corrective pattern in progress belongs to the fourth wave of Minute degree labeled in black.

The previous figure shows the current wave (b) in blue, which began on September 25th on 0.70059. The end of wave b of Subminuette degree identified in green pierced the origin of wave a. That leads us to consider the possibility that the current corrective formation could correspond to an expanded flat pattern

Finally, the current incomplete movement corresponding to wave c in green could advance to the potential target area between 0.7352 and 0.7465. If the price action doesn’t surpass the level 0.7352, then the price could test the sideways channel’s previous lows. 

The alternative scenario is if the price breaks above the 0.74134 level, climbing until 0.7465. Thar means the bullish pressure is strong. In that case, the next decline corresponding to wave c in blue will likely be weaker, ending in a region under 0.71, but no further than 0.70.

Categories
Forex Elliott Wave Forex Market Analysis

NZDUSD: Is the Rally Over?

The NZDUSD pair continues consolidating in the extreme bullish sentiment zone, as is revealed on its 8-hour chart. The chart comprises its 90-day high and low range. Currently, the cross remains testing the psychological barrier at 0.6900.

In the previous chart, we can observe the five new highs in the 90-day range reached by the NZDUSD each trading day after the last range maximum, which stood at level 0.67978. This market context leads us to expect a euphoric bullish movement followed by an imminent retracement.

On the other hand, the bearish divergence in the MACD oscillator moves us to recognize the current uptrend’s exhaustion, although it remains in progress.

The next 4-hour chart shows the upward incomplete impulsive sequence, which corresponds to the fifth wave of Minute degree identified in blue that began on October 20th at 0.65555.


Currently, the price action reveals the advance in its fourth wave of Minuette degree labeled in blue. At the same time, we can distinguish the NZDUSD pair’s price running in the wave c of Subminuette degree identified in green. In this context, the intraday decline could lead the price to develop a new short-term rally subdivided into a five-wave sequence.

Short-term Technical Outlook

The short-term Elliott wave view for the NZDUSD pair unfolded in its 4-hour chart foresees further upsides, which could advance to the area between 0.6926 and extend its gains until 0.6972. This upward movement could complete its fifth wave of Minuette degree labeled in blue.

An alternative scenario considers the possibility that the NZDUSD pair could achieve a limited decline to the demand zone between 0.68452 and 0.68281, where the pair could find fresh buyers and complete its fourth wave of Minuette degree identified in blue.

On the other hand, the limited correction corresponding to wave (iv) in blue could advance toward the ascending channel’s base-line, where the cross could find its dynamic support. Once the price finds fresh buyers, the pair may advance on its fifth wave of Minuette degree into five internal segments.

Lastly, the bullish scenario’s invalidation level is at 0.67242, which corresponds to the end of wave (i) of Minuette degree.

Categories
Forex Course

175. Understanding ‘Market Sentiment’ In The Forex Market

Introduction

By now, you have come across terms like bear markets, bull markets, and neutral markets. At their core, these terms represent market sentiment. In this lesson, we will learn about market sentiment in forex and what brings it about.

What Is Market Sentiment?

Forex traders execute their trades based on how they think the market will move. If you are a forex trader, for whatever your reasons, you must have thought at some point, “…I think the price for the GBP/USD will rise, let me go long on the pair.” This decision was your sentiment about that particular currency pair. By making that trade, you have expressed your sentiment about the currency pair.

However, not every other forex trader would have agreed with you that the price for the GBP/USD would rise. Some forex traders thought the pair would fall and go short. Hence, at any given moment, some traders will hold the assertion that a given currency pair will rise while others claim that the pair will drop. Therefore, at any given moment, there will always be traders favoring going either long or short. Those who are in the majority form the market sentiment.

Therefore, market sentiment is the overall belief of the majority of traders. In the forex market, the market sentiment is the dominant consensus by active traders about a particular currency.

Types of Forex Market Sentiment

Bullish market sentiment occurs when most traders believe that the price for a particular currency pair will rise, and they go long.

Bearish market sentiment occurs when more forex traders short a currency pair because they believe that the price will fall.

Neutral market sentiment occurs when an equal number of traders are going long and short on the same currency pair.

What brings about market sentiment in forex?

In the forex market, sentiments express the outlook of traders about a particular currency or currency pair. Thus, the two main drivers of market sentiment in the forex markets are geopolitical developments and fundamental economic indicators.

Geopolitics

Unexpected political events may impact the future of a country’s economic prospects. In the current climate, some of the significant geopolitical developments that affect market sentiment in forex include; Brexit, the Sino-American trade war, and the 2020 US presidential elections.

Let’s look at Brexit, for instance. In September 2020, there has been increased pessimism about Brexit negotiations with the UK threatening not to honor an earlier agreement with the EU. To forex traders, this increases the chance that the UK will not secure favorable trade deals and also ruin its reputation globally. Since this poses a risk for the UK economy, market sentiment was bearish on the GBP.

Fundamental Economic Indicators

These indicators show how the economy has fared. They show if the economic condition of a country has been growing, stagnating, or worsening. Forex traders base their market sentiments by making their judgments about the economy’s future, depending on how they interpret the publication of these indicators.

If an economic indicator, say unemployment rate, is better than what analysts predicted, it shows that the economy is expanding hence better prospects. When the fundamental indicators are positive, forex traders will adopt a bullish stance on that country’s currency. Conversely, negative fundamental data leads to a bearish sentiment on the currency.

[wp_quiz id=”89638″]
Categories
Forex Elliott Wave Forex Market Analysis

Is the EURJPY Ready to Develop a New Decline?

The EURJPY cross advances in a long-term consolidation structure, which began in early December 2016. The short-term Elliott wave view predicts a limited decline in the following trading sessions.

Market Sentiment

The EURJPY cross closed the last trading week, cutting Monday’s session gains when the cross jumped from 122.835 until 125.136, mainly supported by the stock market’s post-election rally.

The following figure shows the EURJPY in its daily timeframe, revealing the mid-term big-market participants’ sentiment exposed by the 90-day high and low range. In this context, the cross is entering into the bearish sentiment zone. However, the 60-day weighted moving average still doesn’t confirm the short-term bearish bias.

After a rally that carried the cross to advance over 11% since May 07th (when the EURJPY bottomed on 114.397 and then soared, reaching the highest level of the year at 127.075 on September 01st), the cross began to retrace, turning its mid-term market sentiment from extremely bullish to bearish.

Nevertheless, the price action still doesn’t confirm the bearish sentiment. In this regard, the short-term sentiment remains neutral until the price confirms the bias.

Technical Overview

The big picture of EURJPY illustrated in the following daily chart exposes a long-tailed yearly candlestick mostly bullish. However, the upper shadow hints at a bearish pressure near the psychological barrier of 127. Moreover, the next resistance is placed at 127.502, which corresponds to the high of 2019.

The EUJPY long-term trend under the Dow Theory perspective and exposed in the next log scale weekly chart reveals the primary trend identified in blue that remains slightly bullish.

At the same time, the secondary trend exposes the sideways movement developing as a pennant pattern, which began in early December 2016 when the price found resistance at 149.787 and could break soon.

According to the classic chartist theory, the pennant pattern is a technical figure that calls for the continuation of the previous movement. In this case, the pennant could resume the rally developed since late July 2012 at 94.114 ended at 149.787 in early December 2014.

Short-term Technical Outlook

The short-term Elliott wave view for EURJPY shows in its 12-hour chart advancing in an incomplete corrective sequence that began on May 06th at 114.397, where it completed its wave A of Minor degree labeled in green.

Once the price found fresh sellers at the highest level of the year, the cross started to advance in its wave B, still in progress. In this context, the previous chart unveils the intraday upward sequence corresponding to the incomplete wave ((b)) of Minute degree identified in black.

The price action could boost the cross until the next supply zone, located between 125.285 and 126.123, where the EURJPY could start to decline in an internal five-wave sequence corresponding to wave ((c)), in black, that may drop to 120.271, though, the price could extend its drops until 117.124.

The short-term bearish scenario’s invalidation level locates above the end of wave A in green at 127.075.

Categories
Forex Elliott Wave Forex Market Analysis

Is GBPUSD Ready for a New Decline?

Overview

The GBPUSD pair advances in an incomplete bearish corrective formation that corresponds to a wave B of Minor degree. In this context, the completion of wave B could lead to a new decline, which could drag the price below Septembers’ low.

Market Sentiment

The GBPUSD pair suffered another drop for the second day in a row, falling from the extreme bullish to a bullish sentiment zone, where it found support in the psychological barrier of level 1.31.

The following daily chart illustrates the 90-day high and low range, revealing the mid-term market participant’s sentiment. The figure shows the price action moving mostly sideways in a range that oscillates between the bearish and bullish sentiment zones; that is, between 1.27204 and 1.32289.

Furthermore, the 60-day weighted moving average is seen moving below the Pound’s price, which confirms the short-term bullish bias that carries the price.

Considering the indecision, the cable is exhibiting since last August. The intraday bias will stay neutral until the GBPUSD pair confirms its next movement, for example, through a breakout.

Technical Overview

The GBPUSD price reveals a yearly long-tailed candlestick that suggests the price will continue being dominated by the upward bias. As exposed in the following 2-day chart, the Pound erased the first 2020 quarter losses that reached up to 13.89%. The cable currently eases 0.67%(YTD).

The big picture of GBPUSD and under the Dow Theory unfolded in the next daily chart illustrates the cable developing a primary upward trend in progress, which currently could be forming a corrective secondary trend.

In this context, according to Dow Theory, the price retraced below 33% of the first upward movement, which accomplishes with the minimum requirement for a correction of the previous move of a similar level.

Nevertheless, considering that the price remains in a short-term downward trend, the price could continue developing a new bearish sequence.

Short-term Technical Outlook

The short-term Elliott wave outlook for GBPUSD unfolded in its 8-hour chart reveals the corrective rally that corresponds to an incomplete wave B of Minor degree identified in green, which leads us to expect a decline in a five-wave sequence for the following trading sessions.


The previous chart exposes a corrective structural series that began on September 01st when the price found fresh sellers at 1.34832 and dragged the cable until 1.26751 on September 23rd, where the pound started to advance in its wave B that remains in progress. 

In this regard, the current upward movement could find resistance in the first supply zone between 1.32069 and 1.32280. If the price extends its previous progression, creating a bull trap, it could climb until 1.33195. There, the price could start to decline in a five-wave sequence corresponding to wave C identified in green.

The potential next wave C could extend until the demand zone between 1.25658 and 1.24796, which corresponds with the mid-term descending channel’s base.

Finally, the bearish scenario’s invalidation level locates at 1.34832, which agrees with the origin of wave A in green. Nevertheless, before positioning on the downward side, the GBPUSD pair should confirm (or discard) the bearish entry. 


Categories
Forex Elliott Wave Forex Market Analysis

AUDNZD Continues Under Bearish Pressure

Overview

The AUDNZD cross remains moving mostly bearish in the bullish sentiment zone. It alters the price surpassing the 1.10 psychological barrier and begins a corrective sequence that remains in progress; however, this downward movement could end soon.

Market Sentiment

The AUDNZD moves mostly downward in the bullish sentiment zone, piercing July’s low area at 1.056. The Oceanic Cross advances over 1.5% (YTD).

The following figure exposes the AUDNZD cross in its daily timeframe. The chart reveals the long-term market participants’ sentiment bounded by its 52-week high and low range. The price action began a downward sequence; after that, the cross surpassed its last 52-week high of June 02nd, located on 1.08807 in a rally that elapsed six sessions in a row.


Moreover, the 60-day weighted moving average confirms the downward short-term bearish bias that favors the price action. Nevertheless, considering that the cross moves in the bullish sentiment zone, the AUDNZD cross’s decline could be a correction of the upward cycle that began last mid-March.

Technical Overview

The AUDNZD cross under the Dow Theory perspective reveals that the price has started to develop a bullish primary trend that began on March 18th when the price found fresh buyers at 0.99906.

The following chart illustrates AUDNZD in its daily timeframe. The figure exposes the demand incorporation below the parity, which carried up the price until 1.10438, from where the price started to decline in a secondary trend.

The retracement developed by the Oceanic cross beyond the 33% leads us to confirm that the latest decline in progress corresponds to the rally’s corrective movement that began on March 18th.

The mid-term Elliott wave view of the AUDNZD cross illustrates in its 12-hour chart the downward move in a complex corrective structure that looks like an incomplete double-three pattern (3-3-3).

The previous chart reveals the price action is moving in its wave (c) of Minuette degree labeled in blue, which belongs to wave ((y)) of Minute degree in black. Likewise, this entire move corresponds to wave 2 or B, which retraces the upward five-wave sequence that began on March 18th at 0.99906.

Technical Outlook

Once the AUDNZD found sellers at 1.07565, the Oceanic cross began its wave (c) of Minuette degree labeled in green that remains in progress.

As illustrated in the following 8-hour chart, the price could extend its declines to the area between 1.05186 and 1.04870, where the price could find support. Likewise, if the price extends its drops below 1.03511, the next movement’s strength could be limited to a re-test of the August 18th high located on 1.103.

On the other hand, if the price action breaks and closes above the supply zone between 1.06456 and 1.06718, there exists the possibility of a new rally. This new bullish leg could surpass the 1.103 mark.

Finally, the invalidation level for the short-term bearish scenario is located at 1.07565.

Categories
Forex Elliott Wave Forex Market Analysis

Is USDCAD Ready for a Short-Term Rally?

The USDCAD pair reveals a strong bearish movement that seems have found a short-term bottom. In this regard, the price could start a rally that could boost the price toward October’s highs zone.

Market Sentiment

The USDCAD pair continues moving in its extreme bearish sentiment zone, erasing the gains reached during the first quarter of the year when the price advanced over 13%. Currently, the Loonie gains a modest 0.67% YTD.

The next figure illustrates the USDCAD pair in its daily timeframe. The chart exposes the long-term market participants sentiment bounded by the 52-week high and low range. 

The chart reveals the price action continues developing fresh lower lows, which leads us to observe that market participants continue holding bearish positions on the pair. Furthermore, the 60-day weighted moving average continues above the price, which confirms the bearish bias that advances the price.

On the other hand, as long as the USDCAD price remains below 1.33631, the Loonie will stay under bearish pressure.

Technical Overview

The USDCAD pair exposes a bearish reversal formation that erased the progress developed during the first quarter of the year. The following weekly chart reveals a powerful bearish long-tailed candle in terms of a yearly candlestick, suggesting that the price would continue developing more declines in the long-term.


On the other hand, the big picture exposes a long-term sideways formation that persists since mid-2015. Likewise, the last downward movement that began at 1.46674 appears to have found a bottom on 1.29238 the current trading week. 

In this regard, if the price starts to develop a corrective rally, according to the Dow Theory, the USDCAD pair should advance to 1.35022 and up to 1.40761; this upward sequence would correspond to a valid correction of the same degree that the last bearish move developed by the pair since last mid-March.

The mid-term Elliott wave view of USDCAD illustrated in the next 12-hour chart reveals an incomplete corrective sequence that looks like a double three pattern (3-3-3) of Minor degree labeled, in green, which began on March 18th at 1.46674.

Currently, the USDCAD develops its wave ((b)) of Minute degree identified in black, which belongs to wave Y in green. In this context, the wave ((b)) looks like an incomplete flat pattern (3-3-5), which subdivides into a 3-3-5 sequence. Moreover, the actual structural series suggests that the Loonie started to develop its wave (c) of the Minuette degree labeled in blue. 

Short-term Technical Outlook

The short-term Elliott wave view of the USDCAD unfolded in the following 8-hour chart, anticipates its progress in an incomplete flat pattern, which could be starting to advance on its wave (c) of Minuette degree labeled in blue.

If the Loonie find fresh buyers in a retracement to the demand zone between 1.30433 and 1.30086, and the price breaks and closes above 1.31473, then the price could confirm the potential rally that corresponds to wave (c) of Minute degree with a potential target in the supply zone between 1.33970 and 1.34592.

Lastly, the invalidation level for the intraday bullish scenario locates at 1.29283

Categories
Forex Market Analysis

NZDUSD Bullish ahead of the RBNZ Meeting

Overview

The NZDUSD cross advances in the extreme bullish sentiment zone before the RBNZ monetary policy decision, to be held during the overnight trading session. The intraday Elliott Wave view reveals its progress in an incomplete five-wave sequence, which could boost the price toward a new high.

Market Sentiment

The NZDUSD cross waits for the Reserve Bank of New Zealand (RBNZ) interest rate decision, as it moves on the extreme bullish sentiment zone. Although the kiwi’s high volatility during this year made it drop over 18.7% in the first quarter of the year, the NZDUSD is still up by 1.44% (YTD).

The next chart illustrates the NZDUSD in its 8-hour timeframe. The figure unveils the price action developing a short-term rally that pushed it from the extreme bearish till the extreme bullish sentiment zone.

Moreover, the consecutive intraday higher high could make the market participants expect further upsides during the interest rate decision, which will take place in the overnight trading session.

In this context, the analysts’ consensus foresees that the RBNZ official cash rate (OCR) will remain unchanged at 0.25%. However, considering that during the latest Reserve Bank of Australia (RBA) broad meeting, the policymakers decided to cut the interest rate to 0.10%, it is possible that the RBNZ would follow the same direction.

In consequence, although the NZDUSD moves in the extreme bullish zone, a drop below 0.67635 could be a signal the pair might start developing a downward corrective movement during the following trading sessions.

Technical Overview

The big picture of the NZDUSD cross exposed in the 2-day log-scale chart reveals its advancement in an incomplete impulsive sequence, which looks moving on its fifth wave of Minute degree labeled in black. 

According to the Elliott Wave theory, considering that the price action developed a third extended wave, the fifth wave should have a limited upside. Thus, the extension of the current upward movement could end soon.

On the other hand, the bearish divergence observed in the MACD oscillator confirms that the cross’s current 5th-wave upward sequence is in an exhaustion stage. 

Likewise, the long-term descending trendline suggests that the price action currently tests a dynamic resistance, which could be surpassed backed by increasing volatility. Nevertheless, this potential breakout could end being a fake-out

Short-term technical Outlook

The intraday outlook for NZDUSD under the Elliott wave view and illustrated in its 4-hour chart exposes its progress in the third wave of Minuette degree labeled in blue, which could retrace to the area between 0.6785 and 0.67562.

If the price confirms the bounce from the demand zone between 0.67562 and 0.67850, the kiwi could advance toward the long-term supply zone, which corresponds to a potential target area between 0.69311 and 0.69780.

Once the fifth wave of Minuette degree, which belongs to the fifth wave of Minute degree, completes, the cross could start developing a corrective sequence with length and time proportional to the structural series of Minute degree.

Lastly, the invalidation of this intraday upward scenario is a drop below 0.67242.

Categories
Forex Elliott Wave Forex Market Analysis

Euphoric Market’s Sentiment Pushes GBPCHF Up

Overview

The GBPCHF cross began the current trading week, advancing over 1.30%, boosted by the U.S. post-election rally and Pfizer’s Covid vaccine upbeat results. However, the Elliott Wave view anticipates that the euphoric rally could soon end, and the cross could reverse its course toward new lows.

Market Sentiment

The week started with a risk-on U.S. Presidential post-election stock market rally, driving the risk-off currencies to drop. In this context, the GBPCHF cross advances over 1.30% to its highest level since late September.

The following 8-hour chart displays the intraday market sentiment. Although the sideways movement predominates since late September, the strong bullish move developed in the Monday trading session takes the GBPCHF cross to the extreme bullish sentiment zone.

Likewise, we can see the price action developing above the 60-period weighted moving average, which confirms the intraday upward bias that could hold during the following trading sessions.

On the other hand, the euphoric sentiment bolstered by news media’s coverage of the U.S. elections and the continuation of the stock market rally added to the news of the promising vaccine results developed by Pfizer and BioNTech leads us to expect a limited upside in the risk-on currencies.

Technical Overview

The big picture of the GBPCHF under the Elliott wave perspective reveals its progress in a descending broadening formation. Its latest downward sequence began on December 13th, 2019, when the price found fresh sellers at 1.33113. We can see, as well, that this leg still remains in progress.

The following daily chart unveils the advance in the fifth wave of Minute degree labeled in black, which started on 1.22224, where the price action declined in a bearish impulsive movement reaching a new lower low. This decline that ended on 1.15989 completed the first wave of Minuette degree labeled in blue.

Currently, the GBPCHF cross moves in its second wave (in blue). Nevertheless, the psychological barrier of 1.20 could represent a significative intraday resistance.

Technical Outlook

The intraday outlook of the GBPCHF cross reveals the bullish continuation of the current upward momentum. The next 2-hour chart exposes the supply and demand zones according to the potential next move that the cross could develop in the coming trading sessions.

On the one hand, the price advances in its wave c of Subminuette degree identified in green, developing the third internal wave. Likewise, the retracement that should correspond to its fourth internal wave could retrace to the area between 1.19292 and 1.19694. This zone could back the possibility of a new rally that would boost the price toward 1.21012 and 1.21306. 

On the other hand, our first scenario considers the bearish continuation. In this case, if the price action penetrates and closes below 1.1803, the cross could see further declines toward the zone of 1.1650.

Finally, our second scenario considers that if the GBPCHF cross continues its advance beyond 1.22224, the cross could extend its gains toward the descending upper- trendline shown in the daily chart.

Categories
Forex Elliott Wave Forex Market Analysis

AUDJPY Could Develop a Limited Upside

Overview 

The AUDJPY cross advances in an incomplete upward sequence that belongs to a corrective structural series backed by Monday’s trading session’s euphoric sentiment. The Elliott Wave view unveils the likelihood of a limited upside before resuming its declines.

Market Sentiment

The AUDJPY cross retraces on the overnight Tuesday trading session after the surprising weekly kick-off, which jumped the price over 2.2%, climbing until 77.037, its highest level since September 18th.

The AUDJPY 8-hour chart illustrates the 30-day high and low range, which exposes the participants’ intraday market sentiment. The figure distinguishes the price action consolidating in the extreme bullish sentiment zone, backed by the stock market’s euphoric rally on Monday’s trading session.

The breakout of the last 30-day high of 76.274 during Monday’s trading session raised the participants’ extreme bullish sentiment, expecting further upsides on the cross. Moreover, we see that the price action remains above its 60-period linear weighted moving average, which confirms the bullish bias on the AUDJPY.

Nevertheless, the AUDJPY found resistance below mid-September’s consolidation zone. This market context expects a significative retracement or a consolidation movement before continuing the rally experienced in Monday’s session. Finally, a retracement below the 75.087 level would turn the market sentiment from bullish to bearish.

Technical Overview

The AUDJPY cross advances in an incomplete upward bullish sequence of a lower degree, which belongs to a descending structure that began on August 31st when the price topped on 78.462.

The below 8-hour chart exposes the price action running in an upward wave ((b)) of Minute degree labeled in black, which currently advances its fourth wave of Minuette degree identified in blue. Likewise, according to the Dow Theory, considering that the AUDJPY cross advanced over 66% of the bearish decline, the price should develop a bearish connector corresponding to wave ((b)).

In this context, following the Elliott Wave theory and considering the third internal segment of the intraday rally, the price could produce a limited upside toward the supply zone bounded between 77.295 and 77.497. Finally, the bearish divergence on the MACD oscillator may mean a confirmation of the upward movement’s exhaustion corresponding to wave ((b)).

Short-Term Technical Outlook 

The incomplete bullish sequence of the AUDJPY cross unfolded in its 4-hour chart exposes the progress in its fourth wave of Subminuette degree labeled in green. Likewise, considering that the third wave is the extended wave of wave (c), the fifth wave in green should not be extended.

On the other hand, considering that the second wave in green is a simple correction, the fourth wave should elapse more time than the second wave. Additionally, the fifth wave in green could extend itself between 77.140 and 77.654. The price could find fresh sellers expecting to open their shorts on the bearish side of wave ((c)) of Minute degree labeled in black. The invalidation level of the bearish scenario locates at 78.462. 


Categories
Forex Elliott Wave Forex Market Analysis

GBPCAD Advances in a Double-Three Pattern

Overview

The GBPCAD cross advances in a sideways sequence corresponding to an incomplete double-three pattern. The mid-term Elliott Wave view foresees a potential rally that could boost the cross toward last March’s highs.

Market Sentiment

The mid-term market sentiment overview of the GBPCAD cross unfolded by the 90-day high and low range and illustrated in its daily chart, reveals the price action moving in the bearish sentiment zone (SZ).

The previous chart reveals the sideways movement bounded between the extreme bullish SZ located at 1.76759 and the extreme bearish SZ at 1.69214. Likewise, the 60-Day moving average looks flat, suggesting the balance between supply and demand, or bull and bear traders, which in turn, is indicative of sideways action.

On the other hand, considering the year’s opening price at 1.71923, we distinguish that the yearly candlestick pattern corresponds to a narrow body candle identified as a doji, revealing the next direction’s market participants’ indecision that the price will take.

In consequence, while the GBPCAD cross remains moving mostly sideways, the primary bias will continue neutral.

Elliott Wave Overview

The long-term Elliott Wave landscape of the GBPCAD cross reveals the price action is developing an incomplete three-wave sequence of Intermediate degree labeled in blue, which currently advances its wave (B). The internal structure unfolds in a double-three pattern as it exposes the next weekly chart on a log scale.

The previous chart reveals that the double-three pattern in progress looks incomplete. According to the Elliott wave theory, this complex formation follows an internal structural series subdivided as 3-3-3. In this context, the GBPCAD cross advances in its last “three” or the third component of the double-three pattern identified as wave Y of Minor degree labeled in green.

The internal structure of wave Y subdivided into another “three” sequence, which advances in its wave ((b)) of Minute degree labeled in black. Likewise, the wave ((b)) follows the arrangement of a triangle pattern. Thus, the GBPCAD cross should develop an upward movement subdivided into five-waves, corresponding to its wave ((c)) of Minute degree identified in black.

Elliott Wave Outlook

Considering the progress of the GBPCAD cross into a triangle pattern, the following 12-hour chart unveils that the price completed its wave ((b)) with the failure of reaching a new lower low at 1.69014, where the cross began to advance in an upward sequence that corresponds to its wave ((c)) of Minute degree identified in black.

The previous chart illustrates the end of the wave (e) of Minuette degree identified in blue and the upward sequence of a potential leading diagonal pattern, which could follow a 5-3-3-3-3 internal sequence. Simultaneously, the price seems to be advancing in its fifth wave of Subminuette degree labeled in blue, which belongs to the first wave of Minuette degree in blue. 

The first impulsive wave of Minuette degree could find resistance in the supply zone between 1.73665 and 1.74341, from where the cross could start to retrace until the demand zone is located between 1.71151 and 1.70262. Once GBPCAD completes its second wave, the third wave could become the upward cycle’s extended wave. This upward movement could drive the pair toward 1.77356 and continue until 1.79911.

The bullish scenario’s invalidation level locates at 1.69014, which coincides with the wave’s origin ((c)) that remains in progress.

Categories
Forex Market Analysis

Profiting from GBPNZD Weakness

Overview

The GBPNZD cross extends its losses. The pair’s sentiment is currently controlled by the bears. The Elliott Wave sequence suggests the possibility of a new decline, which could accelerate its price toward the long-term ascending trendline.

Market Sentiment

The GBPNZD cross declined 0.47% in the Wednesday trading session, propelled by the US presidential election’s tight results. In this context, the 12-hour chart illustrates the market sentiment, displaying the 90-day high and low range.

We observe in the previous chart that GBPNZD moves mostly sideways and consolidating in the bearish sentiment zone. Simultaneously, the price action moving below the 200 moving average is a confirmation that the short-term bias is to the downside Furthermore, the current session’s range and long body candle reveal the bearish pressure dominating the market sentiment. Finally, the following chart’s lower graph shows the retail traders’ activity positioning, which moves to 74% on the long side. This contrarian indicator confirms the bearish bias of big market participants.

In summary, as long as the GBPNZD price doesn’t unveil bullish reversal signals or surpasses the 1.96371 level, the market sentiment will remain on the bearish side.

Technical Big Picture

The long-term outlook of the GBPNZD cross under the Elliott Wave perspective unveils its advance in a corrective structure, which began in late August 2015 when the price topped at 2.53193 and declined in a three-wave internal sequence. This downward sequence ended in early November 2016, when the price found support at 1.67055.

Once the cross found fresh buyers, the price started to advance in an ascending corrective sequence identified as wave (B) of Intermediate degree, which ended in the first part of March 2020 when the GBPNZD climbed until 2.17598.

In terms of the Elliott wave theory, considering that the structural series in progress completed two segments subdivided into three internal waves, the sequence could correspond to a flat pattern, a triangle, or a double three formation.

Nevertheless, although the three potential structures have different implications, the pressure remains on the bearish side.

Short-term Technical Analysis Outlook

The GBPNZD cross in its 4-hour chart unveils the incomplete downward structure that began on August 20th at 2.02711. This bearish short-term sequence of Minuette degree identified in blue could correspond to a wave (iii) or (c).

In both cases, an upward retracement toward the psychological 1.94 barrier could serve as an entry to the bearish side. Likewise, the third segment, in development, could extend its drops to the area between 1.91117 and 1.89719, which coincides with the long-term ascending channel.

In this regard, long-term traders could wait for this decline where the price could re-test the long-term trendline to add to their long positions.

Finally, the invalidation level for this bearish scenario stays at 1.98053, which coincides with the end of wave (ii) or (b) identified in blue.


Categories
Forex Forex Elliott Wave Forex Market Analysis

Is CADJPY Ready for a New Rally?

Overview

The CADJPY cross advances mostly sideways in an incomplete triangle pattern. The corrective structure that remains in progress suggests the possibility of further upsides in the coming trading sessions.

Market Sentiment

The market sentiment on the CADJPY cross looks neutral, although during the overnight trading session, although the US presidential election is driving up volatility.

The following daily chart shows the long-term market participants’ sentiment unfolded between the 52-week high and low range. The figure reveals the price action currently moving on the neutral zone, which moves near the level of 79.274. 

In this context, the neutral sentiment is confirmed by the sideways channel, which began in early June, and the price action moving below the 60-day moving average Nevertheless, the bullish wide range candle of November 02nd leads to expect further upsides in the following weeks.

Technical Big Picture

The CADJPY cross moves in a sideways upward structure that belongs to an incomplete upward sequence that began last March 17th when the price found fresh buyers at 73.803.

The 2-day chart shown below illustrates the big picture of CADJPY under the Elliott Wave analysis perspective. The figure reveals the pair’s action advancing in an incomplete third wave of Minute degree labeled in black.

The consolidation structure of the CADJPY cross, in progress, suggests the possibility of a bullish continuation. Likewise, in terms of the Elliott Wave theory, if the current upward sequence corresponds to an incomplete impulsive sequence, the price could develop an extended wave. Nevertheless, a signal of confirmation of the potential new rally will occur if the price breaks and closes above the pivot level located at 79.823.

The short-term supports and resistance levels are as follows:

  • Resistance 1: 80.542
  • Resistance 2: 81.448
  • Resistance 3: 82.634

Pivot Level: 79.823

  • Support 1: 78.502
  • Support 2: 77.573
  • Support 3: 76.526

Short-term Technical Analysis Outlook

The CADJPY cross in its 4-hour chart unveils the course in a corrective structure that resembles a triangle pattern (subdivided into 3-3-3-3-3). This potential triangle pattern remains unfinished and could be developing its wave (d) of Minuette degree labeled in blue.


From the previous chart, both the breakout and close above the descending trendline connect the top of wave (b) of Minuette degree with the end of wave b identified in green as the close above the level 79.872 could confirm the turning bias from neutral to bullish.

The advance in its wave (d) identified in blue could find resistance between 81.448 and 81.909. Once the potential triangle pattern completes, the price could advance toward 84.739 and even extend its gains until 86.677.

Finally, the upward scenario’s invalidation level is located below the end of wave (a) of the Minuette degree labeled in blue.

Categories
Forex Market Analysis

Australian Dollar Prepares for Interest Rate Decision and Retail Sales Data Ahead

Overview

The Australian Dollar will face two high volatility events; the first one corresponds to the interest rate decision, for which the analysts’ consensus foresees a rate cut to 0.1% from the current 0.25%. The second one corresponds to September’s Retail Sales figures, where the consensus expects a recovery. Nevertheless, the price action suggests a new decline before reversing.

Market Sentiment

From a fundamental perspective, the Australian Dollar will have two high volatility events that will drive the next week’s oceanic currency movements.

The first event corresponds to the Interest Rate Decision, which will occur on Monday the 2nd during the overnight session. The analysts’ consensus foresees a reduction from the current rate of 0.25% to 0.10%. 

The last interest rate cut by the Reserve Bank of Australia’s broad members occurred in March 2020, where policymakers decided to cut the reference rate from 0.5% to 0.25%.

The second high impact will occur in the overnight trading session of Tuesday 03rd, where the Australian Bureau of Statistics will release the Retail Sales (MoM) data corresponding to September. The analysts’ consensus foresees a decline to 1.5%. 

Although the analysts’ polled foresee a contraction for September, they expect an improvement in the retail sector after falling 4% in August.

On the market sentiment side, the GBPAUD cross in its daily chart exposes the 90-day high and low range, which reveals the short-term participants’ sentiment. 

The previous chart illustrates the price action moving in an upward sequence that began on September 11th that pushed the cross from the extreme bearish sentiment zone toward the extreme bullish sentiment zone. 

In fact, the 60-day moving average movement below the price confirms the bullish bias that carries the cross. The next supports locates at 1.82688, which corresponds to the extreme bullish sentiment zone support, and 1.81227 corresponds to the 60-day moving average that acts as a dynamic support.

In summary, considering the pessimistic forecasts by the Australian data analysts and the extreme bullish sentiment unveiled in the GBPAUD cross, there exist the possibility of further weakness in the oceanic currency.

Technical Analysis Outlook

The big picture of the GBPAUD cross under the Dow Theory exposed in its 2-week log-scale chart reveals the price is moving mostly sideways since early March 2013, when the price touched its bottom of 1.43811. Once the cross found buyers, the price raised until 2.23722 reached in mid-August 2015. 

Once the March 2015 high was reached, the pair started to correct the Primary trend finding support at 1.57896 in late October 2016. This correction accomplishes the Dow Theory rule that says that the Secondary trend retraces between 33% to 66% of the Primary trend. 

The same situation occurs with the ascending sequence that advances from 1.57896 toward 2.08522 reached in mid-March 2020, which retraces beyond 66% of the previous decline. 

Likewise, the GBPAUD cross started to develop a downward sequence, which found a bottom at 66% of the previous rally. Nevertheless, considering the price and time relationship between the last decline and the previous two movements, we conclude that this decline corresponds to the Minor trend of the Secondary upward trend, which looks incomplete. 

The GBPAUD outlook under the Elliott Wave Theory exposes the progress in a downward five-wave sequence, which advances in its incomplete wave 4 of Minor degree labeled in green. This corrective structural series currently moves in its wave ((a)) of Minute degree identified in black.

Considering the elliott Wave theory, the current wave in progress should develop three internal segments and advance until the zone between 1.86783 to 1.90442, where the cross could find resistance and start its wave ((b)) in black.

Likewise, considering that the third wave of Minor degree is the extended wave, the fifth wave should fail to reach a lower low than the end of the third wave of Minor degree located at 1.74935. Finally, the invalidation level of the bearish scenario is located above 1.95100.

Categories
Forex Market Analysis

US Dollar Index Advances Boosted by Surprising Economic Growth

Overview

The US Dollar Index accelerated its gains on Thursday’s trading session boosted by the surprising economic recovery in Q3 2020 that advanced 33.1%, beating analysts’ expectations. Nevertheless, although Greenback’s intraday recovers, the price could see a new decline in the coming trading sessions.

Market Sentiment 

The US Dollar Index (DXY) raises on Thursday trading session by 0.54%, boosted by Q3’s GDP growth rate, which beat the analysts’ expectations.

The US economy expanded in the third quarter by 33.1% in Q3 2020, beating the analysts’ consensus of a 31% raise. This reading is the biggest expansion in the economy following the previous  Q2 period, which unveiled a record 31.4% plunge triggered by the coronavirus lockdown.

The following chart exposes the US Dollar Index in its daily timeframe. The figure unveils the 90-day high and low range, the price action moving mostly sideways in the bearish sentiment zone. 

Likewise, the intraday activity develops a strong bullish movement during its Thursday’s trading session, which looks accelerating, supported, as already said, by the surprising Q3 GDP growth, whose figure was released on Thursday before the US session’s opening bell. 

In summary, the US Dollar Index context shows that the big picture of the market is on the bearish side. However, the intraday activity reveals an upward thrust representing an upward correction of the Greenback’s primary bearish trend.

Technical Analysis Outlook

On the technical side, the US Dollar Index unveils its price movements in an incomplete corrective formation, which still could visit fresh lows.

The next weekly chart and in log scale reveals the DXY under the perspective of the Dow Theory, which exposes to its primary trend developing an incomplete correction of the rally that the Greenback began in early May 2011 and found resistance at 103.82 in late December 2016.

Once the Dollar Index found fresh buyers, the public activity raised, driving the price towards the level of 103.82, where DXY began to develop a corrective move, which remains in progress. The first decline fell to 50% of the previous rally, finding support at 88.25, where the price reacted, developing an upward sequence.

Actually, the price action develops a consolidation structure following a sideways formation, which is in progress since early January 2018. The third segment, which looks in place, accumulates a retracement of around 66% of the corrective formation’s second internal leg. This reading leads us to observe that the current decline could be in an exhaustion stage.

The long-term Elliott Wave perspective for DXY marks its advancement in an incomplete flat pattern (3-3-5), which currently advances in its wave C of Minor degree labeled in green. This current leg could see further declines in the coming trading sessions.

As illustrated in the next 2-day chart, DXY advances its wave ((iv)) of Minute degree identified in black. According to the alternation principle, the internal segment should take more time than wave 2. In this regard, the level of complexity of this corrective formation should be higher than on the second wave. In other words, the fourth wave could be a triangle formation or a double or triple correction.

Finally, the wave C’s potential bearish target can be located below the mid-February 2018 low; it is near the 87.5 level, where the Greenback could start to develop a new bullish cycle of upper degree. The invalidation level of the current bearish scenario is placed at 98.50.

Categories
Forex Market Analysis

Dow Jones Turns Bearish As the US Presidential Election Approaches

Overview

The Dow Jones Industrial Average holds its bearish bias expecting the US presidential election scheduled next November 03rd. Throughout this year, the Industrial Average has declined over 6% (YTD). Although the latest decline looks like a short-term top, the US leading benchmark could resume its advances.

Market Sentiment Overview

The Dow Jones Industrial Average (DJIA) accelerated its declines on Wednesday’s trading session, backed by the market participants’ expectations before the US presidential election scheduled next November 03rd.

The following daily chart exposes the short-term market movements of the Industrial Average. The figure shows the penetration below the psychological level of 27,035.1 pts, which indicates the Dow Jones penetrating the bearish sentiment zone.

Simultaneously, the price action reveals its consolidation below the 60-day weighted moving average, which confirms the bearish bias. On the other hand, the re-test of the previous low located at 26,541 pts increases the likelihood of further declines.

The next daily chart unveils the 90-day high-low range of the Dow Jones Volatility Index (VXD). The figure shows the advance of VXD in the bullish sentiment zone, which confirms the bearish sentiment observed in the Industrial Average, as an increasing (bullish) volatility is mostly associated with declining prices.

Therefore, considering both the Industrial Average as the Dow Jones Volatility Index, the short-term market sentiment bias for the DJ-30 remains on the bearish side. The likelihood of extended declines would drive the DJIA toward the extreme bearish sentiment zone.

Technical Analysis Outlook

The big picture of the Industrial Average reveals that the retracement experienced during the last two weeks belongs to the bullish sequence that began on March 23rd when the Dow started its recovery, following the massive mid-February sell-off.

The DJIA’s technical outlook under the Elliott Wave Theory is unveiled in the following log-scale daily chart. We can see that the primary bullish trend that began with March 23rd’s low located at 18,213.5 pts, which is currently in progress.

In the figure, we see DJIA’s price consolidating in a sideways formation. This stage began once the Industrial Average topped at 29,193.6 pts on September 03rd.

On the other hand, we should consider that the sideways formation moves above the 25,570.2 level, or 33% of the bullish sequence of the primary trend. Therefore, the upward trend remains intact right now, and the current correction represents a pause and not a deeper correction for the US benchmark.

The below 4-hour chart shows the Industrial Average under the Elliott Wave perspective, developing an incomplete flat pattern (3-3-5) of Minute degree labeled in black that looks incomplete.

Currently, Dow Jones completed its wave (iii) of Minuette degree labeled in blue, which belongs to wave ((c)) of Minute degree. This structural series that remains in progress moves inside the wave B or 4 of Minor degree labeled in green.

Considering that the flat pattern looks incomplete, the Industrial Average should see a new lower low, which would reveal a bullish divergence on the MACD oscillator confirming the progress on the fifth wave of Minuette degree. After this move, the Dow Jones should develop a wave C or 5 of Minor degree with an internal five-wave sequence.

Therefore, short-term, we may expect a limited decline, likely toward the 26,050 pts, from where Dow Jones could start to develop a new rally in five waves.

Categories
Forex Elliott Wave Forex Market Analysis

NZDUSD Short-Term Wave Analysis

Overview

The NZDUSD pair advances in a sideways corrective formation suggesting the progress in an incomplete short-term flat pattern. The completion of its move could give way to a new bearish movement of the upper degree; however, this incomplete correction could be temporary.

Market Sentiment Overview

The New Zealand Dollar moves slightly bullish this Thursday, 22nd advancing 0.13%, expecting the inflation data released by New Zealand’s Statistics, Stats NZ, in the upcoming overnight session. The data corresponds to the third quarter of 2020, and surveyed analysts expect an increase that could rise to 1.7% (YoY), being 0.2% more than the previous reading published in July.

The New Zealand Dollar futures market sentiment, presented in the following daily chart, unveils the price moving in the extreme bullish sentiment zone. In the chart, we can distinguish  0.6463 as support the level and 0.6797 as the resistance level. A level that corresponds to the 52-week high. 

On the other hand, the chart highlights the price action is moving mainly sideways, consolidating around the weighted moving average of 60 days. This context of price action suggests we can expect a corrective move before continuing its bullish trend.

Concerning the evolution of the Commitment of Traders Report, the previous chart exposes the institutional positioning on the bullish side. In consequence, although the current consolidation calls for a corrective move, the primary trend is bullish.

The next figure unveils that 73% of retail traders currently hold their positions on the bearish side, confirming a contrarian long-term upward bias to this pair.


Elliott Wave Outlook

The NZDUSD short-term outlook under the Elliott Wave perspective unveiled in its 3-hour chart exposes the kiwi’s sideways advance since the oceanic currency topped at 0.67978 on September 18th, where the pair started to develop a corrective structure that remains in progress.

Considering that a corrective structure is subdivided into a three-wave sequence, we can notice in the previous figure that the NZDUAD action progresses in its second wave, identified as wave B of Minor degree, and labeled in green. This segment corresponds to a flat pattern (3-3-5), which currently develops its wave ((c)) of Minute degree identified in black.

At the same time, the internal structure of the wave ((c)) reveals that the price action could be advancing in its wave (v) of the Minuette degree labeled in blue. This market context suggests the possibility of a limited upside before start developing a downward sequence, corresponding to wave C of Minor degree. 

In summary, the short-term outlook for the NZDUSD pair, under the Elliott Wave perspective, foresees a downward move, which corresponds to a wave C of Minor degree. This potential next move may subdivide into a five-wave sequence. Once this corrective formation completes, the Kiwi should begin to develop a new upward impulsive sequence of upper degree coinciding with the long-term institutional bias.

Categories
Forex Elliott Wave Forex Market Analysis

Silver Unveils an Incomplete Corrective Structure

Overview

Silver price advances in an incomplete corrective structure that remains in progress, after the precious metal topped at its highest level since March 2013. The market sentiment continues dominated by the bullish side. Nevertheless, the incomplete Elliott wave structure suggests that the precious metal could see a new low.

Market Sentiment Overview

The Silver price continues fading from the yearly highs that carried the price toward annual highs at $29.85 per ounce in early August. However, the precious metal eases over 19% from the yearly high, Silver advances 35.2% (YTD).

The following daily chart displays the Silver’s 52-week high and low range. The figure highlights the consolidation of Silver below $25.30 per ounce and the price action running below the 60-day weighted moving average. This market context suggests that the precious metal traders downgraded their market sentiment from extremely bullish to bullish.

On the other hand, according to the Commitment of Traders report, it is observed that the big participants’ speculative net positions remain on the bullish side. In this context, the descents developed by precious metal suggest that market participants are involved in a take-profit activity and do not represent a change in the current upward trend.

Therefore, in the long-term overview, the market sentiment remains bullish. Nevertheless, in the short-term, the declines observed represent a taking profit activity. Finally, as long as there is no confirmation of new signs of a new rally, our bias remains on the neutral side.

Elliott Wave Outlook

The next chart illustrates Silver in its log-scale 8-hour timeframe, which reveals the price action is developing the last move of a cycle, which began on March 18th when the precious metal found fresh buyers at $11.61 per ounce. The incorporation of new buyers drove the precious metal to a bullish impulsive structure development completed on August 06th when Silver reached $29.86 per ounce.

Once Silver prices found resistance at $29.86, it completed a five-wave sequence of Minute degree identified in black. Simultaneously, according to the price fractality principle, Silver finished the first wave of Minor degree labeled in green.

According to the Elliott Wave Theory, once completed the five-wave impulsive sequence, the price reacts in the opposite direction developing a three-wave movement. From the previous chart, Silver reveals that its corrective structure is incomplete.

In particular, the precious metal advances in its wave ((c)) of Minute degree identified in black. In turn, the internal structure of the wave ((c)) has pending the bearish movement of the wave (v) of the Minuette degree identified in blue. The last move will likely re-test the descending channel’s base, dropping between $21.35 and $19.44 per ounce.

Once Silver completes the bearish five-wave sequence of wave ((c)), traders may start looking for positioning alternatives on the bullish side. Finally, considering that wave 1 of Minor degree presents an extended wave’s characteristics, wave 3 of the same degree should not be the largest wave of the impulsive sequence of Minor degree.

In short, Silver’s market sentiment remains on the bullish side; however, the price moves in an incomplete corrective structure that could lead to new price lows. Once the short-term bearish sequence is completed, Silver could start producing entry signals on the bullish side, corresponding to the primary trend.

Categories
Forex Market Analysis

US Dollar Index Consolidates Expecting Further Declines

Overview

The U.S. Dollar Index (DXY) develops a mid-term sideways formation inside a long-term bearish trend that looks incomplete. During this year, the Greenback sheds -4.31% (YTD). Although the positive inflation data expanded the price in Tuesday’s trading session, it was not enough to boost the price toward fresh highs.

Market Sentiment Overview

The U.S. Dollar Index (DXY) retreats 0.23% in Wednesday’s trading session by erasing the advance that the Greenback made on Tuesday, driven by inflation data, which exceeded surveyed analysts’ expectations reaching 1.4% (YoY).

Although the data released by the U.S. Bureau of Labor Statistics this Tuesday exceeded the expectations of market participants and Federal Reserve policymakers boosting the price to climb 0.53%, the reading observed would not have a greater impact on the rate decision of the next FOMC broad meeting. Still, it would be more focused on the evolution of the labor market.

The following chart illustrates the U.S. Dollar Index in its 12-hour timeframe. The figure exposes the 90-days high and low range, reflecting that the market participants’ sentiment remains on the extreme bearish side. The price action remains below the 200-period weighted moving average, confirming the bearish sentiment.

On the other hand, the last Commitment of Traders Report unveils institutional traders’ bearish bias, confirming the bearish sentiment exhibited by the U.S. Dollar Index.

Therefore, according to the Federal Reserve policymakers’ expectations, the labor market’s evolution could be a factor contributing to the U.S. Dollar Index volatility increase. On the other hand, as long as the price remains below 94.02 pts and below the 200-period average, the Greenback bias will remain on the extreme bearish side.

Technical Analysis Outlook

The U.S. Dollar Index, in its 4-hour chart, illustrates a sideways movement from a long-term bearish sequence, which seems to be incomplete. The mid-term sideways structure is limited by September 01st low of 91.75 pts, with a top of the sideways range at the level reached on September 25th, located at 94.74 pts.

The above figure shows that the mid-term trading range moves between 91.75 pts and 94.82 pts. This market context suggests that the currencies included in the U.S. Dollar Index basket might continue developing sideways movements in the coming trading sessions.

On the other hand, the Elliott Wave perspective overview reveals that the price developed a three-wave bullish movement from the September 01st low of 91.75 pts, which ended on 94.74 pts.

Currently, the DXY index develops a pause formation in a bearish sequence that could evolve in three waves. This consolidation structure identified as wave ((b)) in black is still in progress.

Accordingly, the U.S. Dollar Index should complete the consolidation movement identified by the short-term sideways channel before continuing with its mid-term bearish trend.

Categories
Forex Market Analysis

How Elliott Wave View of NASDAQ Anticipates Trump’s Coronavirus Outcome

Overview

The NASDAQ 100 Index fell 2.2 percent on Friday’s trading session on the news of the US President Donald Trump’s positive coronavirus test. Still, the price action unveiled the wave B completion, suggests further declines for the US technologic benchmark in the following trading sessions.

Market Sentiment Overview

During the last trading week, the NASDAQ 100 volatility has been driven by market participants’ expectations facing the first presidential debate between US President Donald Trump and former Vice President Joe Biden.

The advance experienced by the technology index was boosted by the expectation of new economic stimulus, driving the NASDAQ 100 to raise over 4%. However, its gains were lowered after the announcement of President Trump’s positive Coronavirus test, leading it to ease up to 2.74% on Friday’s trading session.

The following 8-hour chart of NASDAQ 100 reflects the 90 days high and low range. In the figure, we distinguish that the price halted its advance towards the extreme bullish sentiment zone, closing the trading week in the bullish market sentiment area and under the weighted 200-day moving average. This market context leads us to weight a neutral market sentiment.

On the other hand, the 12-hour chart corresponding to the NASDAQ 100 Volatility Index shows the 90 days high and low range where we distinguish a sideways movement consolidating above the 200-period weighted moving average. This volatility context of the NASDAQ 100 index, added to the new test of the upper-line of the consolidation structure, leads us to expect an increase in volatility within the coming trading sessions.

Summarizing, NASDAQ 100’s market sentiment unveils that this index and its volatility figures will be driven by the news on the upcoming presidential elections on Tuesday, November 03. In particular, NASDAQ 100 could turn bearish in the following trading sessions.

Elliott Wave Outlook

The overview of NASDAQ 100 shows the full development of a five-wave bullish sequence, which began on June 15, when the price found fresh buyers at 9,383.6 pts pushing the price towards new record highs September 02 at 12,466.6 pts. Once reached the all-time high, the technological index began to perform a bearish corrective movement, which remains in progress.

The following chart shows the NASDAQ 100 in its 4-hour timeframe, where we distinguish that the price has completed a five-wave impulsive structure of Minor degree labeled green. At the same time, we can confirm that the Elliott wave theory rule, stating that there must be only one extended wave. In this case, the NASDAQ 100 index developed a fifth extended wave that ended on September 02 when the price found resistance at 12,466.6 pts. Once the fifth wave of Minor degree concluded, the NASDAQ 100 began performing a corrective sequence, which remains in progress.

In particular, the completion of the wave ((c)) of Minute degree identified in black, which completed the wave B of Minor degree, coincided with the news media release concerning the US President Trump’s positive test, activating the beginning of the wave C, labeled in green.

The following hourly chart of NASDAQ 100 illustrates the first bearish movement’s internal structure corresponding to its wave (i) of the Minuette degree identified in blue. This first downward wave reveals a drop in five moves of Subminuette degree identified in green in its internal formation. Once this second move has been completed, the technological benchmark should resume its declines.

Finally, considering that wave (i) of Minuette degree completed its descending move at 11,220.8 pts on Friday 02nd, the price could retrace, forming its second wave of the same degree. In terms of the Dow Theory, this retrace could be between 33% and 66%, or between the 11,352.3 pts and 11,483.7 pts, where NASDAQ 100 might start to develop a new decline, corresponding to wave (iii) in blue.

Categories
Forex Market Analysis

DAX 30 Unveils Exhaustion Signals

Overview

The German DAX 30 index, which groups together the 30 most capitalized companies in Germany, shows signs of exhaustion after the rally it developed since the second half of March this year. Likewise, the Elliott wave theory’s perspective reflects the exhaustion of the bullish impulsive movement, which may be advancing in the last impulsive wave of Primary degree.

Market Sentiment Overview

The German benchmark DAX 30 shows a pause in its upward trend, consolidating the rebound that the price has been developing since March 19th when the German index found support in the yearly low located at 7,957.6 pts. Since this bottom zone, DAX 30 has advanced over 60% to date; however, this year the benchmark eases over 2.75% (YTD).

The following daily chart of the German index shows the price action running in the zone of extreme bullish sentiment. However, the shift in price below the 60-day weighted moving average reveals that it could be starting to develop a new short-term corrective process. 

Although the DAX 30 remains in the zone of extreme bullish sentiment, our market bias continues being neutral as long as the likely corrective movement is not confirmed.

Elliott Wave Outlook

The DAX 30 index overview shows a bullish impulsive sequence that looks incomplete. This five-wave structural series that began in early March 2009 currently moves in a consolidation phase, showing exhaustion signals.

In its log-scale weekly chart, the DAX 30 reveals the price moving in a possible fifth bullish wave of Primary degree identified in black. At the same time, we note that the German benchmark had developed a third wave extended of Primary degree.

According to Elliott wave theory, in an impulsive structure, there can only be one extended wave. In this context, and based on the price development formed by DAX 30, we can recognize the movement of five internal impulsive waves of Intermediate degree labeled in blue within the third wave of Primary degree. This bullish movement ended in the second half of January 2018 when DAX climbed until 13,602 pts.

On the other hand, the alternation principle between corrective waves is recognized to happen between the second and fourth waves. While the second wave performed a corrective movement that took 133 days, the fourth wave was developed in 784 days.

As for the fifth wave’s potential completion, there is still no evidence to confirm this completion. On the one hand, according to Elliott wave theory, when in an impulsive sequence, the third wave is extended, it is highly likely that the fifth wave will fail in its attempt to reach new peaks.

On the other hand, we recognize that there is no confirmation of the fulfillment of the criterion of similarity in price, time, or both between the first and fifth wave. In other words, while the first wave advanced 4,024 pts in just over two years, the fifth wave, which started in the second half of March 2020,  has grown about 5,500 pts in barely six months.

To conclude, the overall market sentiment seems to have shifted from the extreme bullish to neutral. Furthermore, the market structure shows the progress fifth wave of Primary degree progress, giving exhaustion signals. Thus, our bias for the German DAX 30 index continues being neutral.

Categories
Forex Market Analysis

Dow Jones Moves Under Bearish Signals

Overview

The Dow Jones Industrial Average is developing a descending sequence that could drive the price to new lower lows. This bearish context occurs in the middle of the US presidential elections campaign, which will take place on November 03rd.

Market Sentiment Overview

The United States benchmark, led by the Dow Jones index, appears to be preparing for the presidential elections on November 3.

The short-term market sentiment exposed in the following 8-hour chart illustrates the price shift below the 200-day weighted moving average, which has turned from support to the next short-term resistance to struggle with.

On the other hand, we observe the 90-day high and low range, where the Industrial Average Index has found support in the neutral zone at over the 26,700 pts, where it bounced, being traded slightly bullish during the last Friday 25th session. This context, added to the shifting movement of the price and against its 200-day moving average, leads us to suspect that the Dow Jones Index could see a further drop within the next few sessions.

Concerning the volatility associated with the Industrial Average, expressed by the Dow Jones Volatility Index (VXD) on its daily chart, we distinguish that the action consolidates above the 60-day moving average. Likewise, VXD shows an increasing sequence of short-term lows, which provides a chance of a new bullish movement of the VXD in the short term.

In consequence, the market context leads us to expect a potential bearish movement for the Industrial Average. However, this scenario still needs to be confirmed by the price action.

Technical Analysis Outlook

From a technical analysis perspective, the Dow Jones Index in its 4-hour chart is showing a descending sequence that began once the price found resistance at 29,193.6 pts on September 03rd. Once the Industrial Average found fresh sellers, the downward pressure drove the price to a retracement till the 26,541 level, where the leading US benchmark found support and began to bounce back to the current trading levels.

On the other hand, in the previous figure, we distinguish the progress of a head and shoulders pattern, which has its neckline at the level of 27,457.5. The bearish breakdown developed during the September 21st trading session, and its subsequent pullback confirmed the bearish signal in the Industrial Average. In this regard, according to the head and shoulder pattern definition, this trend reversal formation has a pending bearish target located at 25,724 pts.

Similarly, if the price confirms a new lower high under the previous peak at 28,370.8 pts, it would confirm a bearish continuation pattern identified as three descending peaks, which would support the bearish scenario for Dow Jones.

In conclusion, our short-term perspective is mainly bearish as long as the price remains below 28,370.8 pts, with a bearish target established at 25,724 pts. The invalidation of our bearish scenario will occur if the Industrial Average consolidates above 28,370.8 pts.


Categories
Forex Market Analysis

Gold Still Under Bearish Pressure

Overview

Gold price eases over 4% during this week, dragged by the U.S. Dollar strength, which rallies nearly 1.5%. Considering the short-term structure observed on both the market sentiment and the Elliott wave outlook, the precious metal could experience further declines during the coming trading sessions.

Market Sentiment Overview

The price of Gold continues being dominated by selling pressure this week, driven by the U.S. Dollar strength, accumulating losses of over 4% in the week. However, during this year, the precious metal has advanced over 24% (YTD). 

The market sentiment shown in the weekly chart reveals a decrease in the bullish bias of market participants, who have shifted from extreme bullish sentiment until the past week to a bullish bias. Likewise, considering that the price action continues above the 26-week moving average, the mid-term trend continues being bullish.

Likewise, the wide-range weekly candle, still in progress, reveals the current control by the bearish-side participants. However, the rebound at $1,848.84 per ounce developed during the trading session on Thursday 24th, leads us to observe that the yellow metal could have found a short-term support level.

On the other hand, according to the latest reading unveiled in the Commitment of Traders Report, where the speculative net positioning reached 240,977 positions, reveals that the big participants still maintain their bias on the bullish side. Consequently, a massive sell-off could correspond mainly to the take-profit activity rather than to a reversal of the upward trend.

The volatility presented in the following daily chart corresponds to the Gold Volatility Index (GVZ) and shows the movement consolidating into a flag pattern. At the same time, the internal structure reveals an upward pressure, which is confirmed by its last close above the 60-day moving average. This the market context leads us to expect new increments in the precious metal volatility, and with it, further declines in the price of gold.

Under the market sentiment perspective, the big picture of the precious metal reveals that the long-term trend remains mostly bullish. However, the short-term bias suggests further declines.

Elliott Wave Outlook

The gold price on its 4-hour chart shows the progress of a corrective sequence, which began on August 06th when the price reached its all-time high at $2,075.14 per ounce. Once this record high was reached, the precious metal found sellers which currently are maintaining the price under pressure.

As said, after Gold was controlled by the sellers, the price began a corrective structure made by three waves of Minuette degree labeled in blue, which is currently developing its wave (c). In the figure, we distinguish that once the price closed below the base-line b-d of the triangle pattern, the yellow metal confirmed this wave (c) that remains in progress. The internal structure of the wave (c) unveils that Gold advances in its third wave of Subminuette degree identified in green.

According to the Elliott wave theory, the wave (c) follows an internal structure formed by five segments. In the previous chart, we see that the price moves in its wave iii labeled in green. Consequently, the precious metal should develop a consolidation sequence before dropping to a new lower low with a potential target zone between $1,802.56 and $1,744.76 per ounce.

Finally, the invalidation level of the current bearish scenario locates at $1,973.43 per ounce.

Categories
Forex Market Analysis

Russell 2000 Resume its Advances

Overview

Russell 2000 advances on the first trading session of the week, reporting gains over 2.6%. The market sentiment reveals to us the penetration in the extreme bullish sentiment zone, supporting the possibility of fresh upsides. In this regard, the Elliott Wave structure exposes an incomplete bullish structure supporting the likelihood of further rises.

Market Sentiment Overview

Russell 2000 advances over 2.6% in the first session of the week, easing the bearish sentiment that dominated the previous two weeks sell-off in where the U.S. index that groups to the 2,000 small capitalized companies plummeted over 5%.

The big picture of Russell 2000 exposes a divergence with the S&P 500. From the following weekly chart, we distinguish to Russell 2000 without confirming the S&P 500 record high at 3,588.8 pts reached on September 02nd. According to the Dow Theory, the fresh highs must be confirmed, and divergence must be considered an exhaustion or reversal signal of the current bull market. In this case, Russell 2000 remains without confirming the last record high reached by the S&P 500.

Although both indices move above the 26-week moving average, indicating the upward bias on the stock market, the S&P 500 remains moving in the extreme bullish sentiment zone while the Russell 2000 looks bouncing toward the extreme bullish sentiment zone. This market context carries us to expect for Russell 2000 the possibility that the price visits fresh highs, even surpassing the 1,600 pts.

The next daily chart of Russell 2000 unveils the price action bouncing from last July’s previous consolidation zone. The bullish reaction developed by the Russell leads us to foresee further upsides in the following trading sessions.

Simultaneously, the Fear & Greed index looks moving below level 50, which corresponds to the “fear zone.” This lecture added to the bearish sentiment of news media, leads us to expect a bullish reversal move.

Regarding the volatility side, the Russell 2000 Volatility Index reveals the extreme bearish sentiment zone penetration. This decline confirms the possibility of further declines to the area between 25.82 to 20.35, from where the price could find support.


In consequence, considering the penetration to the extreme bullish sentiment zone of Russell 2000 and the lowest level observed in the Russell 2000 Volatility Index, we expect fresh upsides in the U.S. stock market.

Elliott Wave Outlook

The short-term outlook under the Elliott wave perspective of Russell 2000 illustrates the advance on an incomplete five-wave sequence, which began on July 10th when the U.S. index found fresh buyers at 1,376.67 pts, starting the current bullish cycle that remains in progress.

From the 4-hour chart, we distinguish the completion of the second wave of Subminuette degree labeled in green. According to the Elliott wave theory, the canalization with its base-line from the end of wave (b) of Minuette degree identified in blue as the origin to wave ii in green and projected until the end of the first wave of the same degree should provide the target of the third wave. In this context, the potential third wave could advance to 1,617.06 and extend 1,707.29 pts.

Finally, the bullish bias confirmation will occur if the price closes above the last intraday descending trendline. At the same time, the current upward scenario will remain active while the Russell 2000 index keeps moving above 1,452.24 pts.


Categories
Forex Market Analysis

DAX Advances in an Ending Diagonal Pattern

Overview

The German benchmark index, DAX 30 advances in the extreme bullish sentiment zone accumulating gains over 60% after the German index gained support on the March’s low at 7,957.6 pts. In spite of the up-up-up market sentiment, the DAX develops an ending diagonal pattern that is still unfinished, suggesting the current upward trend’s exhaustion.

Market Sentiment Overview

DAX 30 continues its recovery following the German index drop to 7,957.6 pts, on March 23rd, which is the lowest level since late August 2013. From Mach’s low, DAX 30 advances over 60%.

The next DAX chart presents the German index in its daily timeframe illustrates the 52-week high and low range. The German index currently develops an upward movement in the extreme bullish sentiment zone. The short-term bullish sentiment is being confirmed by the 60-day moving average, which acts as support in the latest trading sessions.

The extreme bullish sentiment aided by the DAX surpassing the opening price of the year boosted the up-up-up sentiment in the news media added with the incomplete ascending wedge that remains in progress. These signals suggest the exhaustion of the current short-term bullish trend.

On the other hand, the daily chart of the DAX Volatility Index (VDAX) shows a mostly sideways movement in the extreme bearish zone. At the same time, the lateral consolidation pattern developed by VDAX, which remains unfinished, could experience a new decline raising the possibility of further upside in the German stock market.

Consequently, the German stock market sentiment is being dominated by extreme bullish bias. However, the incomplete ascending wedge pattern suggests the exhaustion of the upward movement.

Elliott Wave Outlook

The short-term outlook of the German stock market under the Elliott Wave perspective unveils the progress on an incomplete ending diagonal pattern, developing a new upward movement.

The DAX, in its 4-hour chart, exposes the progress of an upward corrective formation that follows an internal structure of a zigzag pattern of Minute degree labeled in back. The bullish move began in the March low when the German stock market plummeted until 7,957.6 pts. 

Currently, DAX advances in its fifth wave of Minuette degree labeled in blue, which, in turn, develops an ending diagonal pattern in its internal structure. This terminal formation, subdivided in a 3-3-3-3-3 sequence of Subminuette degree, identified in green, is seen advancing in its fifth wave. This pending upward movement agrees with the likely decline in the DAX Volatility Index.

Consequently, according to the Elliott wave perspective, our short-term outlook anticipates further upsides as long as the price stays above 12,737.5 pts. This potential upside could strike the 13,544.3 pts completing the wave ((c)) of Minute degree identified in black.

Categories
Forex Elliott Wave Forex Market Analysis Forex Technical Analysis

Gold Continues its Triangle-Pattern Consolidation

Overview

Gold continues on the fifth consecutive week of consolidation. The pattern is developing a contracting triangle which remains incomplete. The internal structure observed in this consolidation pattern suggests a limited upside before completing the corrective formation in progress.

Market Sentiment Overview

The price of Gold continues moving sideways by the fifth week in a row, testing the support on the extreme bullish sentiment zone of the 52-week high and low range. Although the precious metal eases 7.5% from its all-time high at $2,075.14 per ounce to date, the yellow metal report gains over 27.7% (YTD).

The following chart presents the yellow metal in its weekly timeframe. In it we distinguish the price movement testing the extreme bullish zone support located at $1,917.81 per ounce. This market condition leads us to expect a new decline for the coming trading sessions, finding support in the 26-week moving average, which currently moves in the $1,850.10 per ounce.

The potential decline in Gold’s price is backed by the strength of the U.S. Dollar Index, shown in the next intraday chart. In the figure, we observe the Greenback showing recovery signals moving above the 120-hour moving average.

On the other hand, the Gold Volatility index continues consolidating in a flag pattern. As discussed in our previous analysis, the current sideways movement, in progress, converges with gold’s consolidating formation, suggesting a new decline in the valuation of the precious metal.

Summarizing, the market sentiment for the yellow metal reveals the exhaustion of the extreme bullish sentiment that dominated the market participants’ activity until early August when the yellow metal reached its record high at $2,075.14 per ounce. At the same time, the recovery signals unveiled by the U.S. Dollar Index lead us to expect further declines in the precious metal.

Elliott Wave Outlook

The short-term Elliott Wave perspective for the yellow metal illustrated in the following hourly chart reveals a consolidation formation identified as an incomplete contracting triangle pattern.

In the hourly chart, we recognize the price action advancing in an incomplete corrective structural series, which began after the yellow metal topped at $2,075.14 per ounce from where the golden metal started to find sellers. The first decline corresponding to wave (a) of Minuette degree identified in blue found support at $1,832.62 per ounce. This bearish aggressively-looking leg alternates with wave (b), which still remains in progress.

The incomplete wave (b) in progress follows the internal sequence of a contracting triangle pattern, which currently ended its wave d of Subminuette degree labeled in green. According to the Elliott wave theory, the price should develop a marginal advance completing a wave e, in green, before continuing its bearish path. The limited upward move expected corresponds with the potential decline foreseen in the Gold Volatility Index, which shows a consolidation in the form of a flag pattern.

Categories
Forex Market Analysis

Dow Jones Declines Below an Ending Diagonal Pattern

Overview

The Dow Jones Industrial Average stopped its progress that started on the March 23rd’s low at 18,213.5 pts, from which it proceeded toward the 29,193.6 pts, reached on September 03rd. This movement made it recover its yearly losses that happened in the first quarter of 2020. The latest decline observed following the ending-diagonal breakdown leads us to warn about a likely bearish scenario.

Market Sentiment Overview

The Dow Jones Industrial Average stopped its advance from the mentioned recovery in our previous analysis. In our previous outlook, we commented about the divergence between the S&P 500 and the Industrial Average, which still did not reach a fresh record high as the S&P 500 did. As the following figure illustrates, the divergence observed between the two U.S. indices drives us to the conclusion that the last all-time high reached by the S&P 500 remains without confirmation by the Dow Jones. This situation carries us to expect the exhaustion of the current stock market recovery.


The next chart illustrates the Industrial Average in its daily timeframe. In the figure, we distinguish the market action moving on an extreme bullish sentiment zone, confirmed by its price action above the 60-day moving average. However, the latest sell-off negated the strike of the opening 2020 price easing near to 1.75% (YTD).

The breakdown observed in the Fear and Greed Index highlighted in yellow, signal the decline of the bullish sentiment prevailing during the previous stock market sessions. This reading adds to the context observed in the Dow Jones Volatility Index daily chart, which remains well in the bearish sentiment zone – above the 60-day moving average. This leads us to suspect that the recovery observed in the stock market is ending.

In consequence, from a market sentiment perspective, our position for the Dow Jones changes from bullish to neutral expecting the bullish continuation or bearish reversal confirmation.

Elliott Wave Outlook

Under the mid-term Elliott Wave perspective, the Industrial Average in its 4-hour chart reveals the completion on September 03rd of the fifth wave of Minuette degree labeled in blue, as the price topped at 29,193.6 pts., where Dow Jones found fresh sellers.

The last Dow Jones rally observed in the previous chart, developed in five waves, illustrates an ending diagonal pattern, which, after the price broke and closed below the line (ii)-((iv), dropped until the wave (iii) in blue. This movement leads us to expect further corrections in the U.S. stock market.

Simultaneously, the completion of the wave ((c)) of Minute degree in black and wave B of Minor degree in green points us to anticipate the development of a regular flat pattern, which follows a 3-3-5 structural sequence. In this context, Dow Jones might start to develop a new decline into five waves.

Finally, our central perspective for the Industrial Average remains neutral, expecting additional confirmation signals for the next movement. If the price action confirms a bearish continuation, the Dow Jones index could find support in 21,000 pts.

Categories
Forex Market Analysis

Gold Still Controlled by the Bull

Overview

The Gold price continues developing a sideways movement, which corresponds to an incomplete corrective structure that is still incomplete. Although there is an extreme bullish sentiment among market participants, the price of the golden metal could be poised to a decline in the following trading sessions.

Market Sentiment Overview

Gold prices continue moving sideways, consolidating above the psychological barrier of $1,900. The precious metal gains of over 28% (YTD) were boosted by the US Dollar weakness, which has dropped 5.47% (YTD) so far.

Gold, in its weekly timeframe, illustrates the market sentiment of the precious metal exposed by its 52-week high and low range. In the chart, we currently distinguish the market action moving mostly sideways, on the extreme bullish sentiment zone. The indecision candle that the yellow metal developed leads us to observe a state of equilibrium between the market participants.

On the other hand, looking at the volatility of the precious metal (GVZ) exposed in its daily chart, we observe the price action is consolidating in a flag pattern in the bearish sentiment zone. At the same time, we highlight the bounce GVZ developed from the extreme bearish sentiment zone toward the bearish zone in which currently is consolidating. We see that GVZ, moving above its 60-day moving average, shows an improvement in the investors’ sentiment.

The current market context observed in the Gold Volatility Index, which is consolidating creating a flag formation, added to Gold’s retesting of  $1,917.81 per ounce, corresponding to the support of the extreme bullish sentiment zone, leads us to expect a new decline in the price of the yellow metal.

Elliott Wave Outlook

The short-term outlook under the Elliott wave perspective and illustrated in its 2-hour chart exposes the sideways movement evolving an incomplete corrective structure, after the yellow metal touched its all-time high at $2,075.14 per ounce, reached on August 06th.

Once the precious metal topped at $2,075.15 per ounce, Gold completed its fifth wave of Minuette degree, and it is drawing a corrective sequence that remains incomplete. In the previous figure, we distinguish the aggressively developed first downward leg. This fast movement drove the yellow metal to ease over 10%, finding a bottom at $1,862.32 per ounce. That gave the pass to the wave (b), identified in blue, which remains in development.

The second leg of the incomplete three-wave sequence completed its first wave of a lesser degree at $2,015.65 per ounce, starting to retrace with a lower momentum. This decelerated movement observed in the wave b of Subminuette degree, identified in green, drives us to verify the alternation principle stating that a fast move should alternate with a slow movement.

For the coming trading sessions, we expect an upward movement that would complete the wave c of Subminuette degree, in green, which at the same time would end the wave (b) in blue. Once this wave ends, the price should start to decline in a five-wave sequence corresponding to wave (c) of Minuette degree, labeled in blue. This downward scenario agrees with the potential upside observed in the Gold Volatility Index chart.

Categories
Forex Elliott Wave Forex Market Analysis

Dow Jones: Still no New Record High Confirmation

Overview

The Dow Jones Industrial Average continues its advances toward the green side. During this year, it is still easing 1.08% (YTD). The DJIA index, which groups to the 30 largest capitalized U.S. companies, move in the extreme bullish sentiment zone unveiling the probability of new record highs in the U.S. stock market. Likely, it could find resistance at the 30,000 pts as a psychological barrier confirming the all-time highs observed both S&P 500 and NASDAQ 100.

Market Sentiment Overview

During this year, the Dow Jones Industrial Average eases 1.08% (YTD), returning from the bear market to bull market side. The recovery experienced by the Industrial Average, carried it to jump from the lowest level of the year at 18,213.5 pts to 28,287 pts gaining over 55%. 

The following figure compares the advance of Dow Jones and the S&P 500 in its weekly timeframe. In these two charts, we observe that both indexes move in the extreme bullish sentiment zone. However, although surprising, the recovery observed in the U.S. stock market, the Industrial Average still doesn’t confirm the all-time high of the S&P 500, reached on the latest trading sessions

If we look at the Dow Jones’ volatility (VXD), it is running below the 60-day moving average, which confirms that the market sentiment continues being in favor of fresh upsides on the Industrial Average.

Finally, considering that both NASDAQ 100 and S&P 500 reached fresh all-time highs in the latest sessions, the Dow Jones should follow the same path in the coming trading sessions.

Elliott Wave Outlook

The mid-term outlook for the Industrial Average provided by the Elliott Wave Analysis reveals the bullish continuation of the incomplete wave B of Minor degree labeled in green, which could push it toward new all-time highs.

The next 4-hour chart illustrates the price running in an uptrend that began on March 23rd when the U.S. Blue Chip index found fresh buyers at 18,213.5 pts, developing a corrective structural sequence that remains incomplete.

Once the Industrial Average broke upward the (b)-(d) upper-line of the triangle drawn by the wave ((b)) of Minor degree, the price activated its progression as wave ((c)), which is characterized by the inclusion of five internal waves. 

Currently, Dow Jones continues its development in an incomplete wave (iii) of the Minuette degree labeled in blue. Simultaneously, the bullish trendline looks intact, which leads us to conclude that the uptrend remains sound, calling for more upsides in the following trading sessions.

Finally, considering that both the S&P 500 and NASDAQ 100 reached new record highs, we expect further upsides and record highs on Dow Jones. A potential target could be at 30,000 pts as this psychological barrier will be a natural profit-taking level.

Categories
Forex Market Analysis

Russell 2000 in Consolidation, Expecting for More Upsides

Overview

The Russell 2000 Index raised over 64% off its lowest level of the year, advancing from the extreme bearish to the extreme bullish sentiment zone. The incomplete complex corrective structure, still in progress, calls for more upsides in the coming trading sessions.

Market Sentiment Overview

This year, the Russell 2000 index is underperforming by 6.24% (YTD); however, it continues its recovery from the first quarter massive sell-off, when the U.S. index plummeted until its lowest level of the year at 953.77 pts, currently advancing 64.38% off its lows. 

The Russell 2000’s daily chart shows it’s moving inside the 52-week high-low range, exposing the development of a consolidation formation in the extreme bullish sentiment zone. Simultaneously, the 71-point reading observed in the fear and greed index reveals a bullish bias, helping support the upward bias that now prevails on the Russell 2000 Index. 

On the other hand, Russell 2000’s volatility index shows it’s moving in the extreme bearish sentiment zone, which increases the bullish perspective for the U.S index grouping the 2,000 small-cap U.S. companies.

Consequently, both the market structure consolidating in the extreme bullish sentiment zone and the decreasing volatility observed, lead us to expect further upsides for the following trading sessions, which could make it advance till its opening level of the year, at 1,672 pts.

Elliott Wave Outlook

The short-term overview under the Elliott wave perspective is shown in its 4-hour chart, which reveals the structure of a bullish sequence that remains intact since March 23rd when Russell 2000 found fresh buyers at 963.62 pts.

In the previous chart, we distinguish Russell 2000’s upward progression, moving in a complex corrective formation identified as a double three pattern (3-3-3) of Minute degree, marked in black, which belongs to a wave B of Minor degree labeled in green. 

The complexity level in the corrective sequence could be understood under the alternation principle context. Observing the first chart and considering the aggressive sell-off, lasting about in one month (since mid-February till mid-March), the alternation principle states that after a high-momentum level movement, a reduced-momentum move comes next, and vice versa.

Currently, Russell 2000 advances in wave (c) of Minuette degree, which began on July 10th when the U.S. index ended the wave e of the triangle pattern corresponding to wave (b) in blue. Once wave (b) was completed, the market participants pushed prices higher, carrying it till the 1,608 level on August 11th after the Russell 2000 Index found stiff resistance, which ended wave iii of Subminuette degree identified in green.

Consequently, we expect a limited sideways movement during the following trading sessions before continuing its advance toward fresh highs. Russell’s next upward movement could boost it to the 1,702.17 level, to test last February’s highs.

Categories
Forex Market Analysis

NIFTY 50 Rallies with Extreme Bullish Sentiment

Overview

The Indian benchmark NIFTY50 index that groups the 50 largest capitalized companies of the Indian stock market loses over 6.6% during 2020. However, since March’s low at 7,511.10 pts, NIFTY 50 recovers over 51% and could visit the 12,000 pts in the following trading sessions.

Market Sentiment Overview

The Indian stock market led by the NIFTY 50 index underperforms 6.69% (YTD), recovering its losses from the massive sell-off starting last February, which dragged it to lose over 38% mid-March when the price found support at 7,511.10 pts. Once the Indian index found support, the price began to recover from its declines advancing over 51% to date.

The following chart exposes to NIFTY 50 in its daily timeframe moving above the 11,200.65 pts corresponding to the zone of extreme bullish sentiment. At the same time, from the figure, we distinguish the Indian benchmark moving above the 200-day and 60-day moving average, confirming us the bullish bias of NIFTY 50.

Considering that the extreme bullish sentiment prevails in the NIFTY 50 index, the price could advance toward the 12,000 pts as a psychological barrier, which coincides with a previous consolidation zone.

Elliott Wave Outlook

The big picture of NIFTY 50 under the Elliott wave perspective unveiled in the 2-week chart and log scale, exposes the advance of the Indian stock market in the fourth wave of Primary degree labeled in black. Once the price reached its all-time high at 12,430.50 pts in January 2020, completing its wave ((3)) of Primary degree began.

From the chart, we observe some extended waves developed by NIFTY 50 in each impulsive movement identified with ellipses. In the first wave of Primary degree, in its internal structure, the third wave corresponds to the extended wave. While in the third wave of Primary degree, watching inside of the fifth wave of Minor degree labeled in green, which belongs to the third wave of Intermediate degree in blue, corresponds to the extended wave. 

Finally, in the fifth wave of Intermediate degree, we recognize the first wave of Minor degree as the extended wave. In this context, the fifth wave of Intermediate degree could be confused with an ending diagonal pattern. Although the ending diagonal pattern tends to appear in a fifth wave or wave c, this case does not correspond to an ending diagonal pattern.

On the other hand, considering the previous corrective formations that look like a three-wave structural sequence, the current fourth wave of Primary degree could be a complex formation as a triangle pattern, which holds a 3-3-3-3-3 series. Under this scenario, our short-term outlook for the Indian benchmark foresees the bullish continuation, which could surpass the last all-time high at 12,430.50 pts. 

Once the price completes its wave (B) of Intermediate degree in blue, the Indian stock market could develop a sideways movement forming a potential triangle pattern. Once the corrective formation in progress ended, NIFTY 50 could resume its advances developing a wave ((5)) in black, which could see fresh all-time highs.


Categories
Forex Market Analysis

CAC 40 Advances in a 20-Year Triangle

Overview

The French index CAC 40 develops an incomplete triangle pattern that began in late August 2000. This year, CAC 40 underperforms 17.51% (YTD), recovering from the losses that dragged it to plunge until 3,632.1 pts, losing over 39.6%. The long-term outlook leads us to foresee a potential limited upside before to resume its drops corresponding to the incomplete bearish sequence in progress.

Market Sentiment Overview

The CAC 40 index, in its daily chart, unveils the advance mostly sideways since the price found resistance in the June’s high located at 5,213.7 pts. The current trading zone coincides with the mid-region of the 52-week high and low range, which leads us to observe that the market sentiment remains with a weak bullish sentiment. At the same time, we distinguish the French Index moving between the 60-day and 200-day moving average, which confirms the consolidation sequence that the French index remains in progress.

Nevertheless, considering that CAC 40 underperforms 17.51% (YTD), we observe that the Fresh index remains under bearish pressure, on the other the consolidation above the 4,871.7 pts., that corresponds to the 50% of the 52-week high and low range, the sideways formation could drive to CAC 40 to develop a limited upside before to resume a new decline.

Elliott Wave Outlook

The French stock market tracked by the CAC 40 index moves in a triangle pattern that began in late August 2000 when the market participants carried up the price until its record high at 6,944.8 pts. Once the price found resistance below the 7,000 pts, the French index started to move sideways, developing a triangle formation that remains incomplete.

The next figure illustrates to CAC 40, in its 2-week chart and log scale, under the Elliott wave perspective. The French index develops an incomplete triangle pattern (3-3-3-3-3), which moves in wave ((4)) of Primary degree identified in black.

The corrective structural series that remains in progress since the French index topped at 6,944.8 pts in late August 2020, currently develops its wave (E) of Intermediate degree identified in blue. Simultaneously, according to the Elliott wave theory, wave (E) must have three internal segments. In this context, from the figure, we distinguish that the price action completed the first bearish leg corresponding to wave A of Minor degree identified in green, which found a bottom at 3,632.1 pts on last March from where the price started to bounce, developing the wave B that remains in progress.

Currently, CAC 40 advances in its wave B of Minor degree labeled in green. Once completed this internal leg, the French index should resume its declines, with a possible support level located at 3,600 pts, even if it could extend until 2,957 pts.

Finally, once completed the long-term corrective sequence corresponding to wave ((4)), CAC 40 should start a new long-term rally corresponding to the fifth wave of Primary degree.