The US Dollar Index reveals exhaustion signals of its bearish trend. A trend that remains in progress since the currency basket topped at 102.992 pm mid-March 2020. Follow with us what signs show the Greenback to expect a rally during the first quarter of the year.
Technical Overview
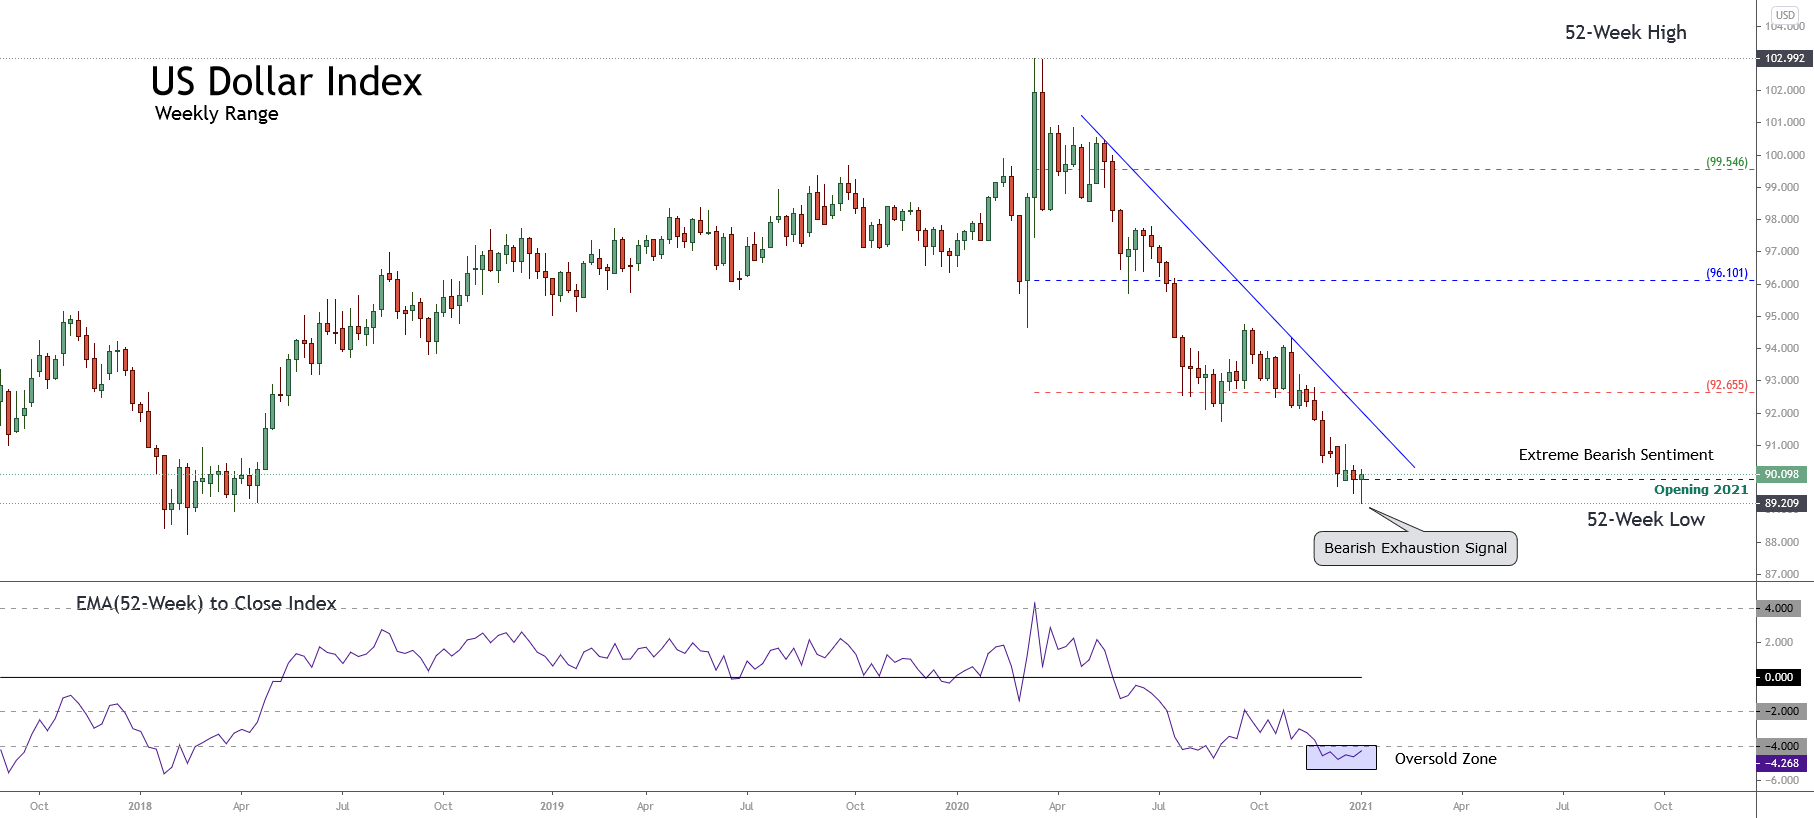
The big picture of the US Dollar Index (DXY) illustrated in the next weekly chart reveals the downtrend that remains active since the price found fresh sellers at 102.992 in mid-March 2020. The following figure also exposes the market participants’ sentiment represented by the 52-week high and low range.
The previous figure shows the extreme bearish sentiment dominating the big participants’ bias since mid-March 2020. Nevertheless, the long-tailed candlestick corresponding to the last trading week that was closed above the yearly opening, suggests the bearish trend’s exhaustion in progress.
On the other hand, the reading -4.26 observed in the EMA(52) to Close Index suggests the currency basket is oversold; thus, a potential corrective rally could occur in the coming weeks.
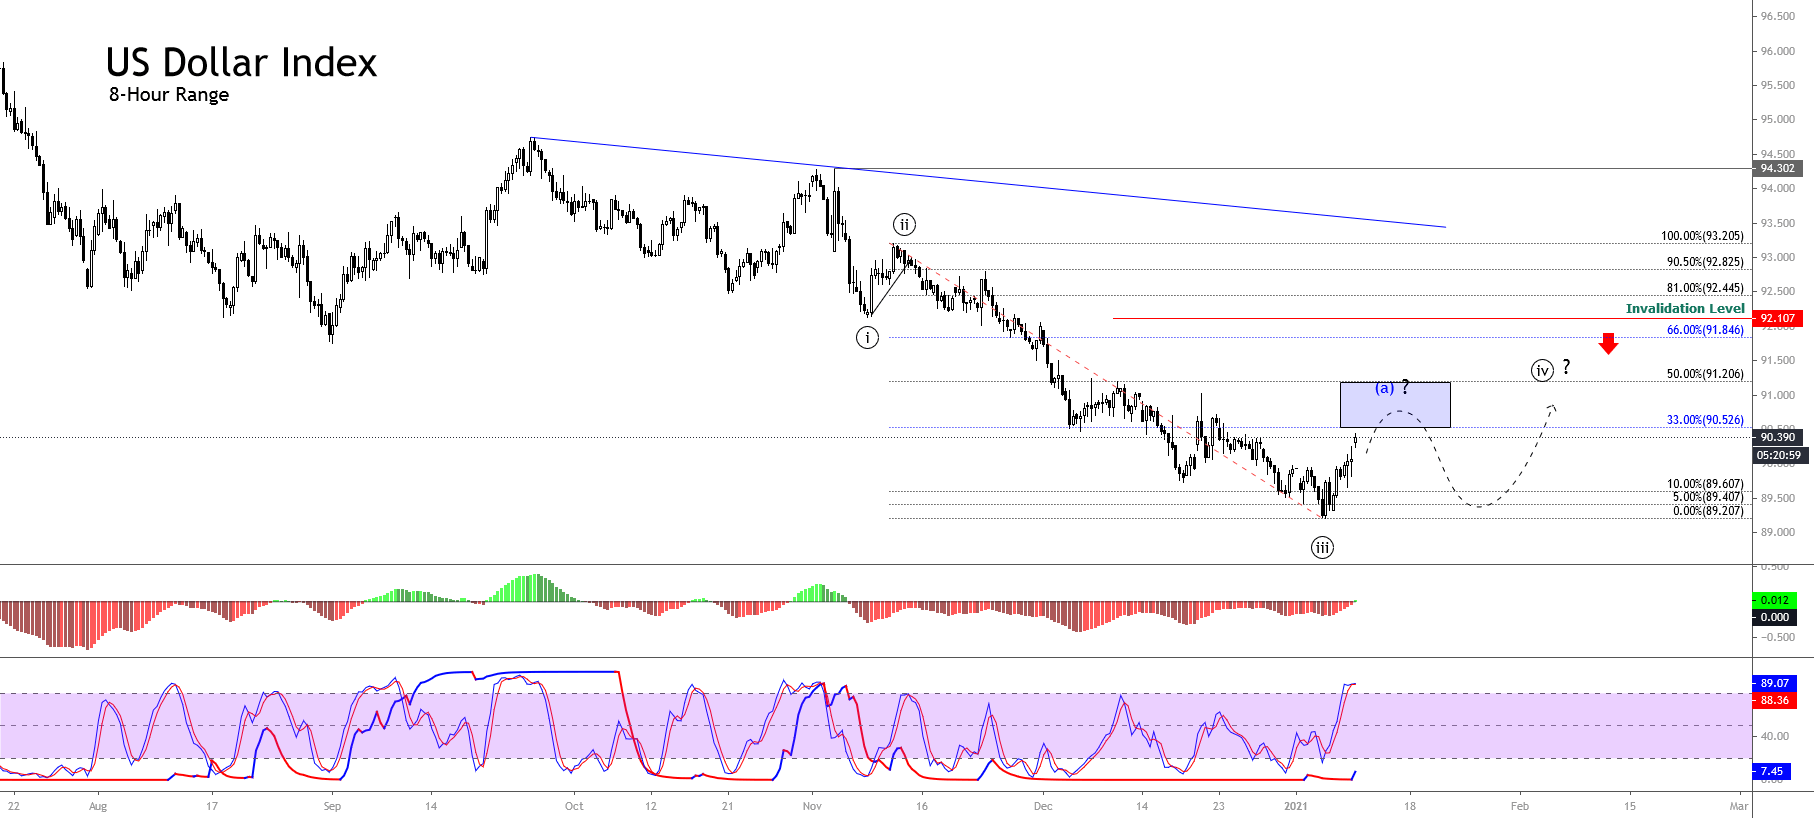
The mid-term Elliott wave view of the US Dollar Index exposed in the next 8-hour chart suggests completing an extended third wave of Minute degree labeled in black, when the price found support at 89.209 on January 06th.
Once the price found support, the price started to bounce, developing an incomplete wave (a) of Minuette degree identified in blue, which belongs to wave ((iv)) in black. Finally, the momentum and timing oscillator suggests that the bearish pressure persists, and the current upward movement could correspond to a corrective rally.
Technical Outlook
The mid-term outlook for the US Dollar Index unfolded in the next 8-hour chart shows the incomplete wave ((iv)) in black, which advances in wave (a) identified in blue. In this context, the current climb experienced by the Greenback could be a corrective rally.
According to Elliott Wave theory, the fourth wave in progress could retrace to 50% of wave ((iii)), and reach 91.205. Likewise, considering that the second wave was a simple correction in terms of price and time, the current fourth wave should be complex in terms of price, time, or both.
On the other hand, if the price extends beyond 50%, this could indicate weakness in the bearish pressure. If the price action advances above 92.107, the bearish scenario will be invalidated leading us to expect more upward movement.
In summary
The US Dollar Index completed a bearish third wave of Minute degree at 89.209 on January 06th, when it began to bounce, starting an upward corrective rally that remains in progress. The current intraday movement could reach 91.206 where the price could complete its wave (a) of Minuette degree labeled in blue. On the other hand, considering the alternation principle, the current corrective formation, the structure should be complex in terms of price, time, or both. Finally, the bearish scenario’s invalidation level locates at 92.107, corresponding to the end of wave ((i)) in black.


