The EURAUD cross is advancing in its incomplete third wave from a mid-term downward sequence that remains in play. Follow with us on what the Elliott wave theory tells about its next movement.
Technical Overview
The big picture of the EURAUD cross unveiled in the following 12-hour chart exposes the price action moving in the extreme bearish sentiment zone during the second week of the year. However, both the acceleration and oversold could suggest the exhaustion of the bear market.
The following 12-hour chart exposes the market participants’ sentiment, unfolded by the 90-day high and low range. The figure reveals the institutional activity pushing the cross in the extreme bearish zone and consolidating under the yearly opening price at 1.58763.
On the other hand, the EMA(60) to Close Index recently pierced the -0.0300 level. This reading suggests both the oversold and the exhaustion of its accelerated downtrend identified with the black trend-line.
In this context, the accelerated downward trend-line breakout and the close above yearly opening price should warn about potential recoveries in the EURAUD cross.
Technical Outlook
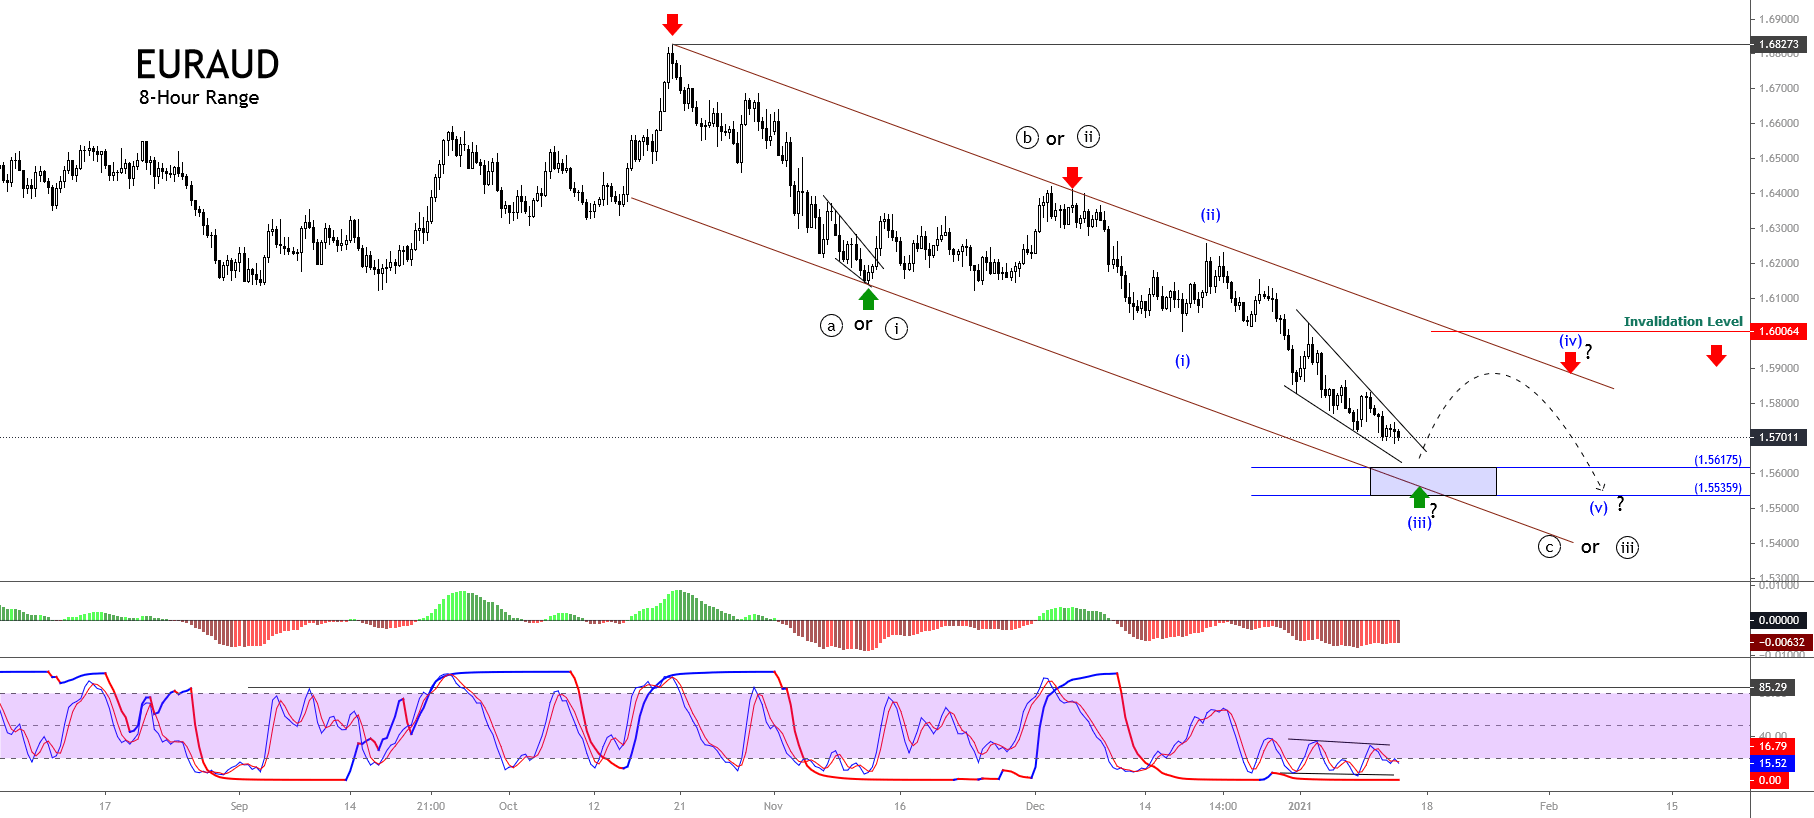
The short-term Elliott wave outlook for the EURAUD cross unfolded in the 8-hour chart reveals the progress of an incomplete bearish impulsive wave of Minuette degree labeled in blue, suggesting further drops.
The previous chart illustrates the downward sequence that began on October 20th when the cross found fresh sellers at 1.68273 and started a bearish structural series of Minute degree labeled in black, which currently could be in its wave ((c)) or ((iii)). The internal structure seems developing its wave (iii) of Minuette degree identified in blue.
The wave (iii) potential bearish target can be found between 1.56175 and 1.55359, which coincides with the descending channel’s base-line. Once the price tests the possible target area, the market participants could carry up the EURAUD cross toward the short-term descending channel’s upper line.
Regarding the wave (iv) in blue, considering the alternation principle, as wave (ii) is a simple corrective formation in price and time, wave (iv) should be complex and should last longer than wave (ii).
On the other hand, both the trend indicator and the timing plus momentum oscillator remain, supporting the bearish bias. Each rally could represent an opportunity to add positions to the bearish side.
In summary, the EURAUD cross continues in the extreme bearish sentiment zone advancing in an incomplete downward sequence, which could find support in the potential target zone between 1.56175 and 1.55539. Once the price finds support, the cross could start to bounce toward the upper line of its short-term descending channel. Finally, the bearish scenario analyzed will be invalid if the price soars above 1.60416, corresponding to the end of wave (i) in blue.


