
The NZDUSD pair continues extending its gains, testing the psychological barrier of 0.71, helped by the US Dollar weakness. The Oceanic currency outperforms over 5.4% during the current year. Also, the pair advances over 27% since it confirmed its bottom on March 22nd at 0.55862.
Technical Overview
The big picture of the NZDUSD illustrated in the following 12-hour chart shows the primary upward trend, its trendline plotted in blue, intact since March 22nd when the price confirmed its bottom at 0.55862 and began the rally that remains in progress to date. Likewise, the secondary trend and its green trendline reveal the acceleration of the price testing by the third time the psychological barrier of 0.71.
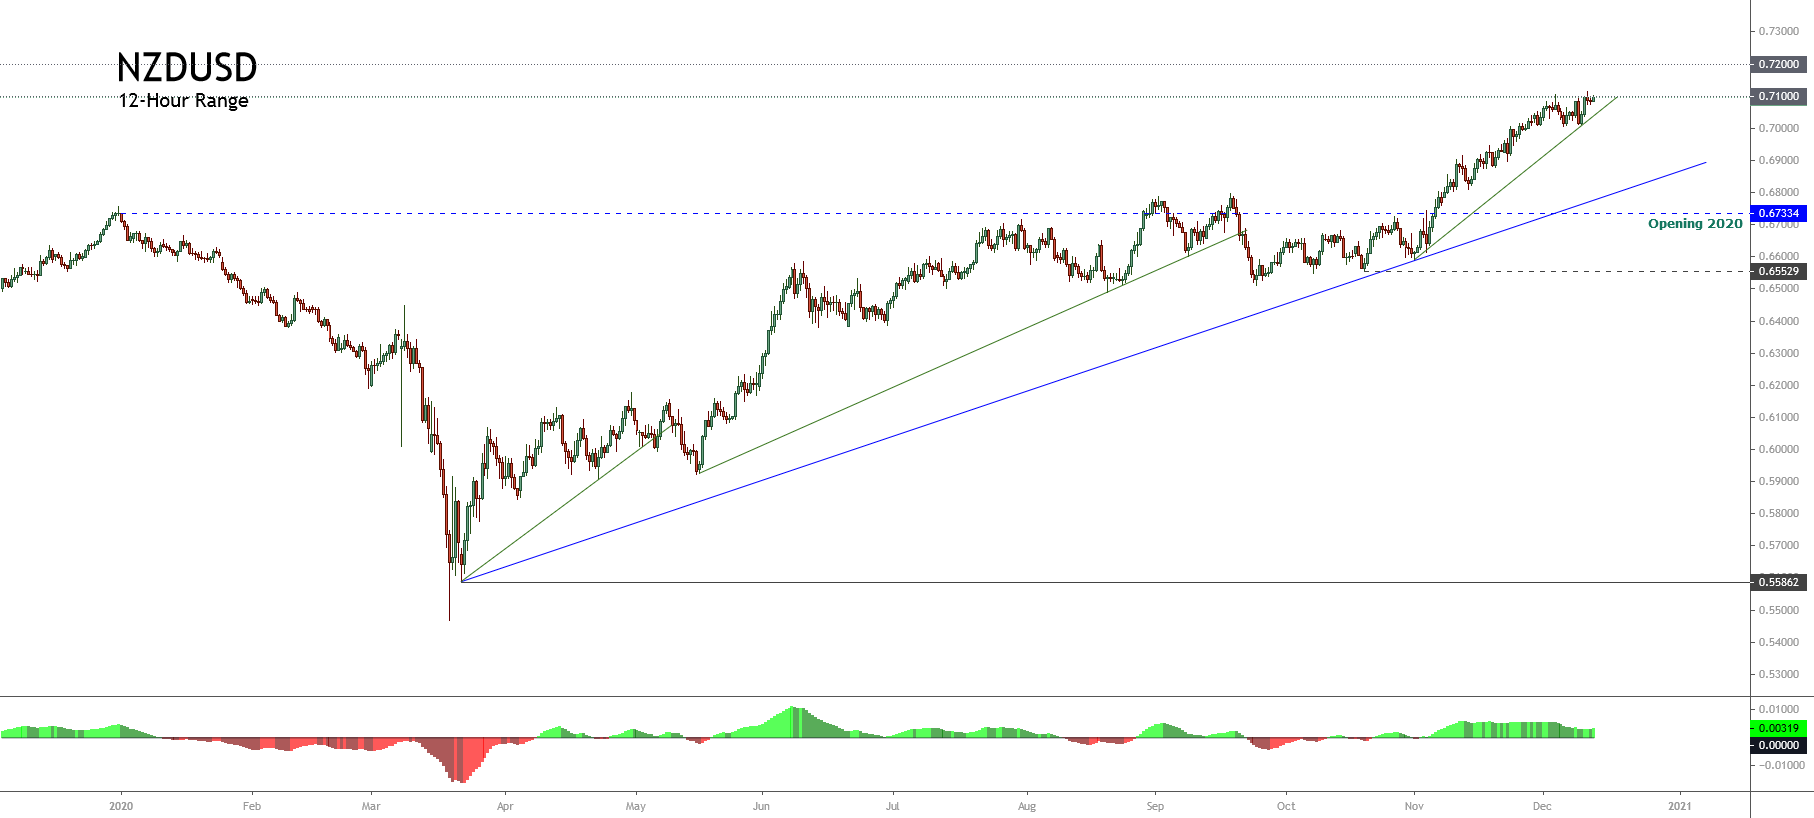 Considering that the NZDUSD pair currently re-tests the 0.71 level, the price could extend its gains, reaching a new yearly high, to find resistance in the next psychological resistance of 0.72.
Short-term Technical Outlook
The short-term Elliott wave view for the NZDUSD pair unfolded by its 4-hour chart led us to observe an incomplete impulsive sequence of Minute degree labeled in black, which began on October 22nd price found fresh buyers at 0.65529.
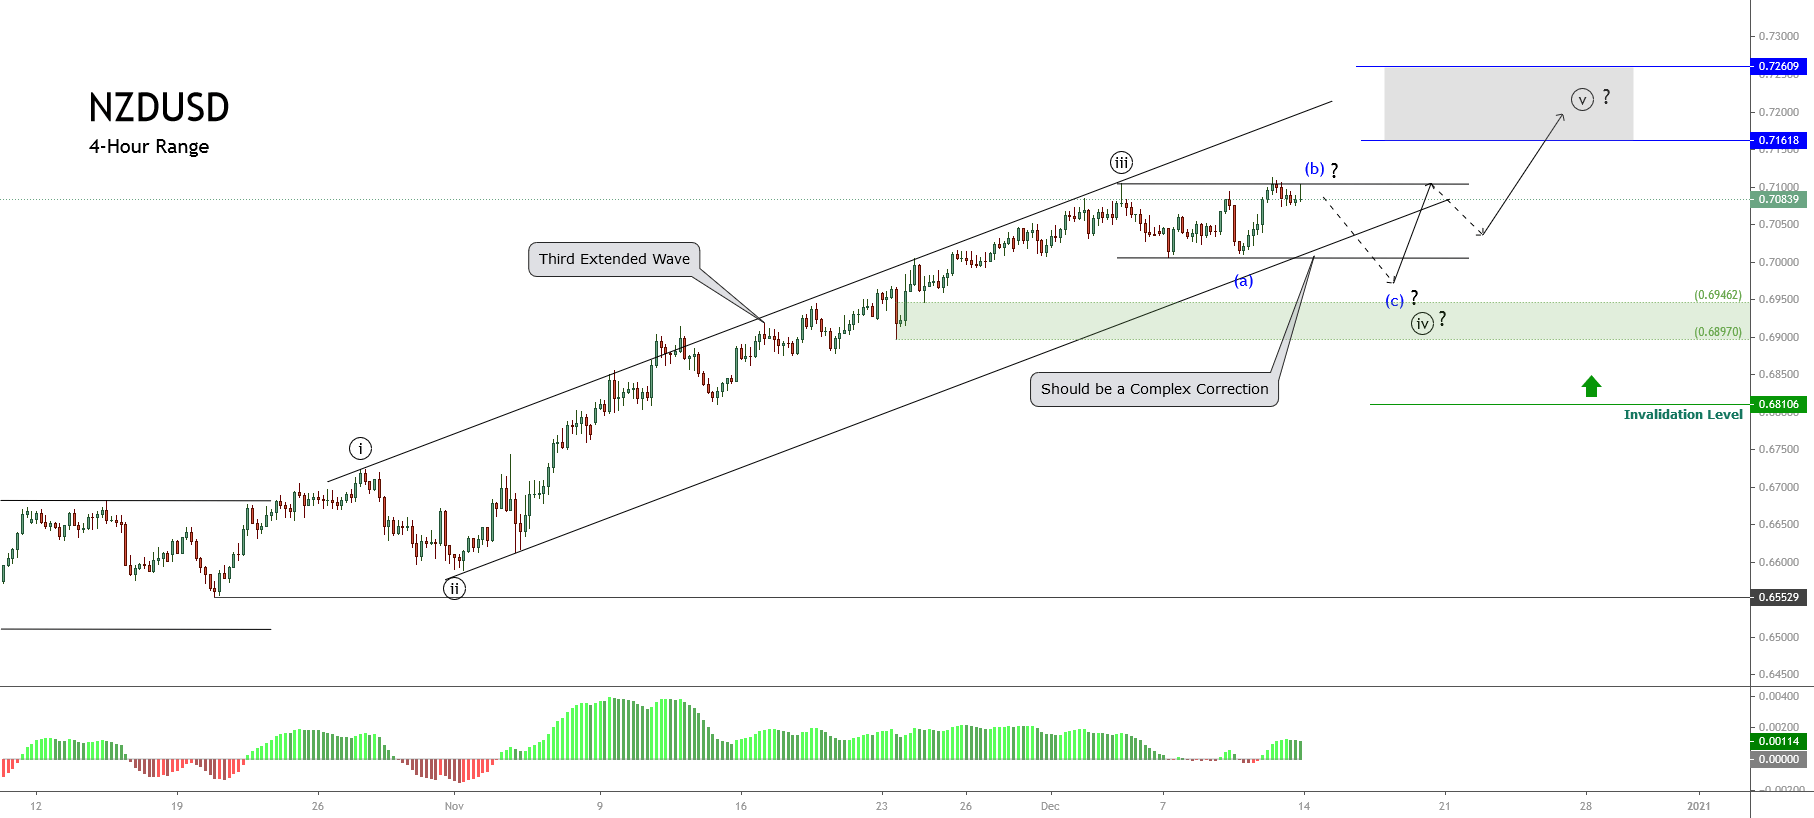 The previous chart illustrates the impulsive structure that continues progressing and looks to develop its fourth wave of Minute degree labeled in black. Moreover, in the chart, we should remark that the third wave, which looks like the extended wave of the incomplete impulsive sequence identified in black, has found resistance at 0.71043 on December 03rd.
Once the price topped the yearly high at 0.71043, the pair began to develop a sideways corrective formation, still progressing. In this regard, considering both the alternation principle stated by the Elliott Wave Theory and that wave ((ii)) in black looks like a simple corrective pattern, the current wave ((iv)) of the same degree should be complex in terms of price, time, or both.
In this scenario, the price action might retrace until the demand zone bounded between 0.69462 and 0.68970, where the Kiwi could find fresh buyers expecting to boost the pair toward a new yearly high. This high could strike the potential target zone between 0.71618 and 0.7260.
In summary, the short-term Elliott wave perspective for the NZDUSD pair reveals the advance in a bullish trend that currently moves mostly sideways in an incomplete corrective formation. The fourth wave in progress could find support in the demand zone bounded between 0.69462 and 0.68970. Likewise, fresh buyers could boost the price toward 0.71618 and extend its gains until 0.7260. Finally, the invalidation level of the current bullish scenario is located at 0.68106.