Categories
Forex Elliott Wave Forex Market Analysis

Is US Dollar Index Ready for a Rally?

The US Dollar Index reveals exhaustion signals of its bearish trend. A trend that remains in progress since the currency basket topped at 102.992 pm mid-March 2020. Follow with us what signs show the Greenback to expect a rally during the first quarter of the year.

Technical Overview

The big picture of the US Dollar Index (DXY) illustrated in the next weekly chart reveals the downtrend that remains active since the price found fresh sellers at 102.992 in mid-March 2020. The following figure also exposes the market participants’ sentiment represented by the 52-week high and low range.

The previous figure shows the extreme bearish sentiment dominating the big participants’ bias since mid-March 2020. Nevertheless, the long-tailed candlestick corresponding to the last trading week that was closed above the yearly opening, suggests the bearish trend’s exhaustion in progress.

On the other hand, the reading -4.26 observed in the EMA(52) to Close Index suggests the currency basket is oversold; thus, a potential corrective rally could occur in the coming weeks.

The mid-term Elliott wave view of the US Dollar Index exposed in the next 8-hour chart suggests completing an extended third wave of Minute degree labeled in black, when the price found support at 89.209 on January 06th.

Once the price found support, the price started to bounce, developing an incomplete wave (a) of Minuette degree identified in blue, which belongs to wave ((iv)) in black. Finally, the momentum and timing oscillator suggests that the bearish pressure persists, and the current upward movement could correspond to a corrective rally.

Technical Outlook

The mid-term outlook for the US Dollar Index unfolded in the next 8-hour chart shows the incomplete wave ((iv)) in black, which advances in wave (a) identified in blue. In this context, the current climb experienced by the Greenback could be a corrective rally.

According to Elliott Wave theory, the fourth wave in progress could retrace to 50% of wave ((iii)),  and reach 91.205. Likewise, considering that the second wave was a simple correction in terms of price and time, the current fourth wave should be complex in terms of price, time, or both. 

On the other hand, if the price extends beyond 50%, this could indicate weakness in the bearish pressure. If the price action advances above 92.107, the bearish scenario will be invalidated leading us to expect more upward movement.

In summary

The US Dollar Index completed a bearish third wave of Minute degree at 89.209 on January 06th, when it began to bounce, starting an upward corrective rally that remains in progress. The current intraday movement could reach 91.206 where the price could complete its wave (a) of Minuette degree labeled in blue. On the other hand, considering the alternation principle, the current corrective formation, the structure should be complex in terms of price, time, or both. Finally, the bearish scenario’s invalidation level locates at 92.107, corresponding to the end of wave ((i)) in black.

Categories
Forex Course

197. Using The USDX Numbers To Trade The Forex Market

Introduction

The U.S. Dollar Index is one of the most reckoned currency indexes and trades on exchanges with the DXY ticker or the USDX ticker. This index has been around in the market since 1973, when the base value was kept at 100,000.00, which is now 100.00.

It is a very prominent factor that facilitates Greenback. And the basket used to measure the U.S. dollar index value has only been changed once post-Euro replaced many other European currencies in 1999.

Formula To Calculate USDX

USDX = 50.14348112 * the EUR/USD exchange rate ^ (-0.576) * the USD/JPY exchange rate ^ (0.136) * the GBP/USD exchange rate ^ (-0.119) X the USD/CAD exchange rate ^ (0.091) × the USD/SEK exchange rate ^ (0.042) * the USD/CHF exchange rate ^ (0.036).

Implementing The US Dollar Index to Trade Forex

The movement determined in the U.S. currency index, such as the USDX, offers traders a sense of how the currency is experiencing a change in its value against other currencies in the index. For instance, if there is a rise in the USDX level, this indicates the rise in the U.S. dollar. Similarly, when the level of USDX is falling, so is the dollar in the foreign exchange market.

Many financial reporters leverage the changes witnessed in the U.S. Dollar Index’s value to offer their viewers and audiences an idea of how the U.S. dollar performed in the foreign exchange market. This works as an alternative to analyzing how each currency increased or decreased against the dollar.

Moreover, the USDX can also act as an inverse indicator that reflects the strength of the consolidated Euro currency of the European Union, considering that the weight of Euro (57.6%) is the most in the index.

Another prominent aspect that the forex trader should consider is how the movements of the USDX is associated with the other currencies that are put against the U.S. Dollar.

For instance, when the currency pair is measured as USD/JPY, it is likely to be positively correlated, and both the currencies should rise and fall at the same time.

Contrarily, when the currency pair is measured like EUR/USD, then the currency pair and USDX are inversely correlated. This implies that they are likely to move in the opposite direction, where one will fall when the other rises.

[wp_quiz id=”97457″]
Categories
Forex Course

196. Ever Wondered What ‘Trade-Weighted Dollar Index’ Is All About?

Introduction

The trade-weighted dollar is a prominent index developed by the FED in order to measure the value of the U.S. dollar spending on its competitiveness against the trading partners. It is used to determine the purchasing value of the U.S. dollar and to summarize the impact of appreciation and depreciation of the currency against foreign currencies.

The Importance Of Trade-Weighted Dollar Index

When the value of the U.S. dollar rises, the import to the country becomes less expensive, whereas exports become expensive. A Trade-Weighted Dollar Index is used to measure the value of the foreign exchange of the U.S. dollar in comparison to specific foreign currencies.

It offers weightage or importance to currencies that are most popularly used in international trade, instead of comparing the dollar value to every foreign currency. As the currencies are weighted distinctively, the modifications in each currency will have a different effect on the trade-weighted dollar as well as corresponding indexes.

After the U.S. Dollar Index, Trade-Weighted Dollar Index is the primary tool used to measure the strength of the U.S. dollar. It is also reckoned as the Broad Index was introduced in 1998 by the U.S. Federal Reserve Board.

It was created after the integration of the Euro and to reflect the trade patterns of the U.S. more precisely. The Federal Reserve picked 26 currencies for this broad index, envisioning the acceptance of the Euro by 11 countries belonging to the European Union.

Countries Included In The Trade-Weighted Dollar

Index

Here are the countries with the weight on the index –

  • Eurozone – 18.947
  • China – 15.835
  • Canada – 13.384
  • Mexico – 13.524
  • Japan – 6.272
  • United Kingdom – 5.306
  • Korea – 3.322
  • Taiwan – 1.95
  • Singapore – 1.848
  • Brazil – 1.979
  • Malaysia – 1.246
  • Hong Kong – 1.41
  • India – 2.874
  • Switzerland – 2.554
  • Thailand -1.096
  • Australia – 1.395
  • Russia – 0.526
  • Israel – 1.053
  • Sweden – 0.52
  • Indonesia – 0.675
  • Saudi Arabia – 0.499
  • Chile – 0.625
  • Philippines – 0.687
  • Colombia – 0.604
  • Argentina – 0.507

Final Thoughts

Trade-Weighted US Dollar is a broad index that includes countries from all across the world. Traders will also find some developing countries in the broad index list, which makes it a better reflection of the value of the U.S. dollar worldwide.

[wp_quiz id=”97448″]
Categories
Forex Elliott Wave Forex Market Analysis

Is the US Dollar Index Finding A Bottom?

Technical Overview

The US Dollar Index (DXY) continues bouncing in the extreme bearish sentiment zone, testing the resistance at 90.983. The breakout of this resistance level could lead to expect further upsides in the following trading sessions.

The following figure shows the US Dollar Index in its 8-hour timeframe exposing the mid-term market participants’ sentiment unfolded by the 90-day high and low range, revealing the bearish trend’s exhaustion. In this context, the surpassing of the next resistance at 90.983 could warn about the Greenback recovery, which could boost the price until the next resistance is located at 92.236. Likewise, the exhaustion could imply the consolidation of the bearish trend.

On the other hand, the primary mid-term trend plotted in blue shows the bearish pressure that remains in progress and the current since DXY found resistance at 94.742 on September 25th. Likewise, the secondary trend identified with the accelerated green downward trendline shows a pause of the short-term downtrend started at 94.302 on November 04th. In this context, the pause in progress represented by the rising minor trend could develop a limited rally, which could carry the price to test the precious swing at 91.200 reached on December 09th.

Technical Outlook

The short-term Elliott wave view for DXY exposed in the next 4-hour chart reveals the end of the bearish wave ((iii)) of Minute degree labeled in black and the start of wave ((iv)) of the same degree, suggesting the possibility of a corrective rally, which could take until January 20212.

From the previous chart, we distinguish the start of wave ((iv)) identified in black, which began when DXY found support at 89.73 on December 17th, ending the third wave of Minute degree labeled in black. Likewise, the price action surpassed the short-term downward trendline plotted in green, suggesting the bearish sequence’s exhaustion that began at 94.302 on November 04th.

With the short-term trendline piercing, DXY developed the first segment of a corrective wave of Subminuette degree identified as wave a labeled in green, which found resistance in the supply zone between 91.014 and 91.200. Once topped at 91.018, the Greenback retraced, developing its wave b of the same degree, which found support in the intraday demand zone between 90.262 and 90.059. 

The textbook suggests that the price action should develop a third move identified as wave c in green, which could advance until the next supply zone bounded between 91.412 and 91.580. Once the US Dollar Index completes the third segment, the Greenback will complete the wave (a) of Minuette degree identified in blue corresponding to the first segment of the wave ((iv)) in black.

In summary, the US Dollar Index looks starting to develop the first segment of the fourth wave of Minute degree, suggesting the pause of the primary trend’s downtrend, which could last up until January 2021. In this regard, DXY currently found temporary support at 89.730, and the price could develop a new decline corresponding to the fifth wave of Minute degree. The potential next decline could pierce the previous low, being its potential next bearish target located at 88.864. Finally, if the price action surpasses the invalidation level placed at 92.107, the Greenback could start to show recovery signals, which could carry to expect a bullish reversal move.

Categories
Forex Course

195. Understanding The U.S. Dollar Index Numbers

Introduction

The U.S. Dollar Index is a measure of the value of the Dollar in respect to foreign currencies as measured by the respective exchange rates. More than half of the index value of the Dollar is measured against the Euro. The British Pound, the Japanese Yen, the Swedish Krona, the Canadian Dollar, and the Swiss Franc. It is a market on its own as well as an indicator of the U.S. dollar strength on a global level. Moreover, it can also be used as the technical analysis to determine trends of various markets.

How Is The US Dollar Index calculated?

Below is the formula to calculate USDX

USDX = 50.14348112 × EUR/USD^(-0.576) × USD/JPY^(0.136) × GBP/USD^(-0.119) × USD/CAD^(0.091) × USD/SEK^(0.042) × USD/CHF^(0.036)

Each currency value is multiplied by its weights. When the U.S. dollar is the base currency, this comes at a positive figure. On the other hand, when the U.S. dollar is used as the quoted currency; then this would come as a negative value. Additionally, pounds and euros are only countries where the U.S. dollar is used as the base currency as they are quoted in respect of the Dollar.

How To Interpret the U.S. Dollar Index?

Similar to any currency pair, there is a dedicated chart of the U.S. Dollar Index (USDX). Additionally, the index is calculated five days a week and 24 hours a day. The U.S. Dollar Index measures the value relative to a 100.000 base.

If the index value stands at 120, this means that the U.S. dollar has witnessed 20% appreciations against other currencies in the basket. This simply implies that the U.S. dollar has strengthened in comparison to other currencies. On the other hand, if the index value shows at 70, this implies a depreciation of 30%

Final Thoughts

The U.S. Dollar Index enables traders to monitor the value of the U.S. dollar in comparison to six currencies within the bracket in a single transaction. Moreover, it also assists them to hedge the bets against risks associated with the Dollar. Investors can use this index to hedge the normal movement of currency or speculate.

[wp_quiz id=”97442″]
Categories
Forex Course

194. Introduction To The US Dollar Index (USDX)

Introduction

The U.S. dollar index is referred to as a measure of the value of the U.S. dollar, which is relative to the value of a series of currencies that are the most important trading partners of the country. The USDX is similar to other forms of trade-weighted indexes that also use the exchange rates from the leading currencies.

U.S. Dollar Index – A Brief History

In the year 1970, the U.S. Dollar Index switched between 80 and 110. This was the time when the U.S. economy was witnessing recession and rising inflation levels. With the Federal Reserve increasing interest rates to cut inflation, money flowed into the U.S. dollar, resulting in a rise in the USD index. In February 1985, the USD Index hit 164.720; this is the highest it has ever been.

However, this caused significant issues for the U.S. exporters whose goods were no longer competitive internationally. Subsequently, strong actions were taken by the U.S. government to make the currency more competitive, with five nations agreeing to manipulate the U.S. dollar in the forex markets.

This made the Dollar Index dropped by 51% over the course of four years. Since that time, the index has tracked the performance of the economy as well as liquidity flows.

Fundamentals of U.S. Dollar Index

This index is presently calculated by factoring in the exchange rates of six leading world currencies, including Euro (EUR), British Pounds (GBP), Canadian Dollar (CAD), Swiss Franc (CHF), Swedish Krona (SEK), and Japanese Yen (JPY). The biggest component of this index is the EUR, which accounts for approximately 58% of the basket. The weights of the rest of the currencies in the index include –

  • GBP (11.9%)
  • JPY (13.6%)
  • SEK (4.2%)
  • CAD (9.1%)
  • CHF (3.6%)

What Impact The Price Of The USD Index?

The USD Index is primarily impacted by the demand for and the supply of the U.S. Dollar. Related currencies of the baskets are also an important factor. These factors impact the price of each pair of currency in the formula that is being used to calculate the value of the U.S. Dollar’s value. The demand and supply of currencies are determined by monetary policies.

In the upcoming course lessons, we will be learning more about the US Dollar index. So, stay tuned. Please take the quiz below before you go. Cheers.

[wp_quiz id=”97429″]
Categories
Forex Technical Analysis

US Dollar Index awaiting FOMC Meeting in the Extreme Bearish Zone

The US Dollar Index (DXY) reached a new yearly low of 90.128, expecting the last FOMC interest rate decision meeting of the year. The analysts’ consensus anticipates the rate unchanged at 0.25% by the FED.

Source: TradingEconomics.com

Technical Overview

The short-term overview for the Greenback illustrated in the following 8-hour chart displays the short-term market participants’ sentiment unfolded by the 90-day high and low range, which shows the price action moving in the extreme bearish sentiment zone. Likewise, the bullish divergence observed on the EMA(60) to Close Index carries to expect a recovery for the following trading sessions.

On the other hand, the short-term primary trend outlined with its trend-line drawn in blue reveals that the bearish bias remains intact since September 25th, when the price topped at 94.742. The secondary trend plotted with the trend-line in green shows the acceleration of the downward movement that began on November 04th at 94.302.

Nevertheless, the breakdown of the last sideways range developed by DXY during the latest trading session, combined with the bullish divergence observed between the price and the EMA to Close indicator, makes us suspect a bounce, which could hit the resistance of the extreme bearish sentiment zone at 91.282.

Short-term Technical Outlook

The short-term Elliott wave view for the US Dollar Index unfolded by the next 4-hour chart exposes the bearish progression of wave ((iii)) of Minute degree labeled in black that belongs to the downward sequence that began on November 04th at 94.302. 


According to the textbook, the price action requires to confirm the third wave’s completion before acknowledging the start of the wave ((iv)) in black. In this regard, the internal structure of the wave ((iii)) added to the bullish divergence observed in the MACD oscillator; thus, suggesting the advance in wave (v) of Minuette degree identified in blue.

On the other hand, considering both the alternation principle and that the second wave of the same degree looks simple in terms of price and time, the next corrective structure should be complex in terms of price, time, or both.

In this context, the next DXY path could produce a bounce corresponding to the fourth wave of Minute degree, advancing to the supply zone between 91.014 and 91.200, and even strike the 91.580 level.

In summary, the US Dollar Index looks advancing in the fifth wave of Minuette degree that belongs to the third wave of Minute degree. In this context, the price action could experience a bounce corresponding to the fourth wave of Minute degree, which could move up to 91.850. Nevertheless, if the price surpasses the invalidation level located at 92.107, the Greenback could be showing the start of a reversal of the current bearish trend.

Categories
Forex Elliott Wave Forex Technical Analysis

US Dollar Index Under Bearish Pressure. What’s next?

The US Dollar Index (DXY) consolidates on Monday’s session in the extreme bearish sentiment zone bouncing a modest 0.06% from the last Friday 04th, from 90.476 to 90.757. However, the technical perspective is mostly bearish for the DXY basket of currencies.

Technical Overview

The following 8-hour chart shows the mid-term market participants’ sentiment unfolded in its 90-day high and low range. The figure reveals the bearish pressure that carries the Greenback in the extreme bearish zone between 90.476 and 91.543. Likewise, the intraday sideways candlestick formation suggests the likelihood of a pause and the downward continuation for the following trading sessions.

Regarding the US Dollar’s trend, the primary trend plotted in the blue line reveals the bearish bias. The secondary trend identified in green suggested the downward acceleration since November 04th when the price failed its bullish advance at 94.316. Likewise, the broader distance between the primary trend-line and the price leads to a limited correction before continuing the bearish path.

Short-term Technical Outlook

The short-term Elliott Wave perspective for the US Dollar Index exposed in the next 2-hour chart suggests the incomplete downward advance of a five-wave sequence, which could be starting to consolidate in its fourth wave of Minuette degree identified in blue.

The current bearish sequence began on November 04th when the price found fresh sellers at 90.302 and began a decline that is still present to date. The previous chart suggests the completion of the third wave of Minuette degree. This Elliott wave context is supported by the broadest distance observed in the MACD oscillator.

On the other hand, considering that the second corrective wave seems simple in terms of price and time, the alternation principle suggests that the fourth wave in progress should be complex in terms of price, time, or both. In this context, the next corrective pattern could be a triangle pattern or a combination such as a double-three or a triple-three formation.

The implication of the fourth wave’s extension could be indicative of the exhaustion of the bearish trend, and the price action should reverse soon.

Finally, if the price action rises and closes above the supply zone between 91.412 and 91.580, the US Dollar Index could reveal a possible reversion of the current bearish trend.

Categories
Forex Elliott Wave Forex Market Analysis

Is the US Dollar Index Ready for a Bounce?

The US Dollar Index (DXY) advances in the extreme bearish sentiment zone finding an intraday support on Monday’s trading session at 92.016. During this intraday bounce, the price jumped to the extreme bearish zone’s resistance, where the price action started to consolidate. Even considering this intraday recovery, the Greenback accumulates losses of nearly 4.40% (YTD).

Technical Overview

The US Dollar Index, represented in its 8-hour chart, shows the market sentiment’s participants moving within its 90-high and low range, and it reveals the bearish pressure on the Greenback. In this regard, as long as the price keeps moving below 92.663, the short-term trend should stay mostly bearish.

On the other hand, the big picture under the Elliott Wave perspective illustrated in its 8-hour chart reveals the progress in an incomplete corrective formation, which could correspond to a flat pattern.

According to the wave theory, the flat pattern follows an internal sequence subdivided into 3-3-5. In this case, the Greenback should advance in a rally in a wave ((c)) of Minute degree identified in black subdivided into five segments.

An alternative scenario considers the possibility of a triangle pattern (3-3-3-3-3) or a double-three (3-3-3) in progress. However, the structure observed until this point doesn’t allow us to confirm or discard any of these potential Elliott wave formations.

Short-term Technical Outlook

The Greenback in its 4-hour range unveils the completion of the wave ((b)) of Minute degree labeled in black in the demand zone between 92.019 and 91.750, where the price bounced from on Monday’s trading session until 92.800.


Once the price reacted mostly upward, the US Dollar Index began to decline in a wave ii or B of Subminuette degree identified in green. In this regard, a bullish confirmation should lead us to expect further upward movements that could boost the price toward the next supply zone between 93.343 and 93.545.

If the Elliott wave formation corresponds to a Flat pattern, the price could surpass the supply zone level of 94.303 and seek to test the end of wave ((a)) located on 94.742.

On the other hand, we should be aware that a rally in the US Dollar Index implies a potential drop in the pairs against the US Dollar, for example, EURUSD or GBPUSD.

Finally, the return to a  bullish scenario holds its invalidation level at 92.016, which corresponds to the bottom of the first upwards move identified in green.

Categories
Forex Assets

All You Need to Know to Start Trading the US Dollar Index

Some beginner traders may not have even heard or dealt with the US dollar Index, but the more invested traders are highly likely to have encountered the term on some media outlet. The US dollar Index, otherwise known under the abbreviations DXY or USDX, can be charted on MT4 on a variety of trading platforms. From the perspective of the forex market, the DXY is often said to be representative of the strength of the United States dollar (USD) due to the fact that it stands against other major currencies.

While traders are still unable to carry out trades on the DXY in the United States, the index is freely traded outside the borders of the country and across the world. Despite the availability of conducting related trades, some prop traders suggest that the ATR might be just too low for it to be a lucrative business endeavor. What is more, those who have extensive experience trading in the forex market claim that any involvement with the DXY may in fact have quite a negative impact on the overall trading of currencies, which may naturally vary from trader to trader.

Nonetheless, besides the difficulties encountered while trading this index, the DXY is still both interesting and important to discuss, especially in terms of the changes that have happened in the past and the ones that have yet to happen. In this article, we will delve deeper into this index implication in forex trading.

The DXY’s history commenced in 1973 when the United States left the gold standard, which further meant that the USD was no longer backed by an equivalent quantity of precious commodities. At the same time, the before-used gold- and silver-stamped banknotes could no longer be exchanged for the corresponding amount of gold and silver. The creation of this index therefore coincided with some key moments in the overall history of the country and its official currency. The value of paper money suddenly decreased and this led to an increase in frustration and fear in a number of people who started to spread concern for future ability to assess the USD’s worth. The idea of making an index directly stemmed from this need and hope that the currency’s value could be determined by comparing it to other world currencies.

Consequently, the currency basket was created and its value, set at 100, depended on the amount of trade carried out with other countries. As stated above, the necessity behind the formation of the DXY essentially originated from the USD no longer being tied to any hard commodities. Today, however, the value of the index changed substantially, especially because the currencies across the world changed and disappeared with time. A great number of the US trades were done with European countries and, as we know, a number of currencies in this continent were merged into the euro (e.g. the Deutsche mark, the French franc, the Italian lira, and the Greek drachma). The spread and the percentage hence changed dramatically and this naturally affected the DXY, which raised concern among the trading community. 

Some of the biggest challenges experts claim to have faced in the past is related to the fact that the DXY is generally not calculated by factoring in all the currencies in the world as it was originally conceptualized. While the world and its currencies kept changing, it appears that the rules governing the value of the USD and this index still remained the same. This idea is particularly interesting because the DXY is, as opposed to the common belief, currently determined on the basis of the exchange rates of six world currencies – the Euro (EUR), Japanese yen (JPY), Canadian dollar (CAD), British pound (GBP), Swedish krona (SEK), and Swiss franc (CHF), with the EUR as its greatest component. Based on this information, it is abundantly clear that the ratio does not originate from even distribution across all seven majors, excluding the AUD and the NZD. What is more, the index is heavily reliant on the USD/EUR currency pair, which makes above 50% of the DXY’S value. The weight is then shared between the currencies in the following manner:  the EUR: 57.6%, the JPY: 13.6%, the GBP: 11.9%, the CAD: 9.1%, the SEK: 4.2%, and the CHF: 3.6%. Therefore, traders interested in the AUD, NZD, and CNY will likely find little benefit from the USDX

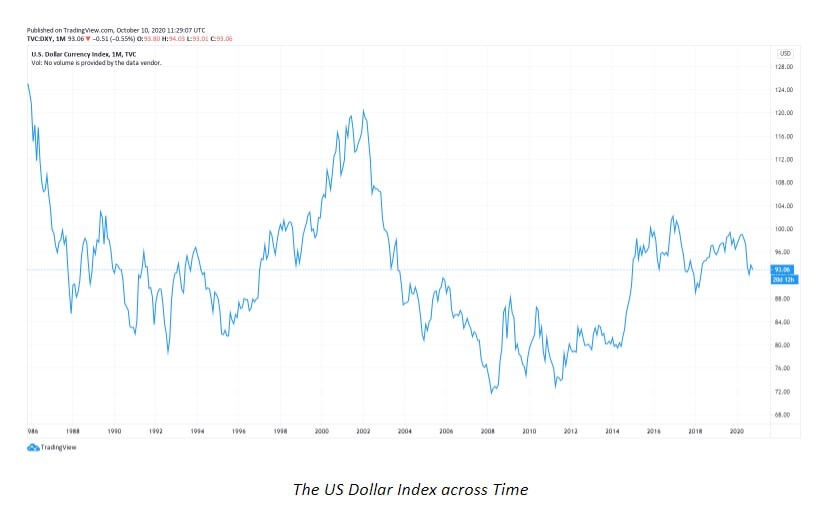
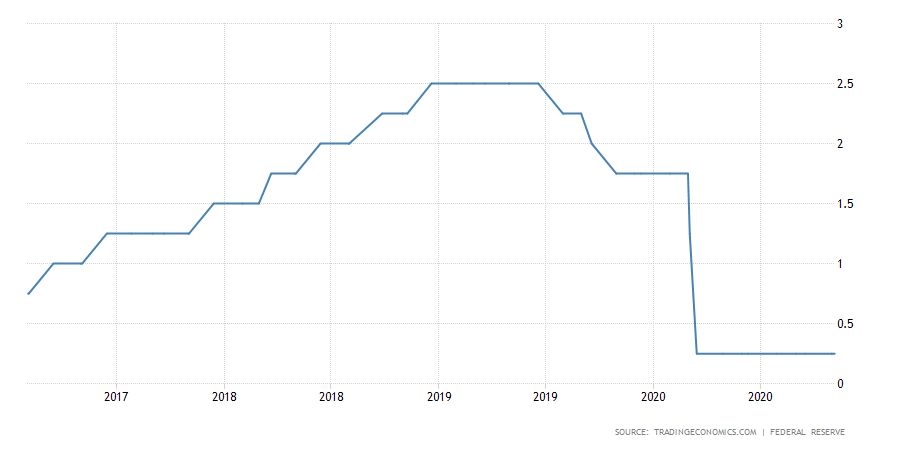
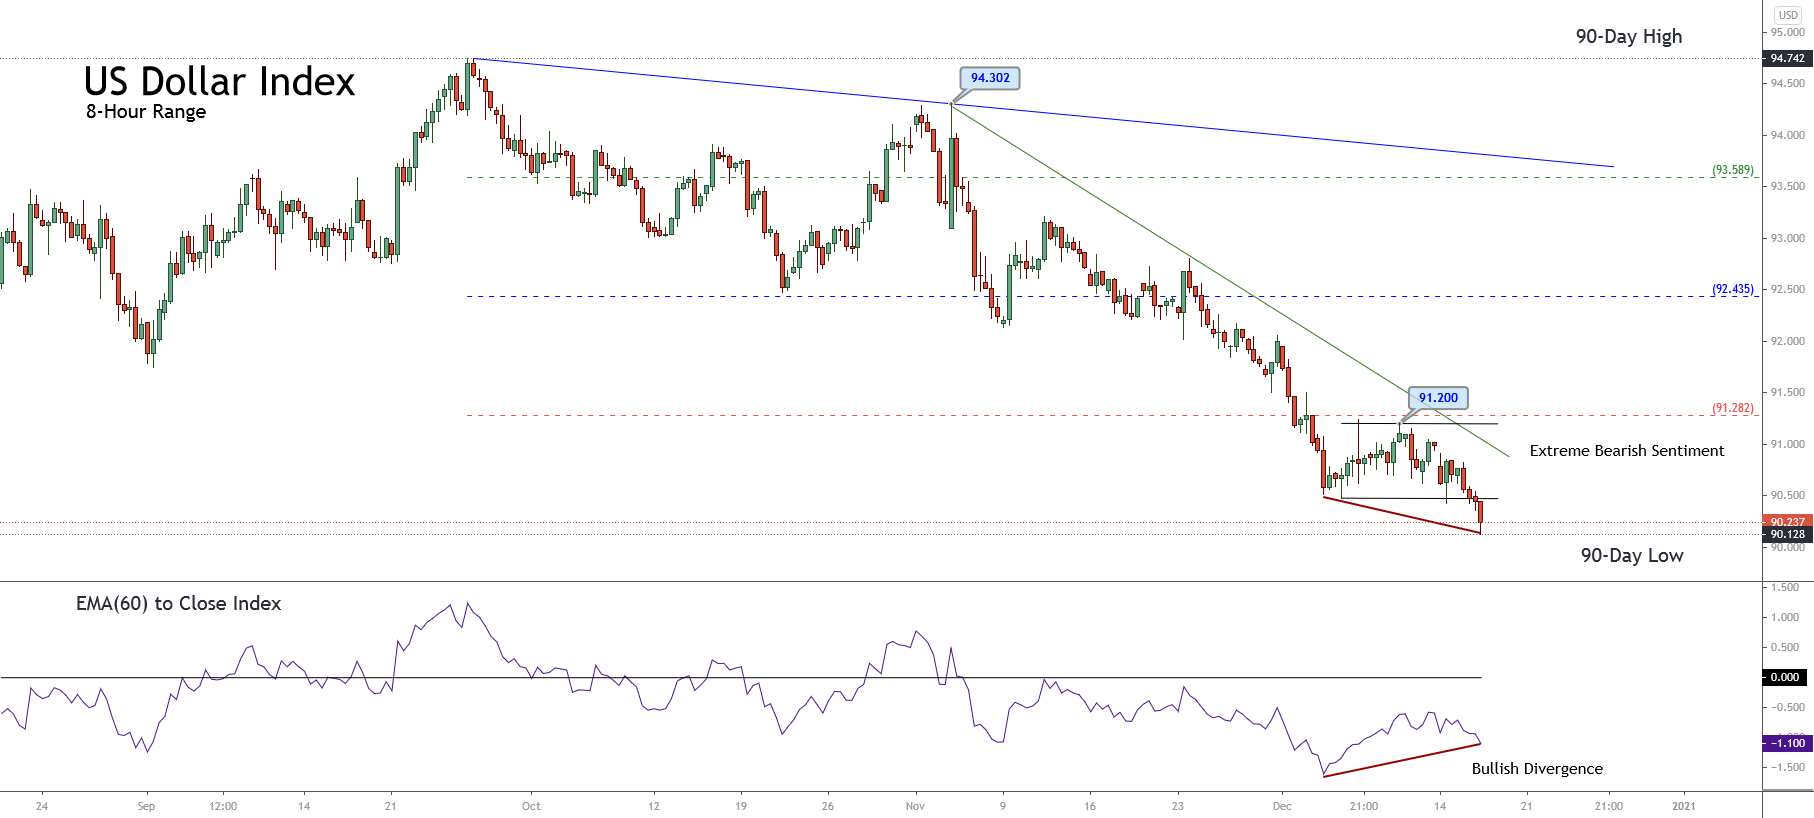
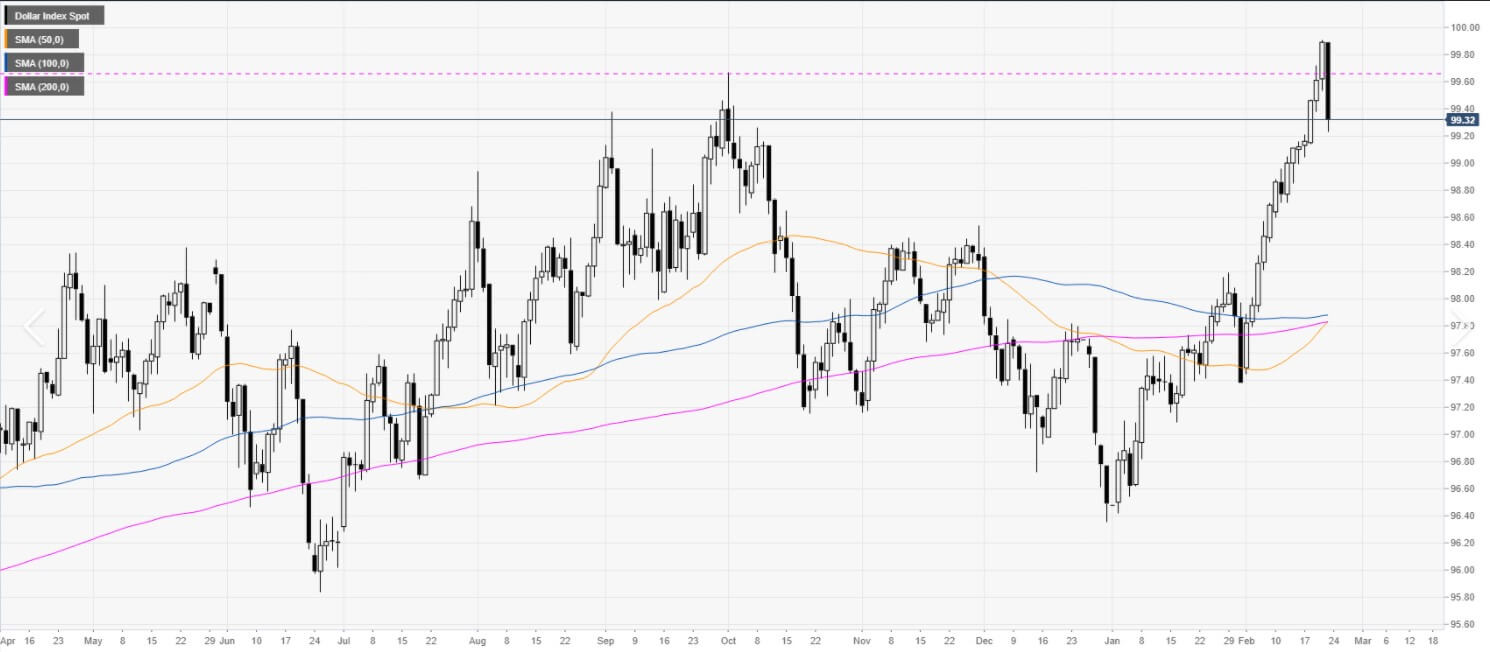
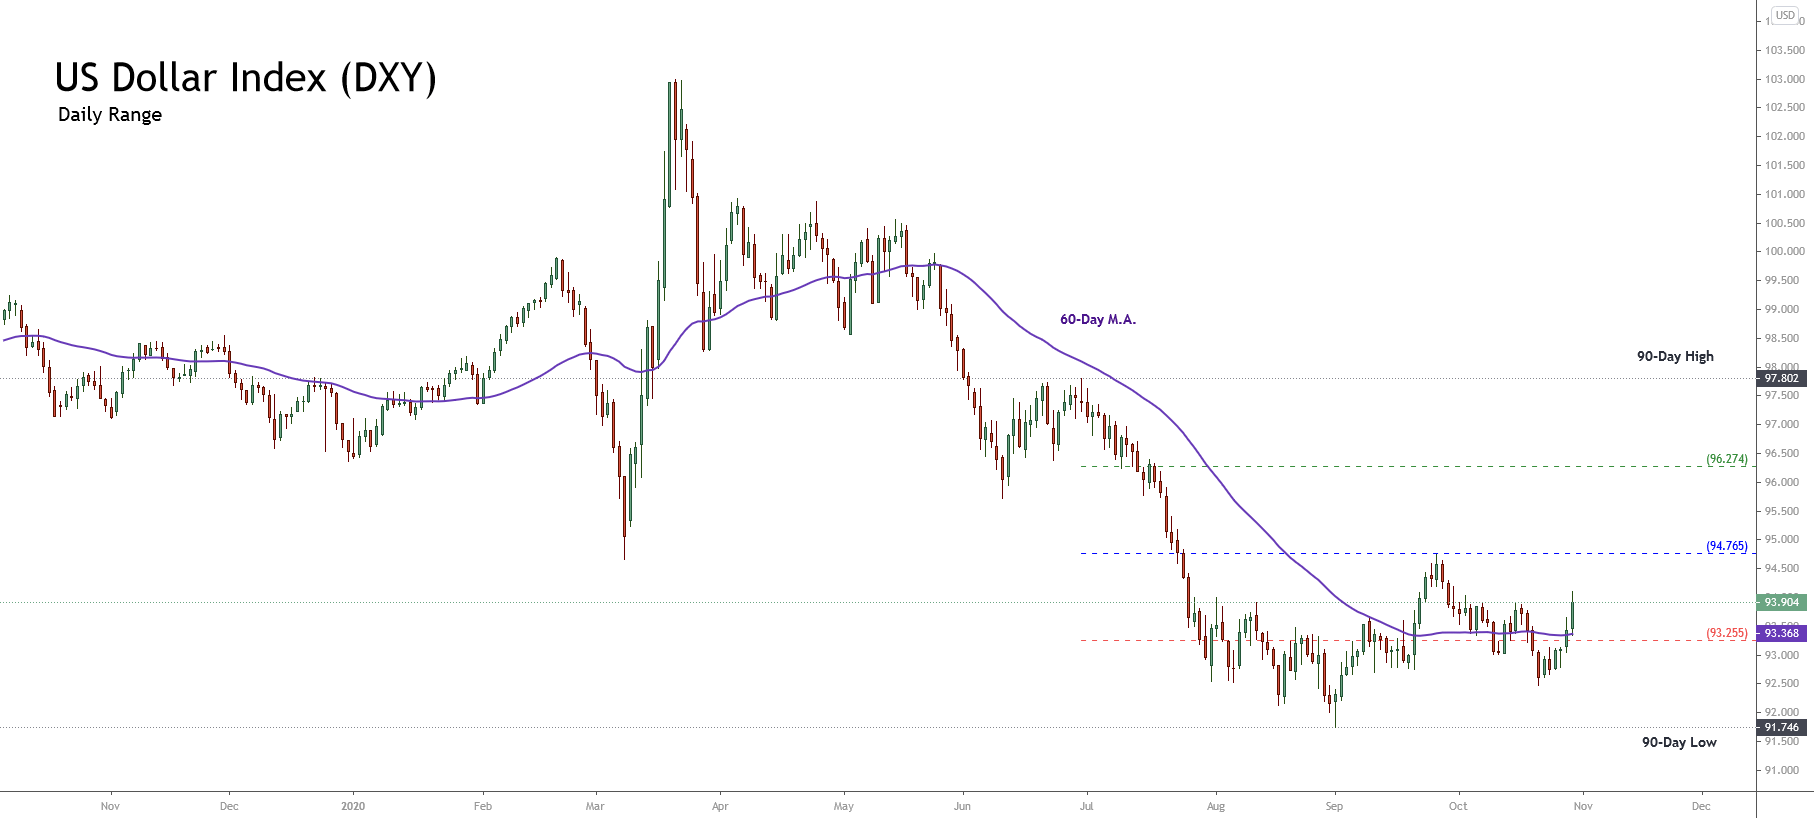
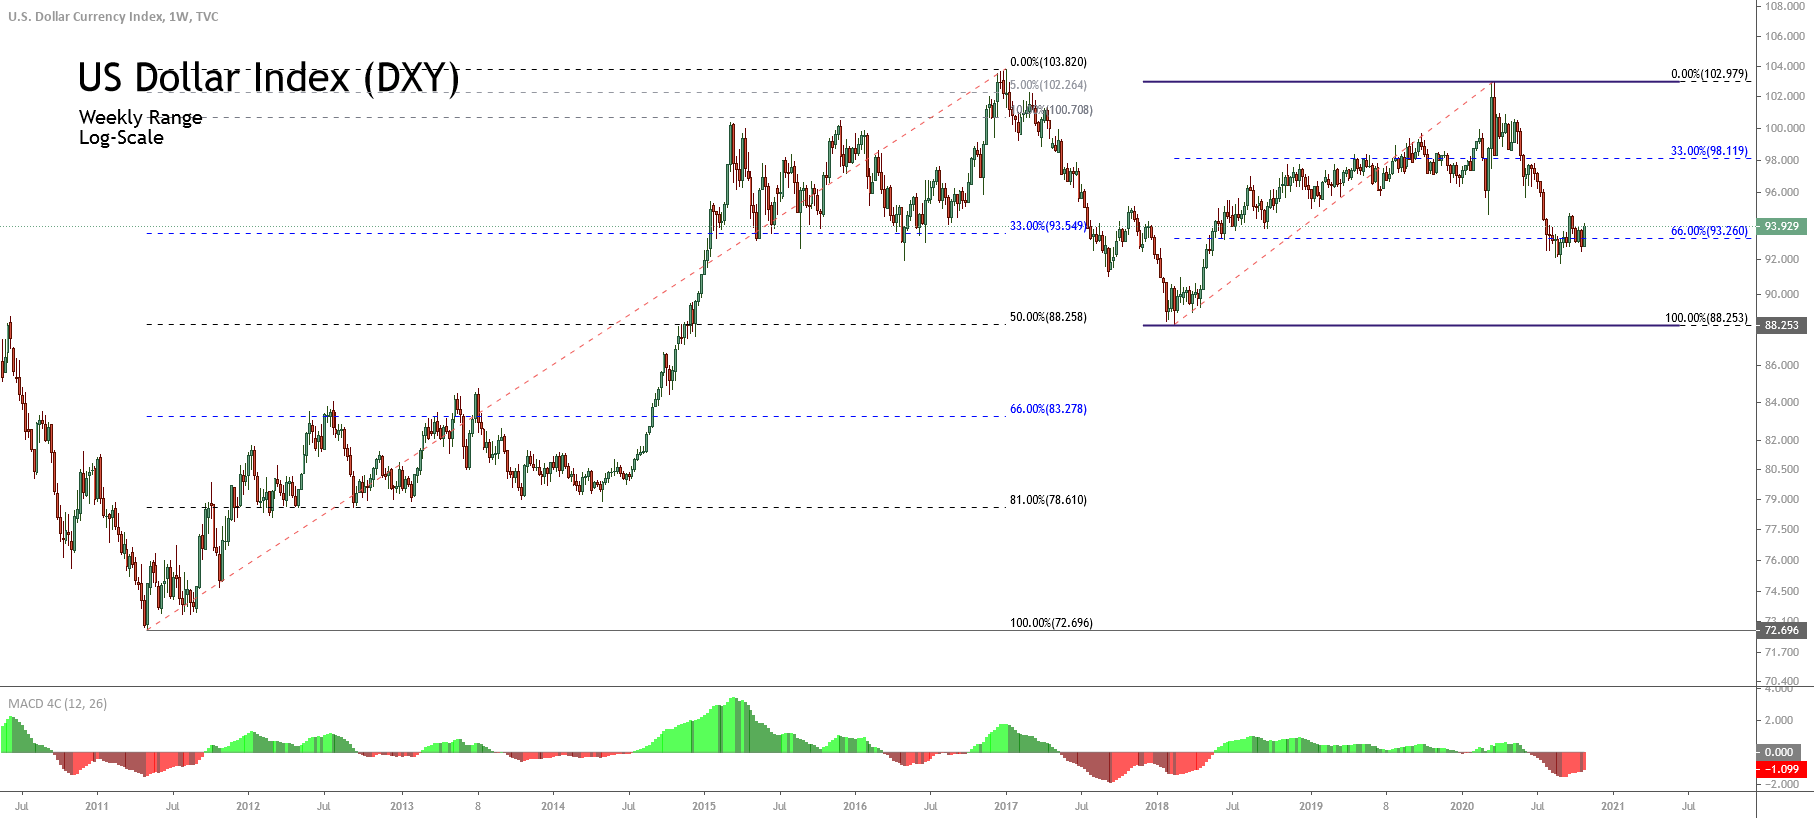
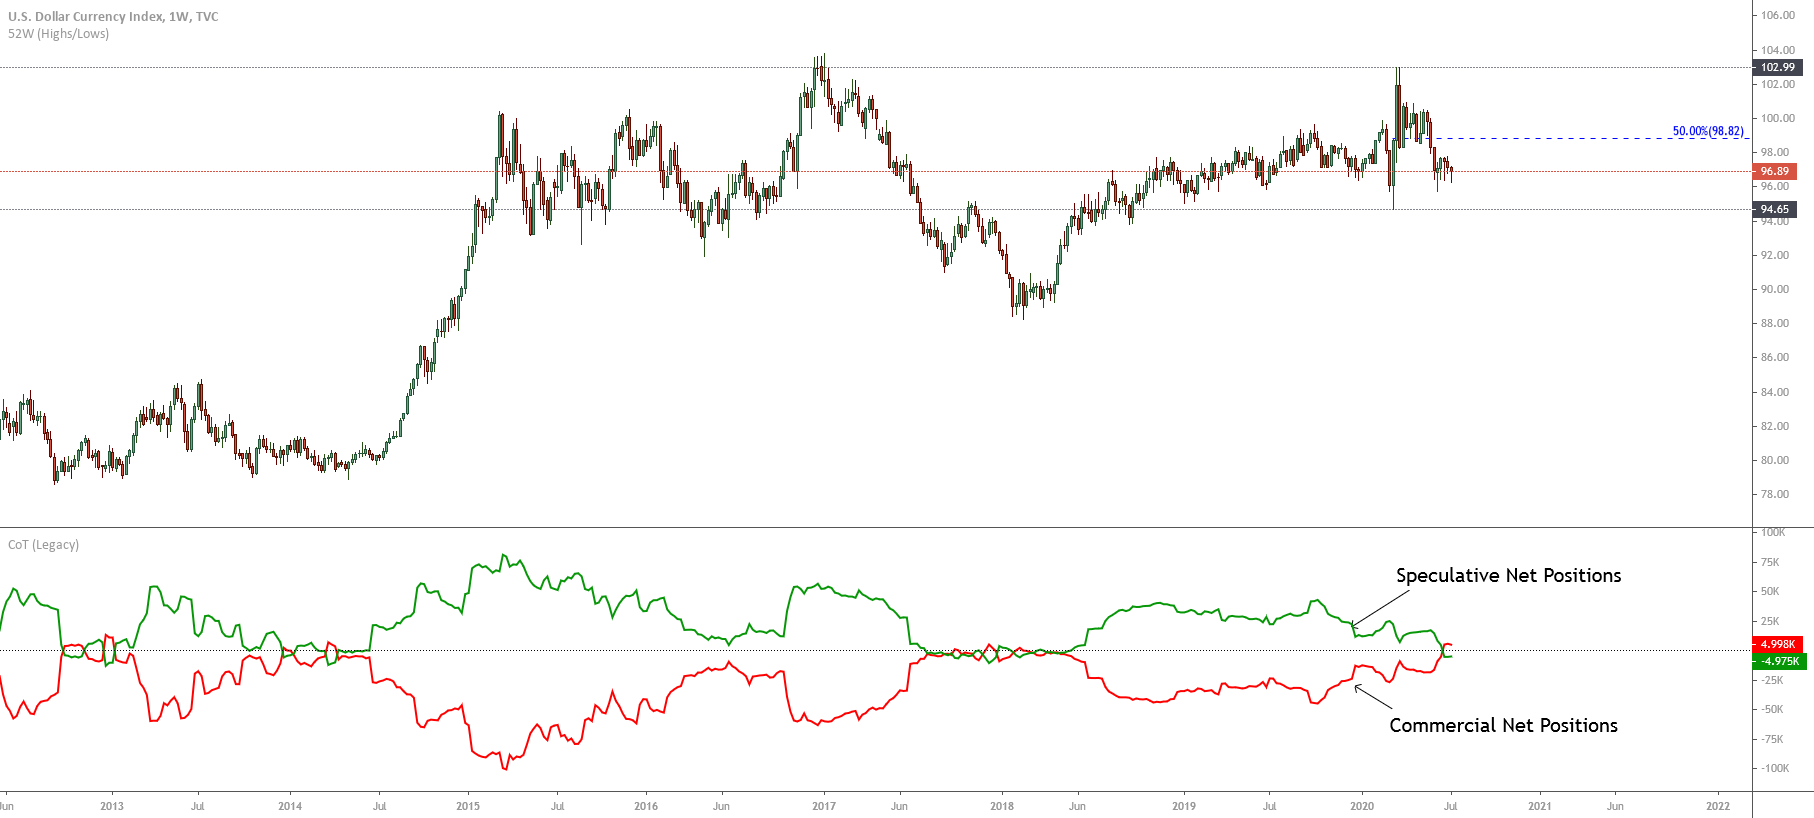
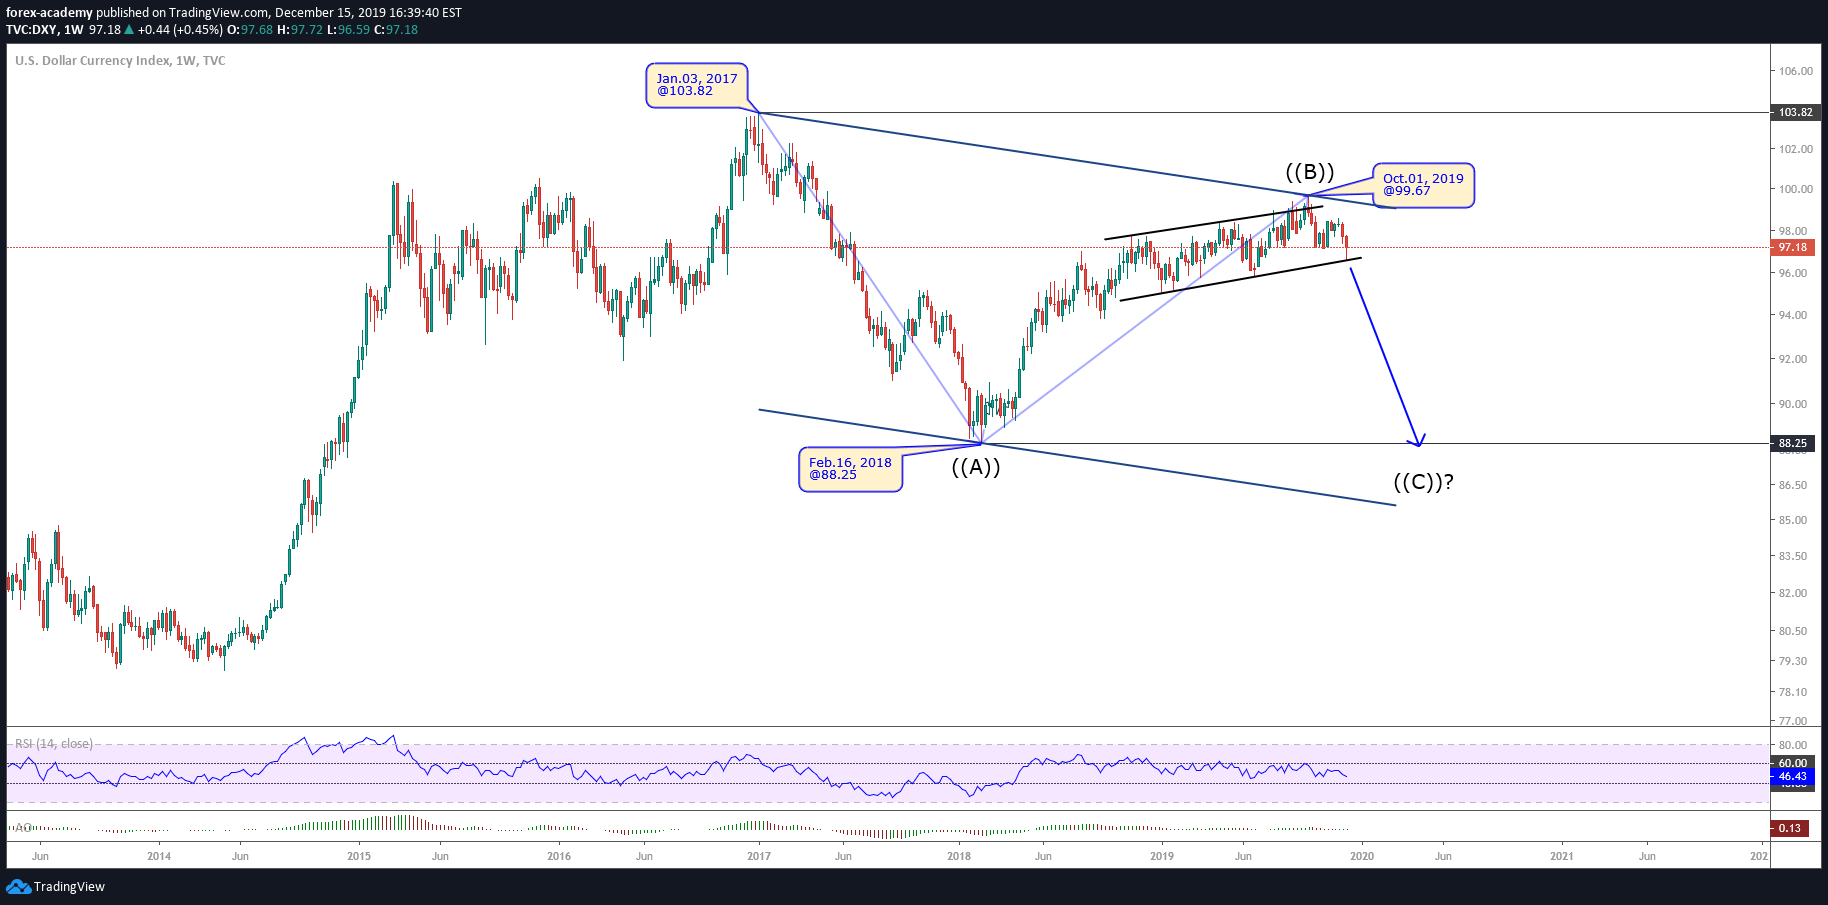
The value which was initially set at 100 would change considerably with time, as you can see from the image below. The DXY would in certain periods appreciate to 120, which only meant that the USD also increased by 20%. At some other points, we can see that the USD depreciated quite a bit, and it is also clear that, as the graph below demonstrates, the current value of the index is standing at just above 90. The mid-80s recorded an all-time high with the unbelievable value of approximately 160, while the lowest point was measured in the midst of the financial crisis in 2007/2008. Interestingly enough, some other events would often affect and propel these drastic shifts, such as the Latin-American crisis that caused the USD’s increase in the 80s. The financial crisis in the US when the USD was quite weak, for example, immediately pushed the oil and gas prices due to the well-known connection between the USD and the price of commodities. The USD was extremely weak and unfavorable at the time and other countries seemed to be booming to the extent that, as some may even remember, the US cab drivers or models desired to be paid in the EUR rather than their homeland currency. 

Currency trading is also vastly different from trading stocks owing to the fact that, due to the increase in population and inflation, the stocks inevitably go up in value. This bullish bias however does not exist in the world of currencies, and the DXY directly epitomizes the previously stated difference – although the index was initially set at 100, today it is below its starting point. This (roughly speaking) 7% discrepancy, if compared or 1973, clearly demonstrates how the currency market need not and does not follow the standards or trends of the equities market. Needless to say, trends are also an inherent part of the forex market as well, and traders desire to see the USD increase in value too, yet from the long-term perspective, the value of the USD remains more or less the same as it did several decades ago. Trading currencies is, hence, truly unbiased, unlike stocks.

Also, individuals interested in getting a quote on the USD can for example search for the Dow Jones index, which is based on approximately 30 stocks. Interestingly enough, as stocks are not true objects but prices, people can neither buy them nor always easily find quotes for such matters. Despite the indices/indexes being numerous, some may be increasingly more difficult to find quotes on. Furthermore, since the US regulations forbid trading the DXY in the country, traders can resort to some other legal options that function as an alternative to trading the US dollar index. Some of the common financial derivatives used to trade the US dollar index include the CFDs, futures, and options. 

CFD, or contract for difference, is one of the commonly used ways to trade indices, allowing those eager to trade the DXY to profit from price movements. Unlike other trades, the CFD trades typically involve much greater risk, as the price can easily go below zero and even farther, taking down traders’ accounts along with them. As CFDs contain leverage, traders do need to invest in trading psychology and money management skills to be able to weigh out their options and limit the chances of destroying their accounts. Those experienced in trading stocks and indices should also bear in mind that trading CFDs is unique and it is absolutely essential to study and demo trade them thoroughly. Other means of trading the DXY include futures contracts, which serve as a way for companies to offset risk and protect themselves from any future currency exchange rate changes or interest rate changes.

As we discussed above, traders may find it hard to find certain quotes although there are some indices, such as the S&P 500 for example, which are quite easy to access. If you are interested in the DXY, which is essentially a basket or a number derived from other values, you would need to insert the dollar sign before a quote, which signifies that it is an index. Therefore, anyone requesting a Dow Jones industrial average quote would need to put in the dollar sign and INDU. Websites are becoming more and more user friendly, and are becoming easier and easier to use even with respect to the insertion of adequate abbreviations. Real-time quotes are still harder to find in comparison to the delayed ones where interested parties may even need to pay some money. 

The DXY is also available as an ETF (Exchange Traded Fund) on the ICE exchange. ETFs track indices, dividing it into shares. In addition, ETFs function similarly to stocks, they do not have a net asset value, and their value fluctuates during the day owing to traders buying and selling activity. Although ETFs resemble stocks, they are not tangible objects but numbers. If a trader is searching for a real-time quote on the USD, he/she can use UUP, a symbol for an ETF, as a substitute for the USD. As a derivative of the DXY, it mimics its behavior, so if one goes up, the other one will follow. The ones interested in stocks who cannot find the S&P 500 index can also use the ETF index under the name of Spiders whose symbol is the in SPY (SPDR), whose movement resembles the S&P 500 as well. Therefore, if traders are looking to buy the DXY, they should know that it is practically impossible because it is an index.

Traders can, however, buy the UUP, which is considered a stock or they can look into futures with regard to index as well. Moreover, those who do not wish to get involved with the UUP can still trade the DXY but would need to do so through its derivatives or futures. This may not be particularly sensible to forex traders, but if any individual feels interested in these trades, they should know that they are in fact buying the percentages of the trades between the USD and other currencies we discussed above. 

What is also important to discuss is the changes that have occurred in the past and the ones we are expecting to see in the near future. Firstly, the year of the creation of the DXY is approximately half a century away from the present and the world has changed tremendously since then. We no longer have the currency basked as wide as before, for example, and the concentration is now found in one single currency (the EUR), which everyone finds to be the greatest flaw of the DXY. In addition, trading has completely changed between the US and some companies and countries such as China, Mexico, Brazil, and South Korea. The upcoming changes are still being discussed, especially during times of price dislocation. In 2007, this topic was quite prominent when the DXY was at its lowest, and it appears that the need for change always comes up when there is some distress with the price of the USD.

The DXY is hence quite likely to experience some changes in the future, yet this still should not affect forex traders. The USD is unlikely to change and this only concerns the USD against other currencies. The only value of the DXY is, therefore, found in its ability to reveal its overall performance. In terms of the USD’s general performance, we can easily look into the DXY, but we still lack other similar indices. We still lack a JPY index against the USD, the EUR, the GBP, and other currencies for example. These indices offer a great insight into these baskets which could be utilized to discover the strongest currency. That way we could tell which one is the fastest or which the worst one is, but despite the existing interest, this idea has still not been materialized for some reason. 

Although many complain about the uneven distribution of currency percentages of which the DXY is comprised, experienced traders even claim to have tried a number of different approaches and methods to get on top only to realize that, no matter what technical analysis they applied, there found absolutely no gain from struggling with the DXY. For example, although they paid close attention to the type of signals they would receive while choosing which USD trades to trade, they still discovered that too much energy and focus was taken away from making some other profitable trades. That way, those who attempted to make any use of the DXY found that their essential principles of trading were compromised, as they started to pass on good opportunities.

Losses may happen anytime, especially since they are an inherent characteristic of the forex market, but missing out on great opportunities to build one’s account and financial stability are generally considered one of the greatest faux pas in the market. Hence, if any trader is already invested in breaking down the strategy on how to employ the DXY in the best way possible, he/she should also strive to eliminate chances of overseeing prospects of winning. If your involvement with the DXY is taking too much of your time and attention, you should ask yourself if it is worth the effort. Simply put, the claims for changes are many and it is abundantly clear that traders are eager to see an evenly weighted USD Index and the creation of similar indices for other currencies as well.

Still, if you feel that your trading account is currently suffering because of your involvement with the DXY, it may be wise to wait for more prolific times and shift to more lucrative opportunities that the forex market is abundantly offering. If you are eager to keep exploring the DXY and what it can offer in trading, make sure that you invest as much as possible in learning about the different substitutes to standard trading which are legal in the US, employing money and risk management skills.

Categories
Forex Market Analysis

US Dollar Index Advances Boosted by Surprising Economic Growth

Overview

The US Dollar Index accelerated its gains on Thursday’s trading session boosted by the surprising economic recovery in Q3 2020 that advanced 33.1%, beating analysts’ expectations. Nevertheless, although Greenback’s intraday recovers, the price could see a new decline in the coming trading sessions.

Market Sentiment 

The US Dollar Index (DXY) raises on Thursday trading session by 0.54%, boosted by Q3’s GDP growth rate, which beat the analysts’ expectations.

The US economy expanded in the third quarter by 33.1% in Q3 2020, beating the analysts’ consensus of a 31% raise. This reading is the biggest expansion in the economy following the previous  Q2 period, which unveiled a record 31.4% plunge triggered by the coronavirus lockdown.

The following chart exposes the US Dollar Index in its daily timeframe. The figure unveils the 90-day high and low range, the price action moving mostly sideways in the bearish sentiment zone. 

Likewise, the intraday activity develops a strong bullish movement during its Thursday’s trading session, which looks accelerating, supported, as already said, by the surprising Q3 GDP growth, whose figure was released on Thursday before the US session’s opening bell. 

In summary, the US Dollar Index context shows that the big picture of the market is on the bearish side. However, the intraday activity reveals an upward thrust representing an upward correction of the Greenback’s primary bearish trend.

Technical Analysis Outlook

On the technical side, the US Dollar Index unveils its price movements in an incomplete corrective formation, which still could visit fresh lows.

The next weekly chart and in log scale reveals the DXY under the perspective of the Dow Theory, which exposes to its primary trend developing an incomplete correction of the rally that the Greenback began in early May 2011 and found resistance at 103.82 in late December 2016.

Once the Dollar Index found fresh buyers, the public activity raised, driving the price towards the level of 103.82, where DXY began to develop a corrective move, which remains in progress. The first decline fell to 50% of the previous rally, finding support at 88.25, where the price reacted, developing an upward sequence.

Actually, the price action develops a consolidation structure following a sideways formation, which is in progress since early January 2018. The third segment, which looks in place, accumulates a retracement of around 66% of the corrective formation’s second internal leg. This reading leads us to observe that the current decline could be in an exhaustion stage.

The long-term Elliott Wave perspective for DXY marks its advancement in an incomplete flat pattern (3-3-5), which currently advances in its wave C of Minor degree labeled in green. This current leg could see further declines in the coming trading sessions.

As illustrated in the next 2-day chart, DXY advances its wave ((iv)) of Minute degree identified in black. According to the alternation principle, the internal segment should take more time than wave 2. In this regard, the level of complexity of this corrective formation should be higher than on the second wave. In other words, the fourth wave could be a triangle formation or a double or triple correction.

Finally, the wave C’s potential bearish target can be located below the mid-February 2018 low; it is near the 87.5 level, where the Greenback could start to develop a new bullish cycle of upper degree. The invalidation level of the current bearish scenario is placed at 98.50.

Categories
Forex Market Analysis

US Dollar Index Consolidates Expecting Further Declines

Overview

The U.S. Dollar Index (DXY) develops a mid-term sideways formation inside a long-term bearish trend that looks incomplete. During this year, the Greenback sheds -4.31% (YTD). Although the positive inflation data expanded the price in Tuesday’s trading session, it was not enough to boost the price toward fresh highs.

Market Sentiment Overview

The U.S. Dollar Index (DXY) retreats 0.23% in Wednesday’s trading session by erasing the advance that the Greenback made on Tuesday, driven by inflation data, which exceeded surveyed analysts’ expectations reaching 1.4% (YoY).

Although the data released by the U.S. Bureau of Labor Statistics this Tuesday exceeded the expectations of market participants and Federal Reserve policymakers boosting the price to climb 0.53%, the reading observed would not have a greater impact on the rate decision of the next FOMC broad meeting. Still, it would be more focused on the evolution of the labor market.

The following chart illustrates the U.S. Dollar Index in its 12-hour timeframe. The figure exposes the 90-days high and low range, reflecting that the market participants’ sentiment remains on the extreme bearish side. The price action remains below the 200-period weighted moving average, confirming the bearish sentiment.

On the other hand, the last Commitment of Traders Report unveils institutional traders’ bearish bias, confirming the bearish sentiment exhibited by the U.S. Dollar Index.

Therefore, according to the Federal Reserve policymakers’ expectations, the labor market’s evolution could be a factor contributing to the U.S. Dollar Index volatility increase. On the other hand, as long as the price remains below 94.02 pts and below the 200-period average, the Greenback bias will remain on the extreme bearish side.

Technical Analysis Outlook

The U.S. Dollar Index, in its 4-hour chart, illustrates a sideways movement from a long-term bearish sequence, which seems to be incomplete. The mid-term sideways structure is limited by September 01st low of 91.75 pts, with a top of the sideways range at the level reached on September 25th, located at 94.74 pts.

The above figure shows that the mid-term trading range moves between 91.75 pts and 94.82 pts. This market context suggests that the currencies included in the U.S. Dollar Index basket might continue developing sideways movements in the coming trading sessions.

On the other hand, the Elliott Wave perspective overview reveals that the price developed a three-wave bullish movement from the September 01st low of 91.75 pts, which ended on 94.74 pts.

Currently, the DXY index develops a pause formation in a bearish sequence that could evolve in three waves. This consolidation structure identified as wave ((b)) in black is still in progress.

Accordingly, the U.S. Dollar Index should complete the consolidation movement identified by the short-term sideways channel before continuing with its mid-term bearish trend.

Categories
Forex Market Analysis

US Dollar Index Analysis – Is Preparing for a New Decline?

The US Dollar index (DXY) seems to be turning its market sentiment from bullish to bearish. The currency basket index against the US Dollar exposes bearish signals that lead us to anticipate a bearish outlook for the mid-term.

The Big Picture and Market Sentiment

The big picture of DXY in its weekly chart unveils that the price action continues moving by the sixth consecutive week below 50% of the 52-week high and low range, which carries us to suspect that big market participants could keep pushing lower the Greenback. During this year, the US Dollar index reports an advance of 0.16% (YTD),  dropping from 6.72% reached on March 19th when DXY reached its yearly high at 102.99.

In the previous chart, we distinguish the net positions between institutional traders (or speculative positions) in green, versus the net positions of commercial traders in red. The net positioning reveals that speculative traders are turning their bias to the bearish side; however, this doesn’t imply that DXY will plunge in the short-term.

Elliott Wave Outlook

The mid-term Elliott wave perspective for the US Dollar Index exposed in its 8-hour chart illustrates an incomplete bearish cycle that began on March 19th once the index found fresh sellers at 102.99.

In the above chart, we observe the first bearish movement identified as wave ((a)) or ((i)) of Minor degree labeled in black reveals a strong bearish momentum, which leads us to suspect that it could correspond to the first movement of a zigzag pattern or an impulsive sequence.

Once DXY had completed its first downward movement, it started a corrective sequence that at a first stage looked like a triangle formation (subdivided into 3-3-3-3-3 internal segments); however, the corrective structure corresponds to a regular flat pattern (divided into 3-3-5). This correction ended on April 24th when the price topped at 100.87 pts and give way to a new downward move corresponding to wave ((c)) or ((iii)), which remains in progress.

The third bearish structural series, which remains in progress, reveals that the price action currently develops an expanding triangle pattern. This formation follows an internal sequence subdivided into 3-3-3-3-3.

On the other hand, in the last chart, we observe the RSI oscillator moving below the 60-level, which confirms the bearish bias that the US Dollar index maintains and, in consequence, doesn’t exists any trend reversal signal so far.

Our outlook for the coming weeks for the US Dollar index foresees a limited upward movement, which could surpass the end of wave c slightly, labeled in green, at 97.80. The end of the wave e could coincide with the descending trendline. Considering the expanding triangle nature, we could expect a volatile movement in the current upside, which could imply the development of a bullish trap. Once completed this upside, the Greenback should resume its downtrend falling into a five-wave sequence.

Categories
Forex Elliott Wave Forex Market Analysis

Dollar Index Long Term Wave Analysis

The US Dollar Index (DXY) from last October shows signs of exhaustion of the bullish cycle that started in February 2016. What says us the Elliott Wave Principle about the next path of the US Dollar? In this article, we will discuss what to expect for the Greenback.

Fundamental Perspective

The Federal Reserve, during the last FOMC meeting, realized on December 11, decided to keep the interest rate at 1.75% by letting it unchanged for the second consecutive month.

The FED’s Chairman Jerome Powell, in his latest statement, indicated that the current monetary policy is adequate to sustain the expansion of economic activity in the United States. On the other hand, the labor market conditions remain stronger, and inflation continues in the 2% target.

In its projections for next year, the committee members do not visualize any further cut changes in the reference rate.

Technical Perspective

Dollar Index (DXY), in its weekly chart, shows the price action developing a downward corrective structure. This bearish structure began on January 03, 2017, when the DXY reached the level 103.82.

Until now, DXY has carried out two internal waves, which we identified as wave ((A)), and ((B)) labeled in black. In the weekly DXY chart, we observe that wave ((A)) progressed in five waves.

According to the Elliott Wave Principle, the formation developed by DXY should correspond to a corrective structure that presents the characteristics of a zigzag pattern. A zigzag formation is characterized by a 5-3-5 internal sequence.

The graph below shows the daily DXY chart, which reveals a bullish sequence that develops into three internal waves, labeled in blue as (A), (B), and (C), which corresponds to the complete movement of upper-degree, identified as wave ((B)).

Likewise, we recognize how the price developed a structure in the form of an ending diagonal, that in terms of the Elliott Wave Theory, appears typically in waves “5” or “C.”

On the other hand, the pierce and closing below the August 2019 low at 97.17, make us suspect that the price could be making a change from the upward cycle started in February 2018 to a downward trend.

This movement could start the third internal move of the corrective wave, which should be developed in five waves.

Our Forecast

The 4-hour chart shows DXY has completed its first bearish motive wave labeled as (1) in blue. Once its five internal segments has ended, the price bounded off from the level of 96.59 on December 12.

Short term, we expect a bullish rebound in three waves that could reach the zone between 97.94 and 98.44. From this zone, the Greenback could find sellers waiting to activate their short positions.

The long-term target is located in the zone of the 90 points as a psychological round-number level. Further, this zone is the area of the 2018’s lows. This target area coincides with the lower line of the downward channel.

The invalidation level of the bearish scenario is located at level 99.67, which corresponds to the highest level reached in early October 2019.

Categories
Forex Elliott Wave

Dollar Index and the Alternation Principle

In our article “Impulsive Waves Construction – Part 1,” we introduced the concept of “alternation.” In this educational article, we’ll apply this concept to the Dollar Index Analysis.

The Alternation Principle

Just as the Wave Principle obeys a law, alternation is also the law of nature. We can observe this law both in the universe as human activities. Just as the seasons of the year or the phases of the Moon alternate, socio-economic activities also alternate.

There is probably no other activity that has devoted as many resources to its study as financial markets. An example where we can observe the principle of alternation is in the U.S. Dollar Index.

Application in the Dollar Index

The U.S. Dollar Index (DXY), in its daily chart, illustrates the bullish sequence he developed since it found buyers on February 16, 2018, and drove to the price from 88.25 until 99.67 on October 01, 2019.

From the chart, we can observe how DXY performed the rally in two stages. In each phase, we see how the advance alternates in both price and time. In particular, the first rally was run in 180 days and advanced by about 9.9%. The second tranche lasted 376 days and increased by 6.22 percent.

Our reader can observe the same situation in the daily chart of the EURGBP cross, which was discussed in the educational article “How to analyze a fast market using the Elliott Wave Principle.”

Looking at the second chart, our reader can appreciate how price and time alternate their relationship in the EURGBP cross.

Alternation and the Analysis Process

An approach to simplify the analysis process consists of identifying different parts of the movement developed by the market and analyze it part by part. The next DXY daily chart illustrates this process.

The following 4-hour chart exposes the advance developed by the Dollar Index once it found buyers at level 88.25.

From the chart, we observe a first impulsive upward movement labeled ((i)) in black, which developed five waves of a lesser degree. Once DXY completed the first wave, the price corrected by a wave ((ii)), which is divided into three internal segments labeled as (a), (b), and (c) in blue.

Within the corrective structure, alternation over time can be distinguished. For example, the wave (a) in blue ended in 23 bars, the wave (b), in turn, was developed in 57 bars. Finally, the wave (c) took 26 bars to finish. This time difference reflects the principle of alternation in terms of simplicity and complexity of each segment that composes the price movement.

The following chart shows how the action of the price alternates in the waves (ii) and (iv) in blue. In the wave (ii), the corrective movement of DXY developed in 43 bars, while the wave (iv) was completed in only 19 bars.

Conclusions

Based on the case studied, we can recognize how the principle of alternation is reflected in the financial markets and different temporalities. This application in different time frames allows us to identify the concept of “market fractality.”

On the other hand, we can observe how the market alternates not only in a price dimension but also in time. In other words, the progress of the market must be studied concerning both price and time.

Finally, if the range of a movement is narrow and has a relatively long duration, the next move will likely be broad in terms of price motion and shorter in length.

Categories
Forex Market Analysis

Weekly Technical Overview

US Dollar Index


US Dollar Index is resuming its bullish trend. Nevertheless, even though it has left behind many resistances now it is facing a horizontal resistance that will decide whether it creates a double top or breaks it and continues its run. For now, we wait to see its reaction the following week.


EURUSD


EURUSD has been moving sideways recently, mostly due to the uncertainty of the trade war between China and USA. However, in the upcoming days it should resume its bearish trend without any support ahead in the near term.


DAX


After weeks of moving sideways and without a clear direction, both fundamentals and technicals give positive reasons to be bullish at the indexes. Not only that the macroeconomic figures are forecasted to be strong but so are the quarterly results from both European and American corporations. Hence, we reopen a bullish position looking to profit the upcoming bull market.


GBPUSD 


GBPUSD is beginning the bearish trend we were waiting for. However, there is still a long way to go until it reaches the profit target. It can either resume the bearish trend or start moving sideways due to uncertainty. The next few weeks will be key to watch what happens both fundamentally and technically. For now, we remain bearish.


USDJPY


After weeks of waiting for the breakout, it is finally confirmed. Open positions have been opened waiting for the continuation of the bullish trend. It can either continue or do a retest which will eventually lead to a stronger confirmation of the breakout and the beginning of a bull run.


US Oil


Between resistances and supports there is not a clear path for oil prices apart from the many fundamental variables surrounding it. For now remain neutral awaiting a clear signal.


Categories
Forex Market Analysis

April 23 – 27: Top 2 Setups to Watch This Week – Dollar Index & Nikkei In Focus!

In this update, we will discuss fundamentals & technical setups, that are worth watching during the coming week. On Friday, the US dollar climbed to a two-week high vs. a basket of currencies as risk-off sentiment wanes.


US Dollar Index – Double Top Resistance

The Dollar Index soared dramatically after breaking a trendline resistance level at 89.70. Most of the buyers entered the market for two reasons:

Firstly, the single currency Euro fell sharply to a two-week low vs. the greenback as the European Central Bank (ECB) is due to release its monetary policy decision in the coming week (on April 26) and traders seem to price in the dovish monetary policy. A drop in Euro is driving more bulls to the US Dollar.

Secondly, the investors switched their investments from pound to the greenback after the Sterling extended losses in the wake of dovish remarks from the head of the BOE (Bank of England).


Dollar Index – Forecast

Technically, the index is overbought (RSI above 70) and bulls are exhausted. We may see a retracement up to 90 and 89.75 before seeing another bullish wave in the dollar. On the upper side, Dollar index can face a solid resistance near 90.55 and 90.85.

Nikkei 225 – Shooting Star Pattern In Play

The Japanese stock market index Nikkei gave up 0.1% to 22,162.24. The index grew 1.8% this week, its fourth straight weekly gains. However, the markets remained muted on Friday as investors didn’t find any solid reason to trade the Nikkei. But they do have it for the coming week.

The BOJ (Bank of Japan) is scheduled to release the monetary policy report on April 27. Investors appear to save their shots before the release of the policy rate. BOJ is widely expected to keep the interest rates on hold at -0.10%.

Nikkei 225 – Forecast

The Japanese index Nikkei is trading below a double top resistance level of 22,380. The leading indicators RSI and Stochastics are moving in the overbought zone and signaling a potential for a bearish reversal. Moreover, Nikkei has formed a shooting star below 22,385 which is signaling a neutral sentiment of investors. The breakout of 22,385 can lead the index to next resistance level of 22,985 and 24,000. Whereas, the support remains at 20950.

© Forex.Academy

Categories
Forex Market Analysis

EZ Economic Sentiment Plunges To Its Lowest Level Since 2016

Hot Topics:

  • EZ Economic Sentiment plunges to the lowest level since 2016.
  • Pound falls after unemployment rate release.
  • Dow continues advancing with all eyes on the 25,000 pts level.
  • Expecting the Crude Oil Inventories data release.
  • Limited down movement before BoC MP decision.


EZ Economic Sentiment plunges to the lowest level since 2016.

The Eurozone ZEW Economic Sentiment in March dropped to 1.9, the lowest level since July 2016. The ZEW President Achim Wambach said, “The reason for this downturn in expectations can mainly be found in the international trade conflict with the United States and the current situation in the Syrian war.” 

Once the sentiment data was released, the common currency reacted dropping 0.25%. As we have envisioned, the Euro dropped from the blue box.

In the European stocks market, the German index DAX 30 continued its rally closing the session with a gain of 0.99%. The index is moving in an ascending channel; the price could still reach new highs until the 12,702 – 12825 area before starting a potential corrective move.

At the same time, the Dollar Index climbed from 88.94, the 3 weeks lowest level, advancing to its short-term pivot of 89.36. The price still is bouncing from the Potential Reversal Zone (PRZ). Invalidation level is in 88.52 level.


Pound falls after unemployment rate release.

The unemployment rate in March fell 4.2%, the lowest level in more than four decades. The GBPUSD pair plunged 0.31% from the highest level of the year. On the technical side, the pound has made a false breakout reaching 1.4376 and falling sharply below 1.43. We are now expecting a setup as a 1-2-3 pattern before we look to sell the pair.


Dow continues advancing with all eyes on the 25,000 pts level.

In the middle of the big companies earnings release, Dow Jones continued advancing, breaking up our key resistance level of 24,625 closing the session with gains of 0.59%. Our central vision is bullish with the target placed at the 25,407 level.

As result of the market risk on sentiment, the USDJPY has moved above our invalidation level (106.61), bouncing in the Potential Continuation Section (PCS); closing the session at 107.0, maintaining the bullish bias with the target placed at 108.41 level.


Expecting the Crude Oil Inventories data release.

Today, the weekly Crude Oil Inventory data released by the EIA is expected. On the technical side, the price is making a bullish channel in five movements. We estimate that Crude Oil could reach the 67.86 – 68.75 area where sellers could enter in action with their targets placed at 64 $/barrel.


Limited falls before BoC MP decision.

The most expected release for this session is the interest rate decision from the Bank of Canada. The analysts’ consensus expects that the BoC will keep its rate unchanged at 1.25%. Our vision is that the loonie could make a new low to the 1.2499 level, where it could find new buyers with their target at 1.274.

Categories
Forex Market Analysis

Dollar Index Drops, Sterling jump to its max, Wall Street is moved up by Earnings

Hot Topics.

  • Dollar Index drops despite the increase in Retail Sales (MoM) in March.
  • Sterling strikes the highest level of the year for a second time.
  • Japanese Cabinet says the economy is “recovering moderately.”
  • Watching the Copper bullish cycle.
  • US Indexes climbs are boosted, aided by the companies earnings reports.

Dollar Index drops despite the increase in Retail Sales (MoM) in March.

The US economy continues showing strength signals about its economic growth. This time it was the retail sales report shift that advanced up 0.6% from February 2018 and 4.5% (YoY). Sales from the vehicle and parts dealers boosted 2% in March. Despite this good news, the US Dollar Index fell 0.40% touching its PRZ. While the price continues above the 88.52 level, we will consider the chance of a new bullish cycle.

The Euro, which represented more than 50% of the Dollar Index, closed the session with 0.41% gain. The pair still has almost 40 pips of space to reach its PRZ, previous to the ZEW economic sentiment data release. Meanwhile, the Index still could maintain its trading range. The invalidation level of the reversal scenario is above 1.2476.


Sterling strikes the highest level of the year for a second time.

The Pound is the best performing currency of the year with an advance of 6.24% (YTD). Not even the uncertainty driven by the Brexit negotiations or the negatives consequences of the severe weather conditions that have impacted some sectorial economic indicators have been enough to slow the Pound rally. In our last Daily Update, we saw a potential top and reversal pattern; our vision is that we could witness a 2B Pattern. In this case, we will be attentive to a breakout candle before to pulling the trigger.


Japanese Cabinet says the economy is “recovering moderately”.

The Cabinet Office of Japan described Japan’s economic growth as a “recovery at a moderate pace”. The private consumption and business investment in exports are “picking up”. Concerning the tariffs tensions between the US and China, the Cabinet economists see it as a risk factor they will observe closely. The USDJPY pair fell 0.31% to our PCS (Potential Continuation Section) as a bearish wedge pattern. If the price remains above 106.61, our vision continues to be bullish.The Pound/Yen cross is testing the second monthly resistance pivot level; however, it still could make new highs before a deeper correction. Our vision is that the cross could climb to the area between 155.8 – 157. Selling positions are considered only if the price breaks below the 152.95 level.

Watching the Copper bullish cycle.

Copper is developing a bullish cycle since January 2016. It is currently in an ascending expansive triangle pattern. In the long term, the red metal has “market debt” in the 3.44 level. In the short-term, as long as the price keeps above 2.98, the trend is bullish. If the price moves down to 3.01 – 3.03, copper could find new buyers at those levels, with their targets at around 3.20 – 3.21 and its extension in the 3.25 – 3.28 area.

US Indexes climbs are boosted, aided by the companies earnings reports.

This week,  the big companies started their quarterly earnings release. The optimistic analysts’ expectations came under the assumption that results are coming mainly from activities made before the tariffs conflict between the US and China. Dow Jones 30 closed the first trading session of the week with an advance of 0.44%. The Dow is testing the key level 24,620 and we are watching from our short-term picks. The invalidation level is below 24,090.

In the same way, Nasdaq 100 closed the session advancing 0.43%. The Technological Index is moving in an ascending triangle pattern. Mid-term, we expect that the price will hit the 7,090 level. The invalidation level for the bull market scenario is below 6,398 pts.

© Forex.Academy


Categories
Forex Market Analysis

Is The USD Poised To Drop Further?

The US Dollar remains under selling pressure versus the other major currencies, even if the Federal Reserve has decided to increase the Federal Funds Rate again in March. The greenback posted some gains against its rivals in the last weeks, but I’m afraid that the rebound has ended because the USDX is showing some exhaustion signs in the short term.

The Dollar could drop again as the dollar index has failed to stay higher and to make new highs. USDX is trading at 89.77 level and looks undecided on the short term. It is moving sideways, but the bearish bias remains intact as the rate is located much below some very strong resistance level.

USD increased significantly only versus the Yen and versus the Swiss Franc in the last days and remains to see if the pairs will have enough energy to make new highs. The USD needs a strong support from the United States economic data in the upcoming period to be able to dominate the currency market again. This scenario is less likely to happen.

us dollar drop

I’ve added the USDX’s Daily chart to show you why the USD could drop again and what are the other perspectives. The index has found strong support at the 50% Fibonacci line (descending dotted line). It has made several false breakdowns below this dynamic support. The minor rebound was natural and expected.

The dollar index moves in a range in the short term. It remains to see if this will be an accumulation or a distribution movement. Price failed to reach and retest the 91.01 static resistance and the first downtrend line (DT1) signaling a selling pressure. It seems like that the USDX is developing a Falling Wedge pattern on the Daily chart, but I’m not very confident that the price could make a valid breakout at this moment.

The failure to approach and reach the median line (ML) of the major descending pitchfork could send the rate towards the 50% Fibonacci line again. A further US Dollar drop will force the greenback to lose more ground versus all its rivals.

us dollar forecast

I’ve added another chart to show you what happened in the last weeks. Technically, the USDX is somehow expected to drop after the failure to stabilize above the 50% Fibonacci line (ascending dotted line). You can notice that the rate has failed to reach this line in the last attempt and now is expected to reach the lower median line (lml) again.

A valid breakdown below the lower median line (lml) will confirm a further drop and a USD’s further depreciation. Only a rejection from the lower median line (lml) or a false breakdown will announce another upside momentum.

Conclusion

The USD’s future will be decided by the dollar index in the upcoming period. USDX is narrowing, so we should wait for a breakout from this range to see the direction. The USD wasn’t too impressed with the US Retail Sales data today. The indicator increased by 0.6%, beating the 0.4%, but the dollar stays lower as the USDX plunged in the last hours.

Categories
Forex Market Analysis

What kind of trigger could boost the Dollar?

Hot Topics:

  • What kind of trigger could boost the Dollar?
  • Will the Eurozone continue to bring weaker economic data?
  • Could the UK CPI have reached their peak?
  • Fear of a new war or do we expect a new bearish leg?
  • A new higher high in oils is expected before it starts a corrective move.
  • Downward continuation limited before the BoC decision.

What kind of trigger could boost the Dollar?

The recent tensions originated by the strike made between the US, UK, and France on Syria and the reactions of Russia condemning the act could continue to increase the volatility in the markets. Another triggering factor could be the one originated by the US Retail Sales, which fell in February -0.1%. In March the analysts’ consensus is expecting an increase near to 0.4%. In technical terms, the greenback is still in a range and could be making a bottom formation. The control levels are 88.66 to 89.16. Invalidation level is below 88.1.


Will the Eurozone continue to bring weaker economic data?

This week the Germany and Eurozone ZEW economic sentiment reports were released. Particularly, the level of confidence fell to 13.4 in February from 29.3 reported in January. Probably it could be produced by a stational factor, like the weather conditions (winter time). In the panoramic chart, we are watching the current structure, as a corrective formation that could reach new lows in the 1.196 – 1.20 area. The invalidation level is above 1.2476.


Could the UK CPI have reached their peak?

In the last months, the British CPI apparently reached their peak, with a CPI of 3.1% (YoY) reported in the past year in November. Then in December and January, it achieved a 3.0%, but in February in line with other activity indicators, it has shown a decrease in the economic activity. It is probable that at these levels we are witnessing a stabilisation of the economic activity. In the same way, on the chart, we are watching a potential top pattern as a mother wave that could initiate a new bearish cycle with a target at the base of the sideways channel. The invalidation level is above 1.4345.


Fear of a new war or do we expect a new bearish leg?

The Japanese currency is moving in an ascending diagonal pattern in search for its long-term 108 level resistance. Despite the US attacks against Syria, the price continues moving according to our vision. We expect to find sellers once the price strikes the 108.2 – 108.4 area,  starting a new bearish leg.

The correlation between the Nikkei 225 and the USDJPY pair, bring us a clue about the moves that it could make. The first scenario is a breakout above 21,957 pts for a bullish continuation move, drawing the 22,764 – 23,050 area as a target. In the second scenario, if the price moves making a new bearish leg, we expect that move to reach the 20,660 zone, making a “mother wave”  and starting a new bullish cycle.


A new higher high in oils is expected before it starts a corrective move.

Last week the oils, Brent and WTI, reached their highest levels since 2014. For inverse correlation and as it was envisioned by us on January 12th, the Crude Oil VIX ETF reached the Potential Reversal Zone, where it might start a bullish cycle. In practical terms, once the WTI reaches the 67.8 – 68.7 area, it is likely that it begins a corrective move.


And concerning Brent Oil, we could see it at a new high, to 72.9 level,  before it starts a falling move.

Falls continuation is limited before the BoC decision.

Next Wednesday 18th the Bank of Canada (BoC) Monetary Policy Meeting will take place. The analysts’ consensus expects that the decision will maintain the interest rate at 1.25%. The price is making a downward cycle since March 19th, and our vision is that the Loonie might fall to the area between 1.245 – 1.254, where it could start an upward move, at least up to 1.274. The invalidation level for the ascending movement is 1.225.


Categories
Forex Market Analysis

Euro Plunges on Weak European Industrial Production data

Hot Topics:

  • Euro plunges by weak European Production Industrial Data.
  • The Pound is near to our control zone.
  • Bank of Japan’s Sakura Report: household spending and robust exports are aiding recovery.
  • Crude Oil is consolidating above $66.
The Euro plunges by weak European Industrial Production data.

Weak industrial production data in the Eurozone has triggered a 0.41% drop in the Euro, during today’s session, as we were expecting in the last Daily Update. Industrial production (YoY) fell from 3.7% in January to 2.9% in February, well below the mobile quarterly average of  3.97%.

The weak data published was mainly due to the reduction in the production of intermediate goods, capital goods, and durable and non-durable consumer goods. The common currency could go back to test the medium-term uptrend line. The support level to be controlled is 1.225 (For full resolution, click on the chart).

The German Index DAX 30 advances 1.08% within a tight upward channel, despite the weak European industrial production data.  In the case of overcoming the resistance at 12,476.8 pts, the price could take us to the 12,702.42 – 12,825.92 area.

In the case of the Dollar Index, which advanced 0.36%, we will wait to see how it behaves around 89.36 and 89.03 levels, from which we could validate a reversal of the uptrend. The invalidation level remains below 88.52.

The pound is near to our control zone.

The sterling closed the session yesterday with an advance of 0.37%, approaching the levels that we see as a potential reversal zone (PRZ) that could extend even below to 1.427. From the raised area, the pound could begin to develop that bearish move as a new bearish leg.

Bank of Japan’s Sakura Report: household spending and robust exports are aiding recovery.

In their quarterly report, the Bank of Japan (BoJ) concludes that six regions reported their economy had been expanding or expanding moderately, and three regions had continued to recover moderately.

In general terms, household income is increasing moderately as the labour market conditions had continued to tighten continuously. In this macroeconomic context, Kuroda reports that the BoJ will continue with the bonds purchase program to stimulate economic growth.

On the technical side, the USDJPY pair is gaining bullish momentum that could lead us to the 108.2 – 108.5 area. The relevant resistance level is 107.48; invalidation level is at 106.61.


Crude Oil is consolidating above $66.

After reaching its highest level since 2014, crude oil is consolidating close to the $66 level. Following the rally that took place on April 06th, we expect the consolidation to be relatively extensive, so we should wait for a more discernible scenario to take positions in favour of the prevailing trend.

The USDCAD/oil correlated pair is consolidating between 1.2544 – 1.2623, in the same fashion that Crude Oil is doing. By inverse correlation, we expect that the Loonie makes a reversal pattern between 1.2540 and 1.246. The invalidation level for the reversal move is below 1.2250.

Another energy commodity correlated with the USDCAD pair is Natural Gas, which is making a complex corrective structure that could make a new low between 2.522 – 2.260 before it finds buyers.

Categories
Forex Market Analysis

Dolar Index closes bearish helped by mixed CPI data

Hot Topics:

  • Dolar Index closes bearish helped by mixed CPI data.
  • EUR-USD is losing momentum.
  • Manufacturing Production (YoY) falls, and pound closes slightly upward.
  • BoJ – Kuroda keeps the promise of monetary policy.
  • Crude Oil climbs to the highest level since 2014.

Dolar Index closes bearish helped by mixed CPI data.

The index of the greenback yesterday closed down 0.04%, finding support at level 89.03 weighed down by mixed inflation data. On the one hand, Core CPI (YoY) rose to 2.1% in March from 1.8% registered in February. On the other side, the Consumer Price Index CPI (MoM) fell to -0.1% in March, while in February it recorded an advance of 0.2%. We continue to observe the lateral range in which the price is with a bearish bias. (Click on the chart for full resolution).


EUR-USD is losing momentum.

The pair of the single currency is losing momentum, in the fourth consecutive trading session, the euro advanced 0.10% finding resistance at 1.2395. In an interview with Reuters, the ECB lawmaker Ardo Hansson said that the ECB “needs to be patient and eliminate its stimulus very gradually.”

Although the ECB has kept the interest rate at low levels and has maintained its policy of buying bonds, lawmakers are debating that it is time to start cutting this policy. ECB legislator Ewald Nowotny, meanwhile, said he would have “no problem” in raising the deposit rate from -0.4% to -0.2% as a means to normalise monetary policy.

In this macroeconomic context, the euro is reaching a key area in the range 1.2412 – 1.245. Should not exceed the level 1.2476, the pair could make a new bearish leg. In the long term, we still have our eyes on 1.26 as the end zone of the EUR / USD bullish cycle.

Manufacturing Production (YoY) falls, and pound closes slightly upward.

Manufacturing Production (YoY) fell to 2.5% in February well below the consensus that estimated an advance of 3.3%. The sector that was most affected was the construction sector with a decline of 1.6% in February. The National Statistics Office attributes to a large extent these low figures to the effect of severe weather.

On the technical side, we are observing a possible corrective process that could begin to be developed from area 1.42 – 1.425 with a potential level of invalidation in over 1.4345 coinciding with the highest level of the year.


BoJ – Kuroda keeps the promise of monetary policy.

The Governor of the Bank of Japan, Haruhiko Kuroda, reiterated his optimistic view on the expansion of Japan’s economy, affirming that “With the improvement of the product gap and the medium to long-term inflation expectations observed, we expect that inflation will accelerate as a trend and go to 2 percent. ”

On a technical level, on the one hand, the USD-JPY is still in a limited lateral range between 106.64 and 107.49, the predominant bias is bullish and increases its probability of strength as it closes above 108. The level The invalidation of the bullish sequence is 105.66.

On the other hand, by a positive correlation concerning USDJPY, we see in the Nikkei 225 Index within a long-term bearish pattern developing an ascending diagonal formation, which in case of exceeding 21,957 could lead to exceeding 22,500 pts.


Crude Oil climbs to the highest level since 2014.

First, it was the turn of the Brent oil; now it is the turn of the Crude oil that has climbed to the highest levels since 2014, reaching 67.36 US $ / Barrel, while the Brent oil climbed to new highs reaching $72.69.

For the Brent Oil, although the trend is bullish, the closest resistance is $72.91, while the level of invalidation of the bullish cycle is below $67.

As with the Brent Oil, the Crude Oil is in a free climb up to $ 70.7 as long as it remains above the $64 level.

On the opposite side, by inverse correlation, the Loonie remains in free fall with a target at the base of the bullish channel, the impact zone could be between 1.2456 to 1.235.


Categories
Forex Market Analysis

Hot Topics – December 18 to 21, 2017

Hot Topics:

  • US DOLLAR – THE BEARISH BIAS DUE TO TAX REFORM CONTINUES.
  • GBP-USD – BREXIT NEGOTIATIONS AND ECONOMIC GROWTH DRIVES STERLING.

This past week presented significant advances for the New Zealand dollar with a 2.25% advance, due mainly to the weak inflation data (YoY) shown by the American economy (1.7% vs. 1.8% expected). The increase of the interest rate by the FOMC was not enough to reverse the advance of the Kiwi.

The worst performance of the week was exhibited by the British Pound with a -0.41% loss. The BoE decided to keep the interest rate at 0.5% in the context of an increase in unemployment for a second consecutive month, reaching 4.3%. On the other hand, inflation (YoY) scored a 3.1% advance, the highest level for almost six years; specialists believe that CPI is reaching a peak and that it could mainly impact the cost of the services sector.


 US DOLLAR – THE BEARISH BIAS DUE TO TAX REFORM CONTINUES

Dollar begins a bearish week in the context of uncertainty over the approval of tax revision legislation with the aim of making American companies more competitive.

The Republican Senator Bob Corker has expressed concern about the fiscal deficit that can result from the tax cuts. Despite having a position in favour of the tax review, doubts remain in the approval of the reform, in the same way that the Senate rejected the Trump Administration’s proposal to suppress Obamacare last July.

The Greenback has broken the bullish guidance that has reached S3; there is a possibility that it will develop a bullish reversal movement up to the weekly pivot level. You can find more information in our article Finding Trade Opportunities Using Pivot Points.


GBP-USD – BREXIT NEGOTIATIONS AND ECONOMIC GROWTH DRIVES STERLING.

Economic growth and negotiations for Brexit continue to be the primary drivers of the Sterling. On Wednesday, the governor of the BoE will address the Parliament in the context of the hearing of the Select Committee of the Treasury on the November Financial Stability Report.

The British Prime Minister, Theresa May, has assured the Parliament that she is looking for the Brexit transition to be completed within two years. The first phase of the Brexit negotiations has been on the rights of EU citizens in Britain. EU members have agreed to move to the second stage, which focuses on the transition and future commercial relations. The British Parliament has urged May to stand firm in the interests of the United Kingdom, such as a previous Prime Minister, Margaret Thatcher.

Technically, the Pound is developing a corrective structure, with a bias for bullish continuation. The RSI shows a bullish divergence; however, we expect a retracement towards the weekly pivot zone and then continue with the bullish movement in the medium-long term.

 EUR-USD – CORRECTIVE STRUCTURE IN DEVELOPMENT

The single currency is developing a corrective structure; the RSI has not yet shown evidence of rupture. We expect the price to make a bearish movement in five; that means, the euro could move up to R1 and then fall to S2, thus completing a five-wave sequence.


 USD-CAD – LOONIE CONTINUES IN A SIDEWAYS RANGE MOVEMENT.

The Loonie continues in a sideways range formation, waiting for data to act as a catalyst. Most probably, the previous movement will continue to R2 (1.30 level). The RSI is forming a triangular structure that is finding resistance at level 60. The bullish bias still prevails, with the average of 9 periods under the RSI.


 NZD-USD – A PENNANT THAT COULD BE A PAUSE OF A NEW RALLY.

Last week, the Kiwi was the best currency performer with a 2.25% increase against the USD. This week it is developing a pennant pattern, manifesting a pause with further continuity of the bullish movement. The RSI, on the other hand, is forming a corrective structure. We expect a false move towards the weekly pivot, and then, continuing the upward cycle to the zone of R2 (0.715).