
In our article “Impulsive Waves Construction – Part 1,” we introduced the concept of “alternation.” In this educational article, we’ll apply this concept to the Dollar Index Analysis.

The Alternation Principle
Just as the Wave Principle obeys a law, alternation is also the law of nature. We can observe this law both in the universe as human activities. Just as the seasons of the year or the phases of the Moon alternate, socio-economic activities also alternate.
There is probably no other activity that has devoted as many resources to its study as financial markets. An example where we can observe the principle of alternation is in the U.S. Dollar Index.
Application in the Dollar Index
The U.S. Dollar Index (DXY), in its daily chart, illustrates the bullish sequence he developed since it found buyers on February 16, 2018, and drove to the price from 88.25 until 99.67 on October 01, 2019.
From the chart, we can observe how DXY performed the rally in two stages. In each phase, we see how the advance alternates in both price and time. In particular, the first rally was run in 180 days and advanced by about 9.9%. The second tranche lasted 376 days and increased by 6.22 percent.

Our reader can observe the same situation in the daily chart of the EURGBP cross, which was discussed in the educational article “How to analyze a fast market using the Elliott Wave Principle.”
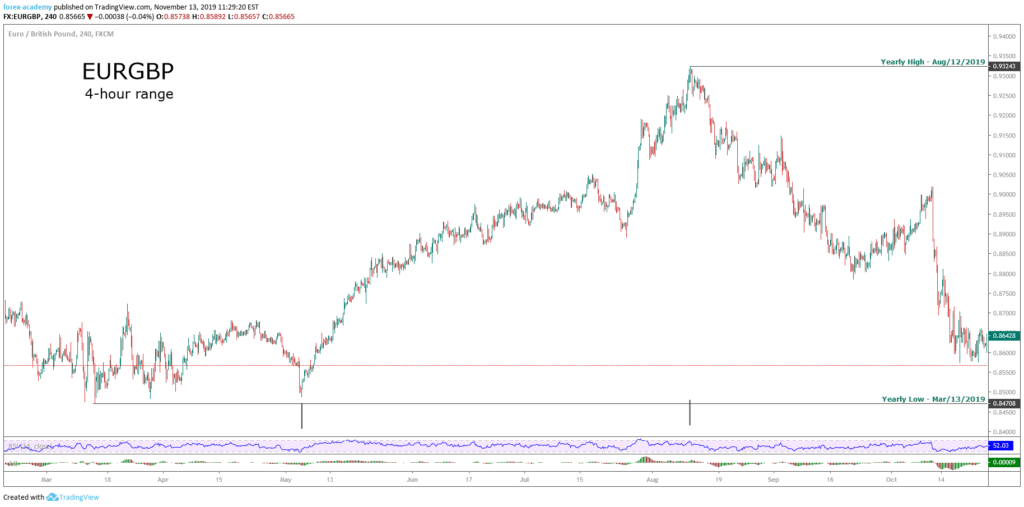
Looking at the second chart, our reader can appreciate how price and time alternate their relationship in the EURGBP cross.
Alternation and the Analysis Process
An approach to simplify the analysis process consists of identifying different parts of the movement developed by the market and analyze it part by part. The next DXY daily chart illustrates this process.
The following 4-hour chart exposes the advance developed by the Dollar Index once it found buyers at level 88.25.
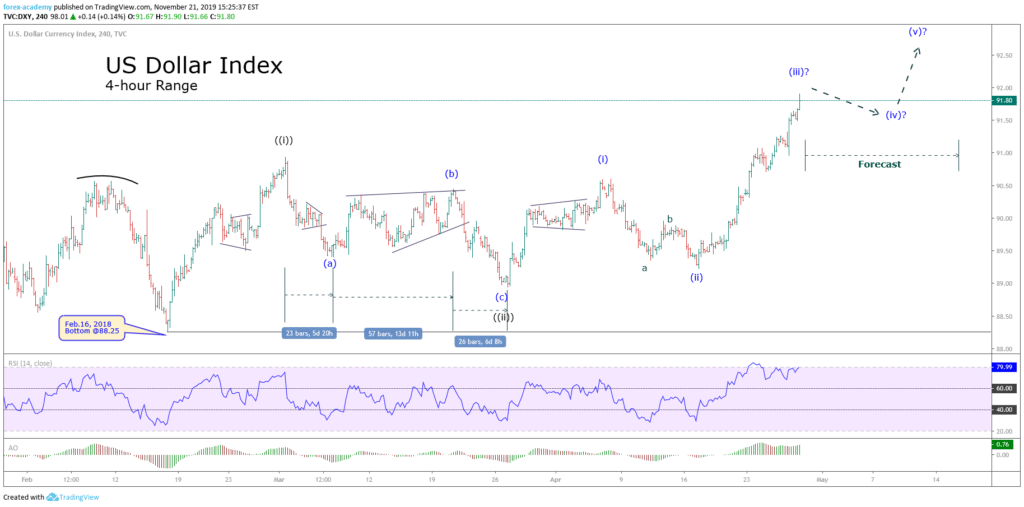
From the chart, we observe a first impulsive upward movement labeled ((i)) in black, which developed five waves of a lesser degree. Once DXY completed the first wave, the price corrected by a wave ((ii)), which is divided into three internal segments labeled as (a), (b), and (c) in blue.
Within the corrective structure, alternation over time can be distinguished. For example, the wave (a) in blue ended in 23 bars, the wave (b), in turn, was developed in 57 bars. Finally, the wave (c) took 26 bars to finish. This time difference reflects the principle of alternation in terms of simplicity and complexity of each segment that composes the price movement.
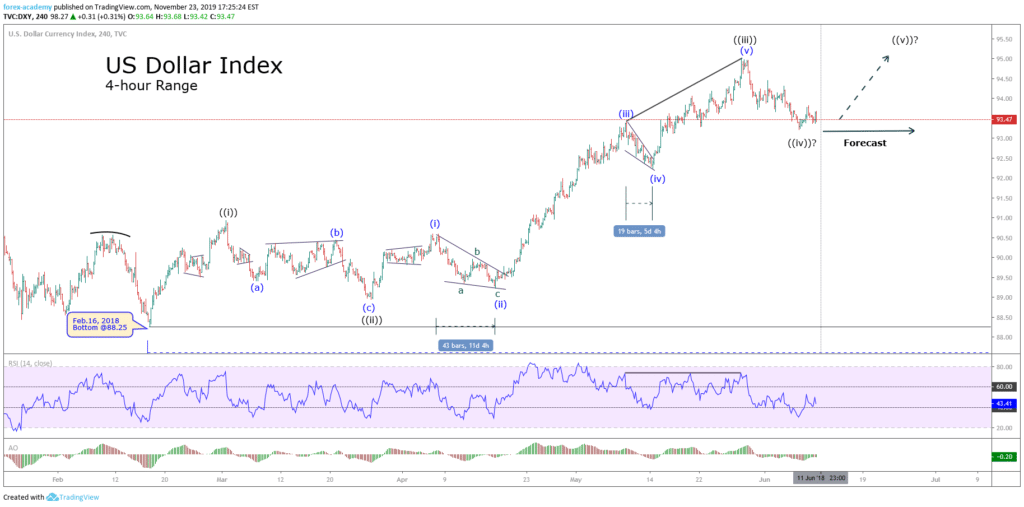
The following chart shows how the action of the price alternates in the waves (ii) and (iv) in blue. In the wave (ii), the corrective movement of DXY developed in 43 bars, while the wave (iv) was completed in only 19 bars.
Conclusions
Based on the case studied, we can recognize how the principle of alternation is reflected in the financial markets and different temporalities. This application in different time frames allows us to identify the concept of “market fractality.”
On the other hand, we can observe how the market alternates not only in a price dimension but also in time. In other words, the progress of the market must be studied concerning both price and time.
Finally, if the range of a movement is narrow and has a relatively long duration, the next move will likely be broad in terms of price motion and shorter in length.