Introduction
In previous articles, we discussed the concepts of alternation and extensions and their importance in wave analysis.
R.N. Elliott, in his work “The Wave Principle,” described alternation as a principle of nature. Likewise, since financial markets are the result of human activity, and consequently part of nature, they are governed by the “law of nature.”
Elliott also identified the existence of extensions as part of impulsive movements. In particular, in his Treatise, Elliott points out that extensions should appear only on one of the three motive waves and never on more than one.
In this educational article, we will review and expand on the concepts of Alternation and Extensions applied in wave analysis.
Alternation
As we have seen in previous articles, alternation can be recognized in different forms, which are detailed as follows:
- Price, which corresponds to vertical advance, either increasing or decreasing.
- Time, which corresponds to the time taken by the construction of each wave.
- Severity, which is the ratio of the wave to the impulsive pattern, this aspect applies only to corrective waves 2 and 4.
- Complexity, which refers to the number of subdivisions that the Elliott pattern has in development.
- Construction, an Elliott wave pattern, can be a flat, zigzag, triangle, etc.
So far, we have studied the characteristics of alternation in the first three aspects.
In impulsive structures, they can alternate in terms of time and price. However, in corrective structures, alternation in terms of price is usually not relevant.
However, on alternation in time, in particular, one must verify the time taken by each phase of the corrective pattern, which in general will be very different from each other. Likewise, in terms of severity, if a corrective wave produces a deep retrace to the previous impulsive wave, likely, the next corrective wave will not show a deep retrace and vice versa.
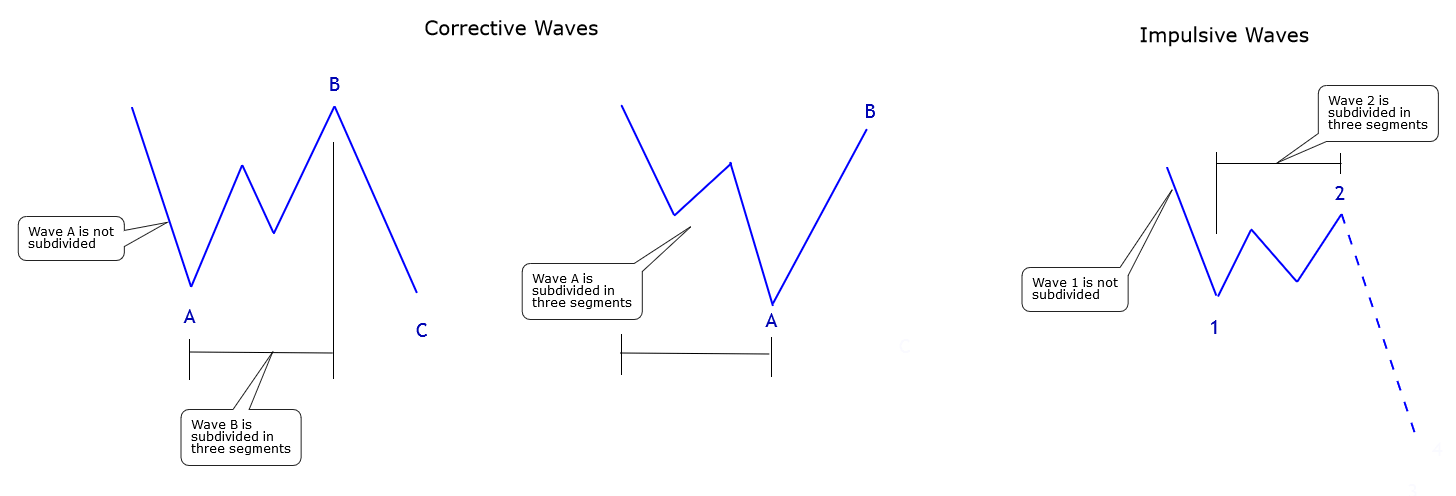
The next aspect that corresponds to the alternation principle is complexity or intricacy, which refers to the number of internal subdivisions that have an Elliott wave pattern, compared to the number of subdivisions that have the adjacent structure.
In practical terms, it will be useful for the analysis of poly-waves and multi-waves. In this way, it will be helpful for one wave to be subdivided and the other not.
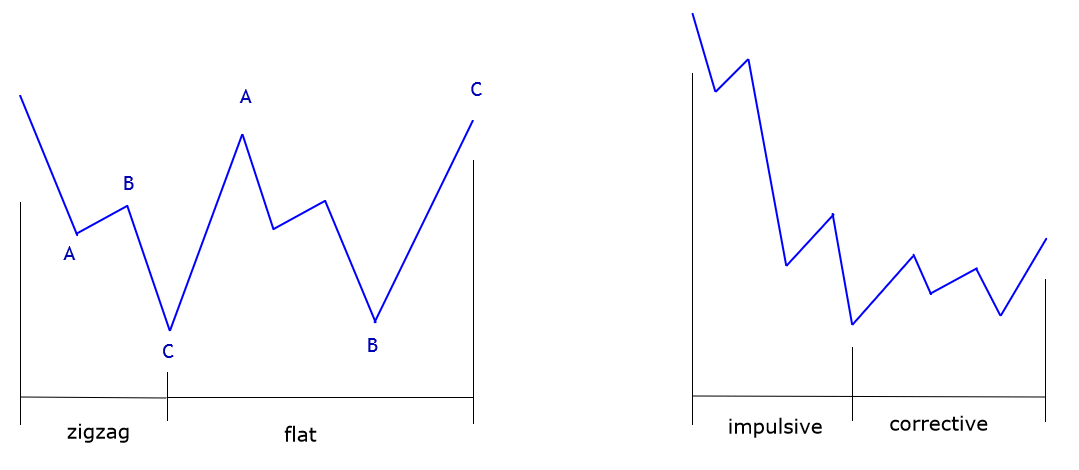
The following figure shows cases for impulsive and corrective structures.
The alternation in terms of construction corresponds to the patterns that compose an impulsive or corrective structure.
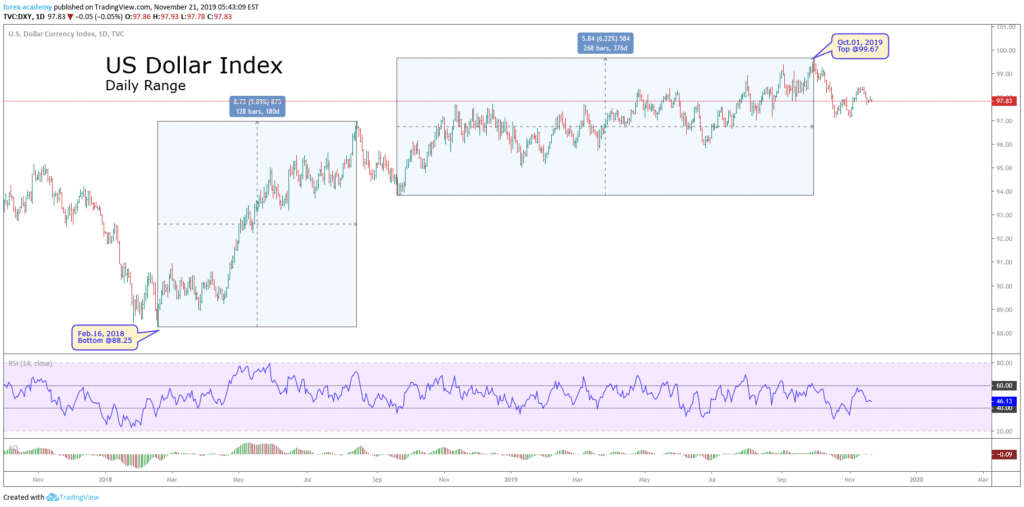
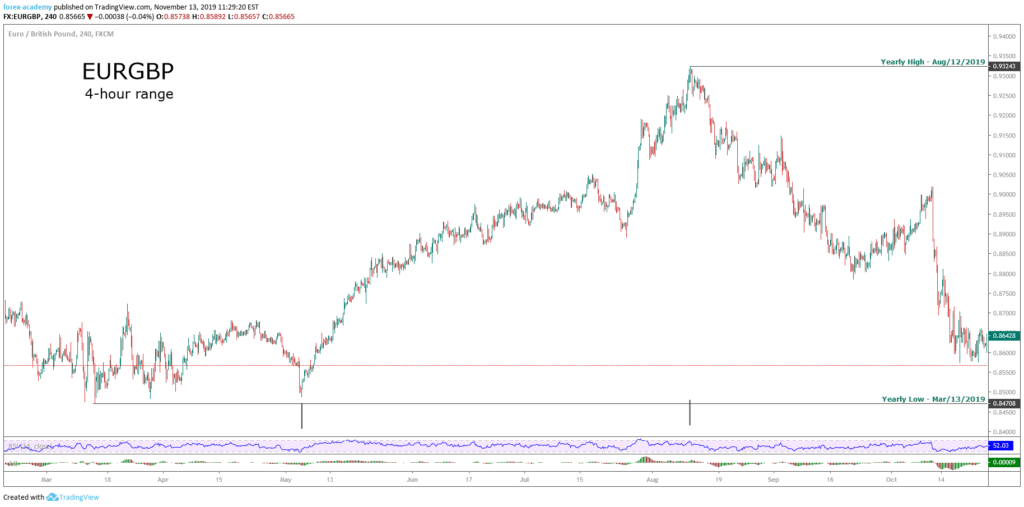
For example, in a corrective sequence in which the first movement is composed of a zigzag pattern, the next corrective move can be any structure, minus a zigzag.
In this context, in the real market, a typical sequence is first the appearance of a zigzag and then a movement corresponding to a flat pattern, as shown in the following figure. Likewise, if the price action develops an impulsive structure, the next movement will correspond to a corrective structure of the same degree.
Extensions
Usually, in wave analysis, the extension and subdivision concepts tend to be used interchangeably. However, Glenn Neely, in his work “Mastering Elliott Wave,” shows that both terms are independent.
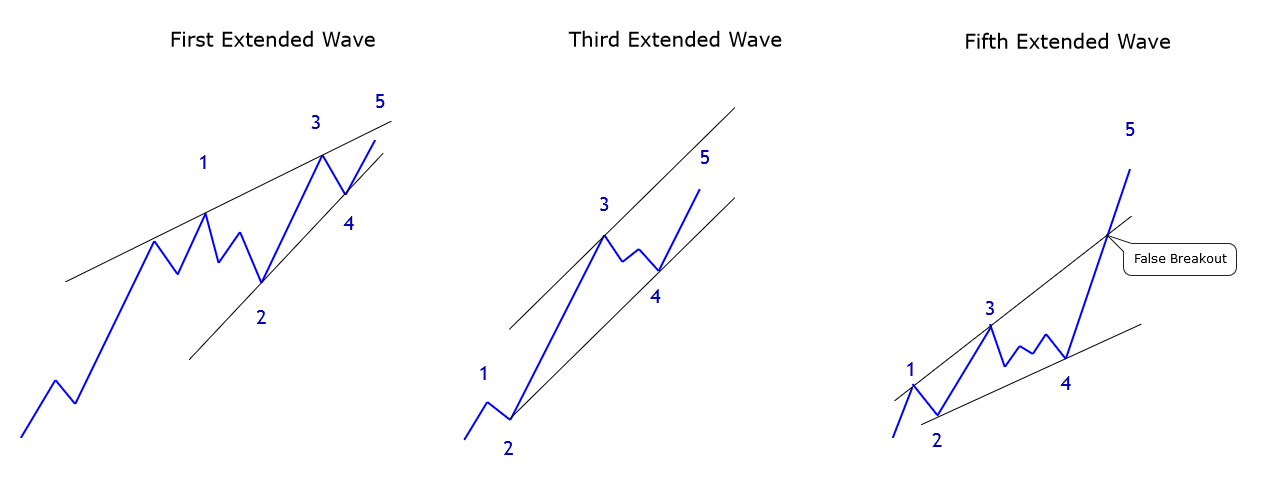
On the one hand, the extension corresponds to the wave with the longest movement in favor of the trend. As we have seen in previous articles, the extended wave appears in a single wave, and this may be in the first, third, or fifth wave, but it will never be present in more than one simultaneously.
On the other hand, the term subdivision applies to the number of segments constituting a wave, which can be impulsive or corrective.
Thus, the extended wave will not necessarily be the one with the most subdivisions. Likewise, as the complexity of the wave under study increases, the level of subdivisions that constitute it will also increase.
Finally, as indicated by R.N. Elliott in his Treatise, the extended wave is a relevant factor in terms of the behavior of an impulsive wave, either by what the most complex corrective wave will be. It can also lead the wave analyst to avoid losses and obtain gains from its knowledge.
When the first wave is extended, the structural sequence has a wedge shape. In this series of waves, the ends of waves 1 and 3 and waves 2 and 4 are joined. Usually, the fifth wave will end up under the higher guideline. The structure shall be complete when the price action violates the lower guideline joining waves 2 and 4.
When the third wave is the extended one, the fourth wave should not retrace beyond 38.2% of the third wave advance. If the retrace extends beyond 38.2%, this would be indicative of a weakness in impulsive movement, and consequently, the fifth wave should not reach a new high.
Finally, when the fifth wave is the most widespread, waves 1 and 3 may be similar, the third wave being slightly longer than the first and the fourth wave the most complex corrective wave compared to the second wave. The fifth wave will have the appearance of a false rupture of the directive that joins waves 1 and 3.
Conclusions
In this educational article, we have seen the importance of the principle of alternation in wave analysis, which can provide valuable information in the study of price action.
Also, knowledge of the alternation principle can help the wave analyst to identify which wave will be extended. In particular, when the analysts look to incorporate to the trend when it is in progress.
In the next educational article, we will study the process of wave counting and counting.
Suggested Readings
- Neely, G.; Mastering Elliott Wave: Presenting the Neely Method; Windsor Books; 2nd Edition (1990).
- Prechter, R.; The Major Works of R. N. Elliott; New Classics Library; 2nd Edition (1990).


