
The US Dollar Index (DXY) from last October shows signs of exhaustion of the bullish cycle that started in February 2016. What says us the Elliott Wave Principle about the next path of the US Dollar? In this article, we will discuss what to expect for the Greenback.

Fundamental Perspective
The Federal Reserve, during the last FOMC meeting, realized on December 11, decided to keep the interest rate at 1.75% by letting it unchanged for the second consecutive month.
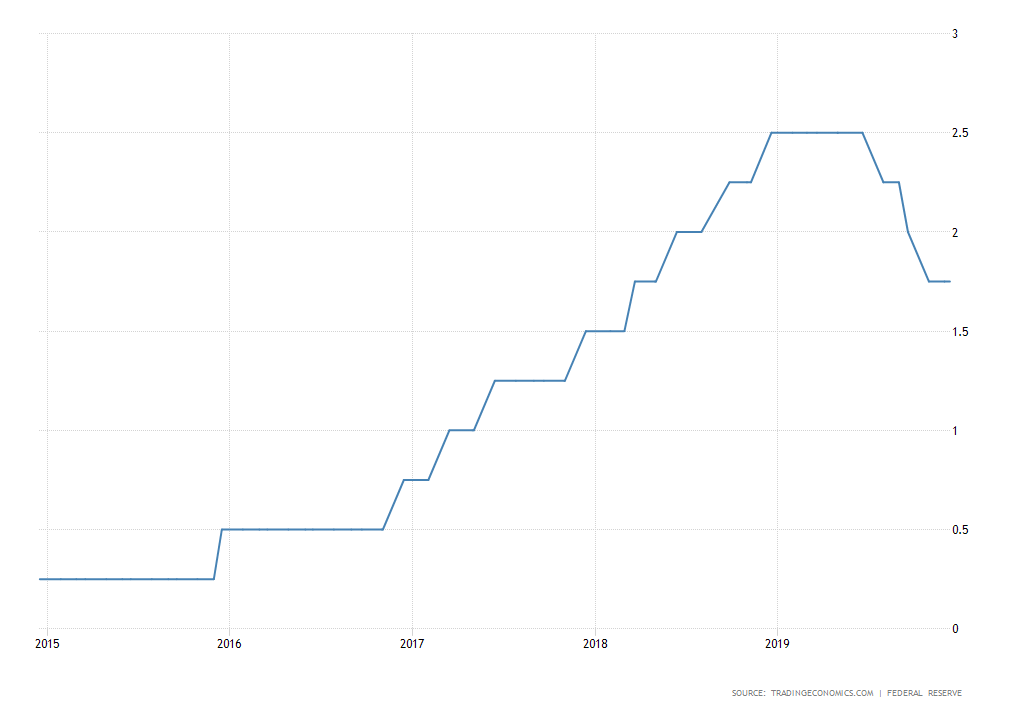
The FED’s Chairman Jerome Powell, in his latest statement, indicated that the current monetary policy is adequate to sustain the expansion of economic activity in the United States. On the other hand, the labor market conditions remain stronger, and inflation continues in the 2% target.
In its projections for next year, the committee members do not visualize any further cut changes in the reference rate.
Technical Perspective
Dollar Index (DXY), in its weekly chart, shows the price action developing a downward corrective structure. This bearish structure began on January 03, 2017, when the DXY reached the level 103.82.
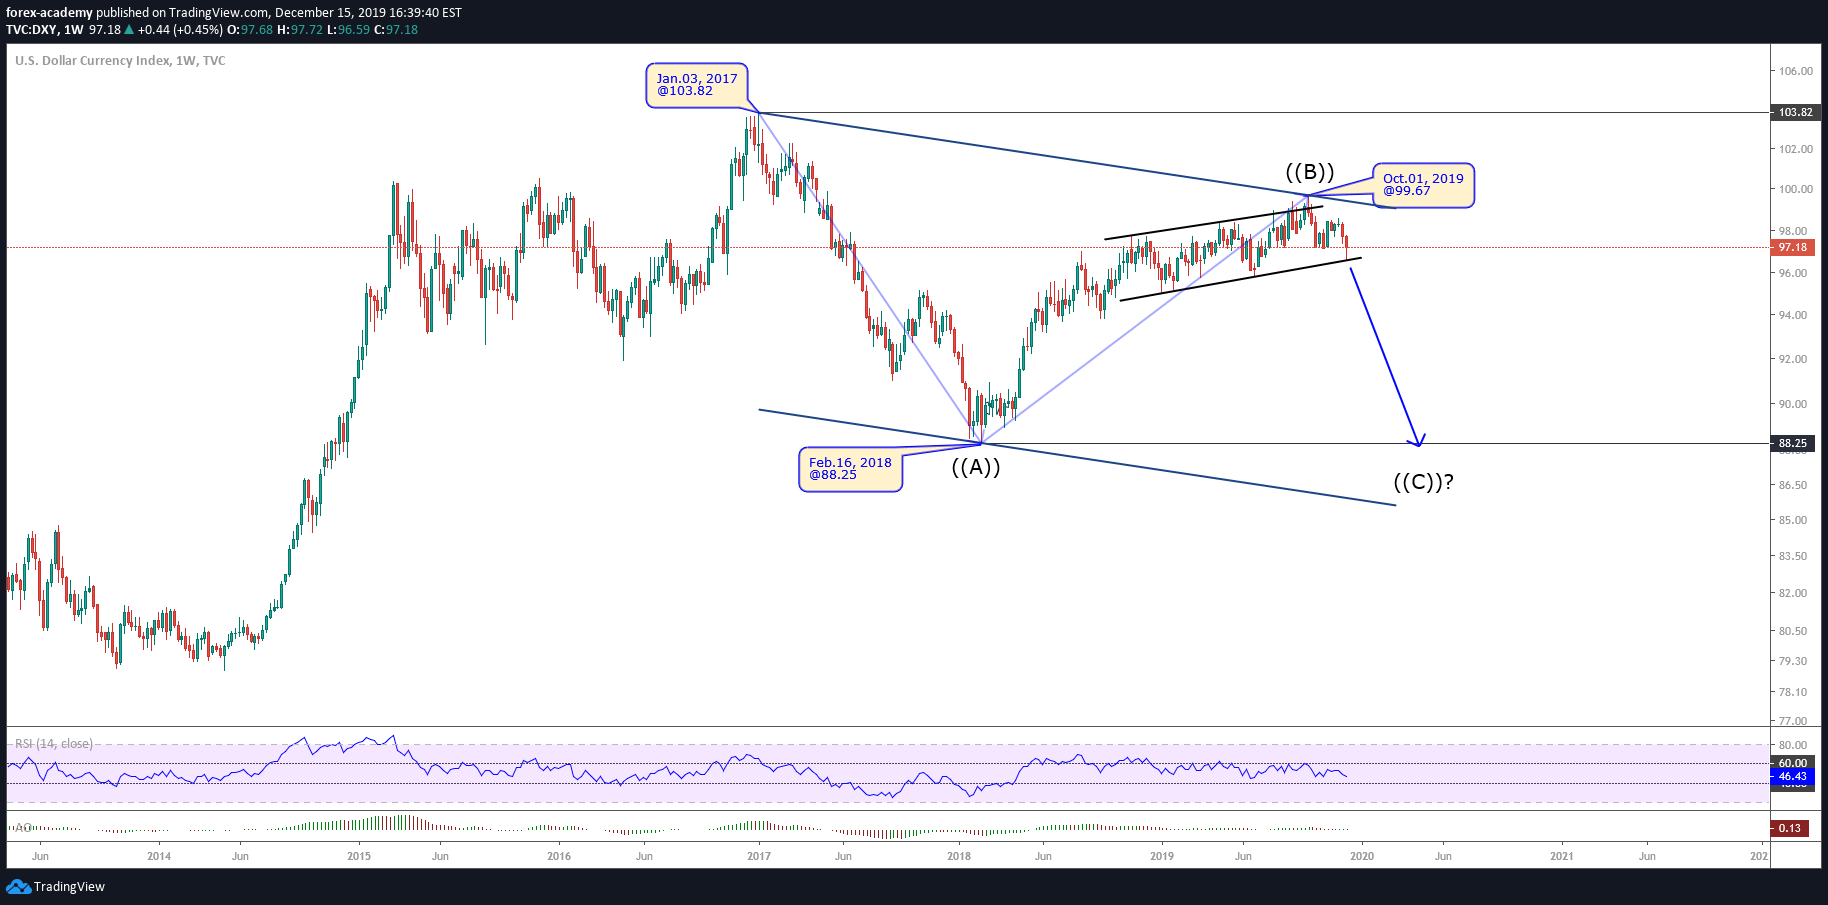
Until now, DXY has carried out two internal waves, which we identified as wave ((A)), and ((B)) labeled in black. In the weekly DXY chart, we observe that wave ((A)) progressed in five waves.
According to the Elliott Wave Principle, the formation developed by DXY should correspond to a corrective structure that presents the characteristics of a zigzag pattern. A zigzag formation is characterized by a 5-3-5 internal sequence.
The graph below shows the daily DXY chart, which reveals a bullish sequence that develops into three internal waves, labeled in blue as (A), (B), and (C), which corresponds to the complete movement of upper-degree, identified as wave ((B)).
Likewise, we recognize how the price developed a structure in the form of an ending diagonal, that in terms of the Elliott Wave Theory, appears typically in waves “5” or “C.”
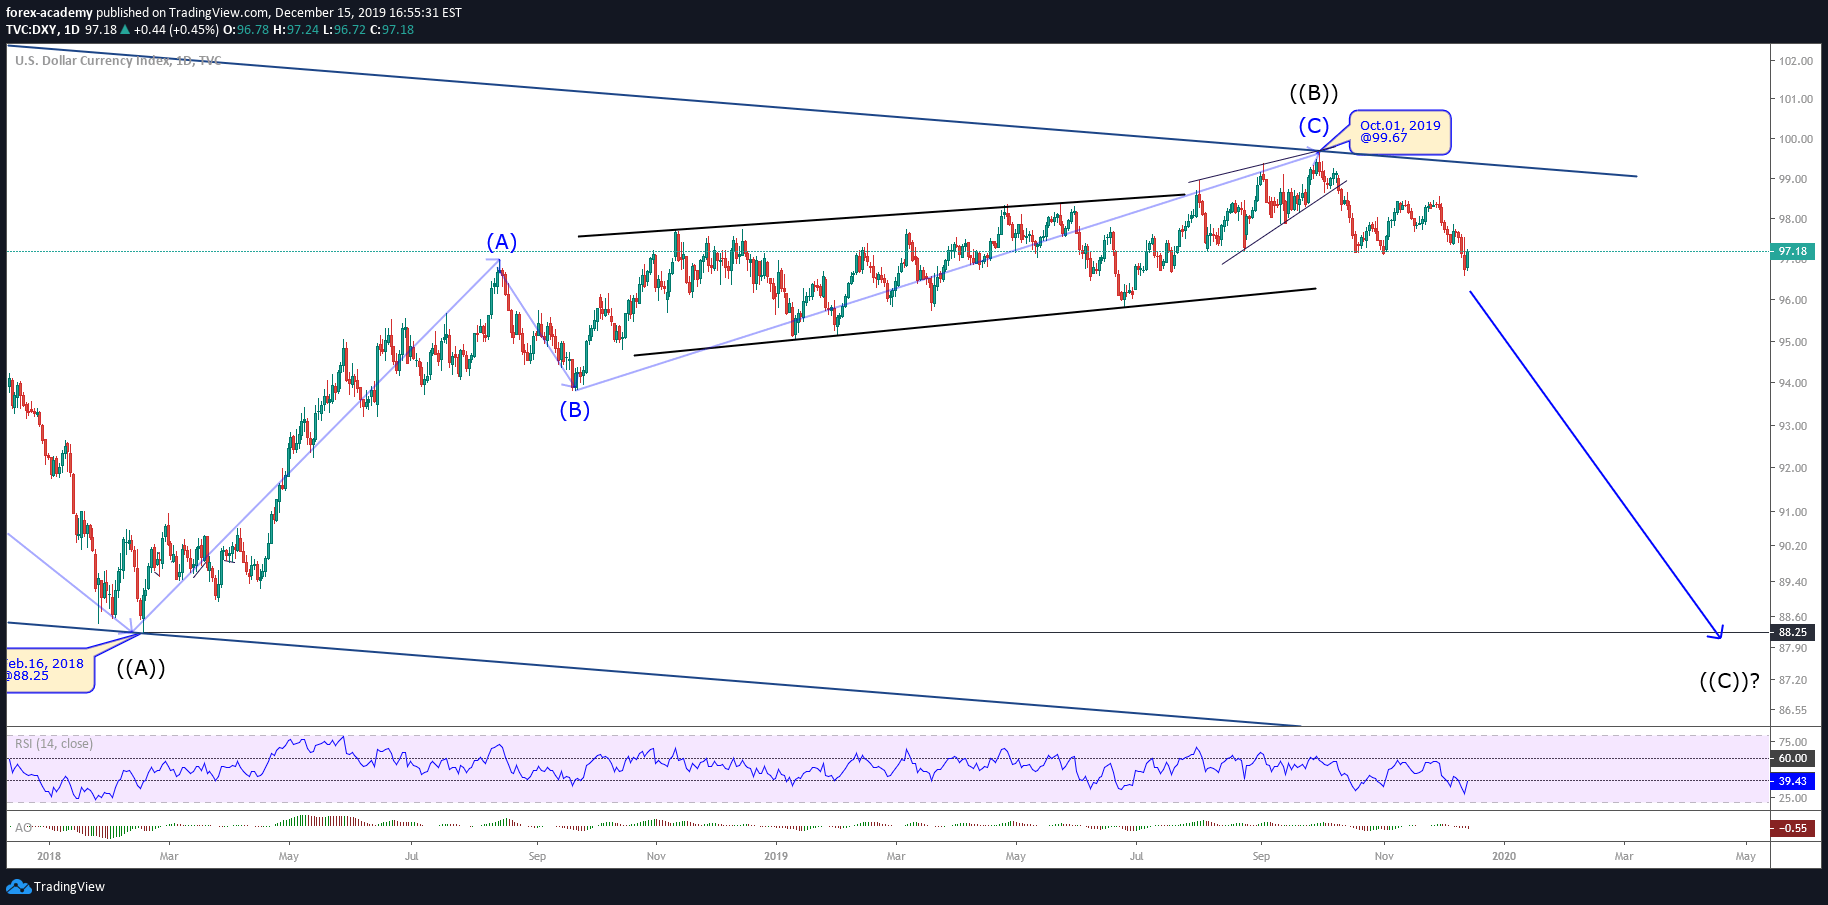
On the other hand, the pierce and closing below the August 2019 low at 97.17, make us suspect that the price could be making a change from the upward cycle started in February 2018 to a downward trend.
This movement could start the third internal move of the corrective wave, which should be developed in five waves.
Our Forecast
The 4-hour chart shows DXY has completed its first bearish motive wave labeled as (1) in blue. Once its five internal segments has ended, the price bounded off from the level of 96.59 on December 12.
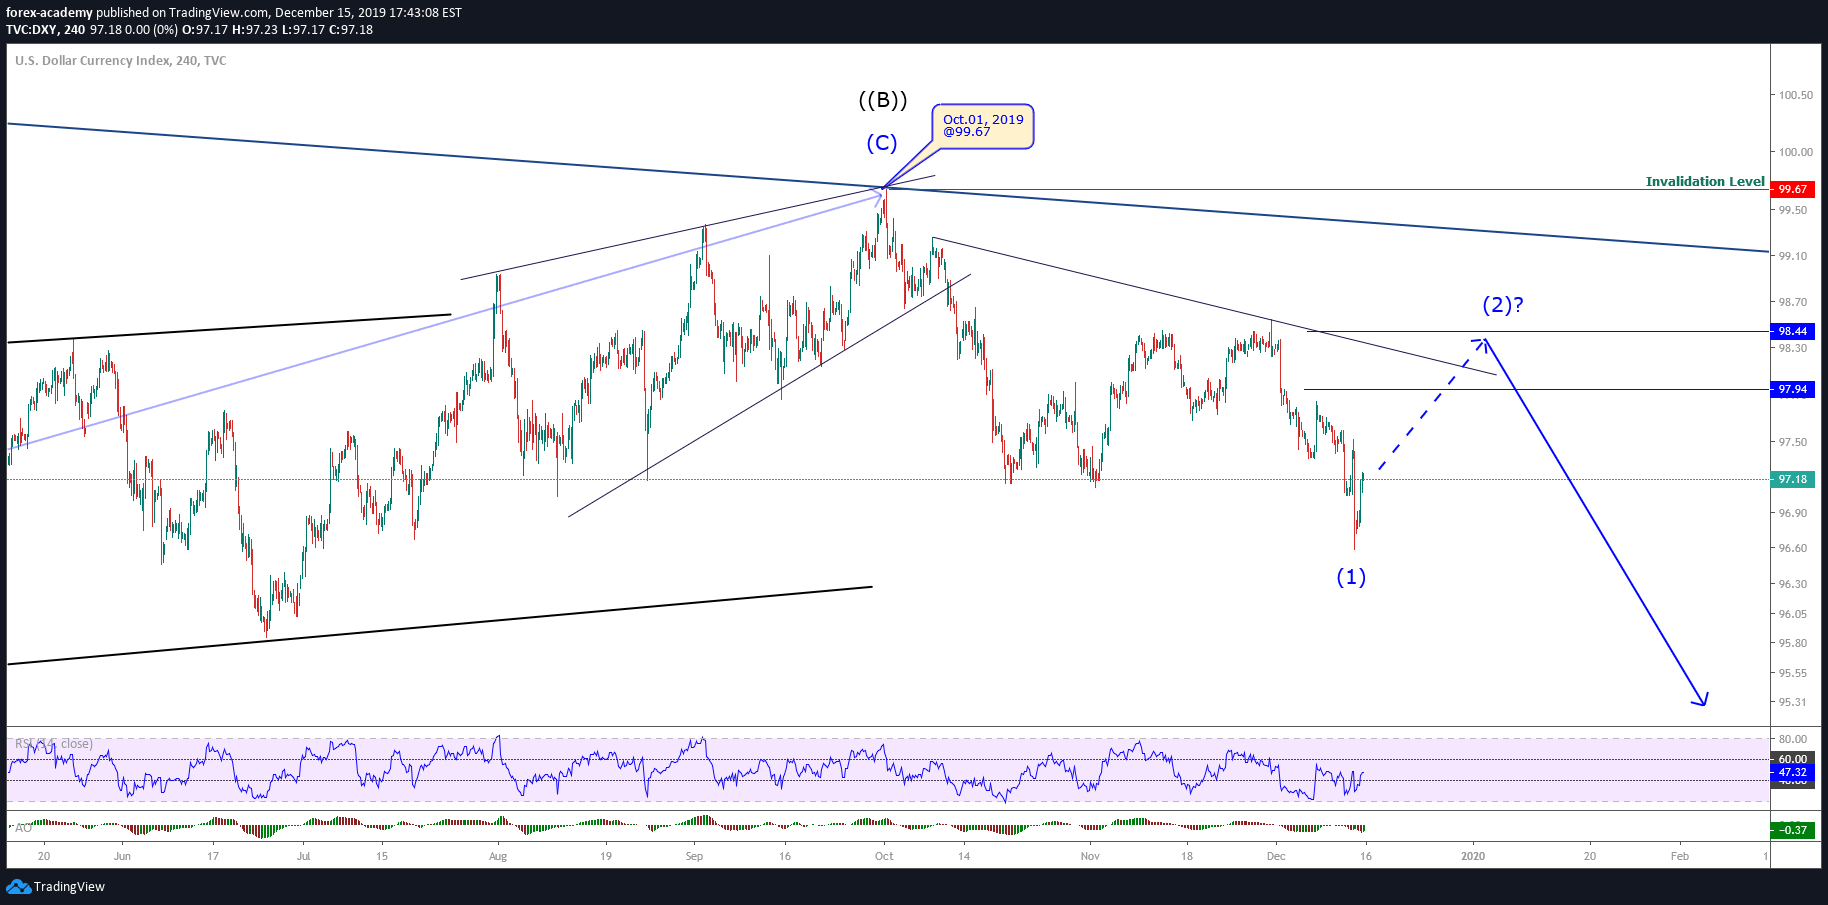
Short term, we expect a bullish rebound in three waves that could reach the zone between 97.94 and 98.44. From this zone, the Greenback could find sellers waiting to activate their short positions.
The long-term target is located in the zone of the 90 points as a psychological round-number level. Further, this zone is the area of the 2018’s lows. This target area coincides with the lower line of the downward channel.
The invalidation level of the bearish scenario is located at level 99.67, which corresponds to the highest level reached in early October 2019.