Categories
Forex Elliott Wave Forex Market Analysis

DAX Remains Bullish

The German index DAX 30 advances in an upward Elliott wave sequence that suggests more upsides in the following trading sessions.

DAX, in its mid-term Elliott wave outlook illustrated in the 4-hour chart, reveals the recovery that the German index develops in an incomplete zigzag pattern, which corresponds to wave B of Minor degree.

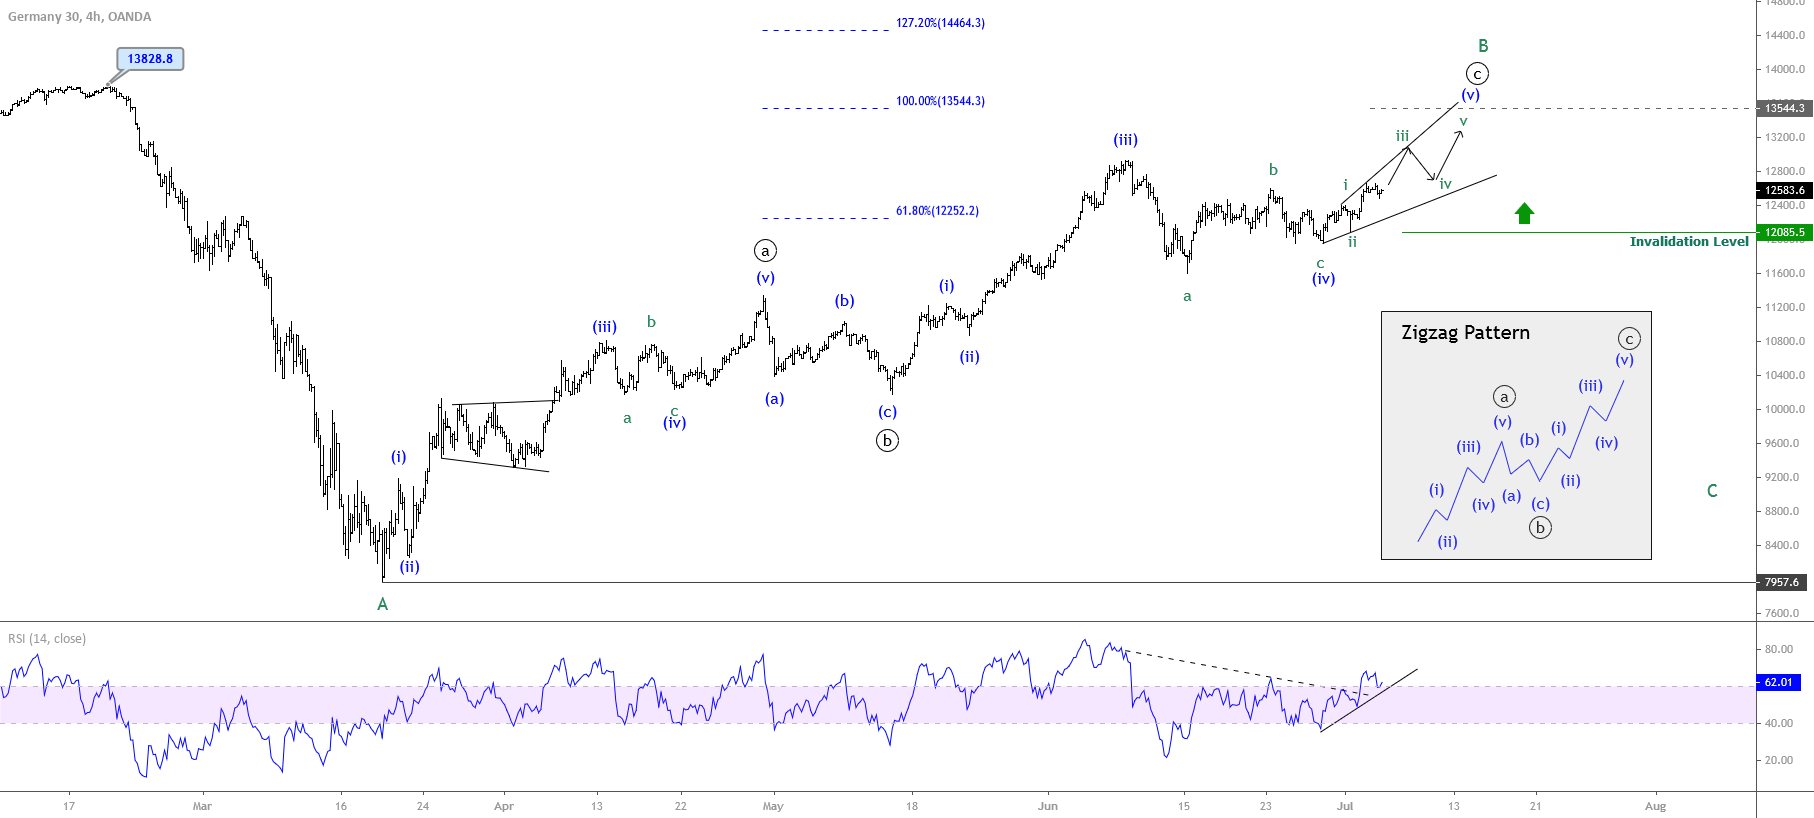
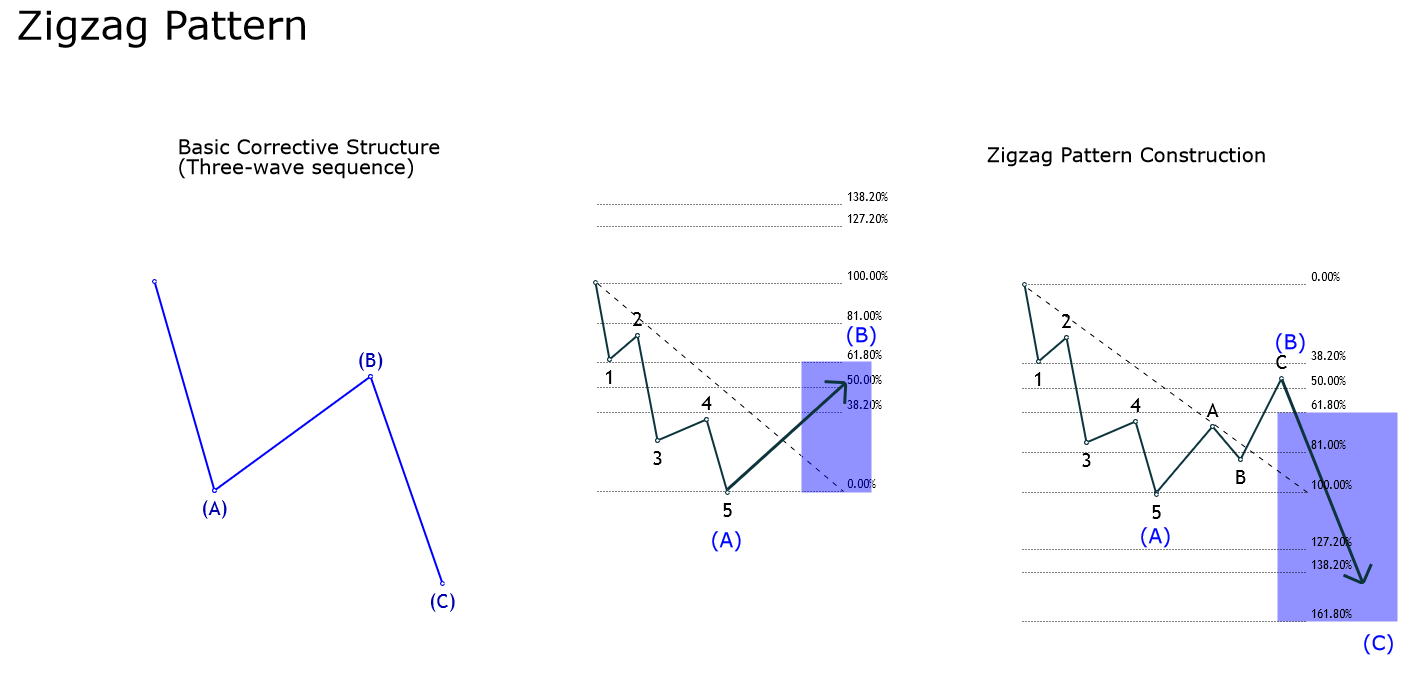
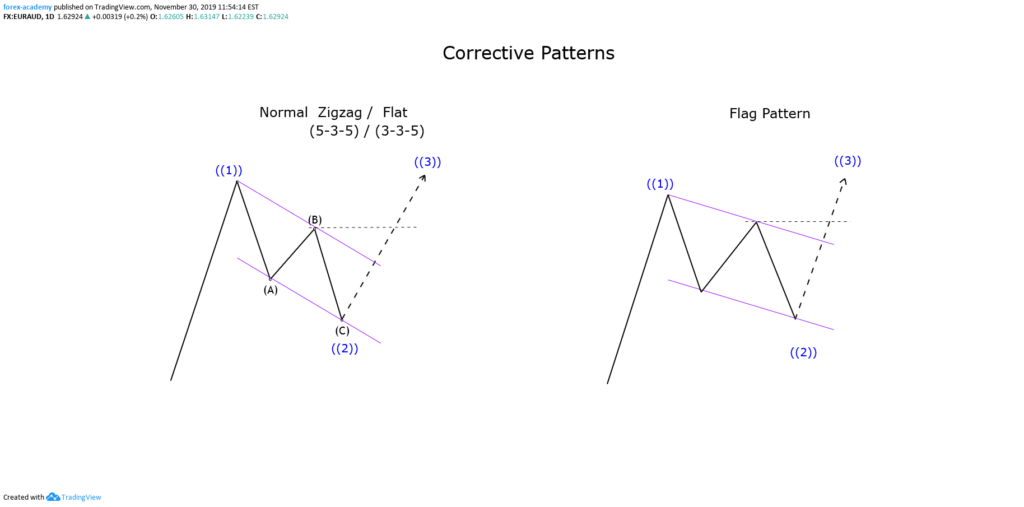
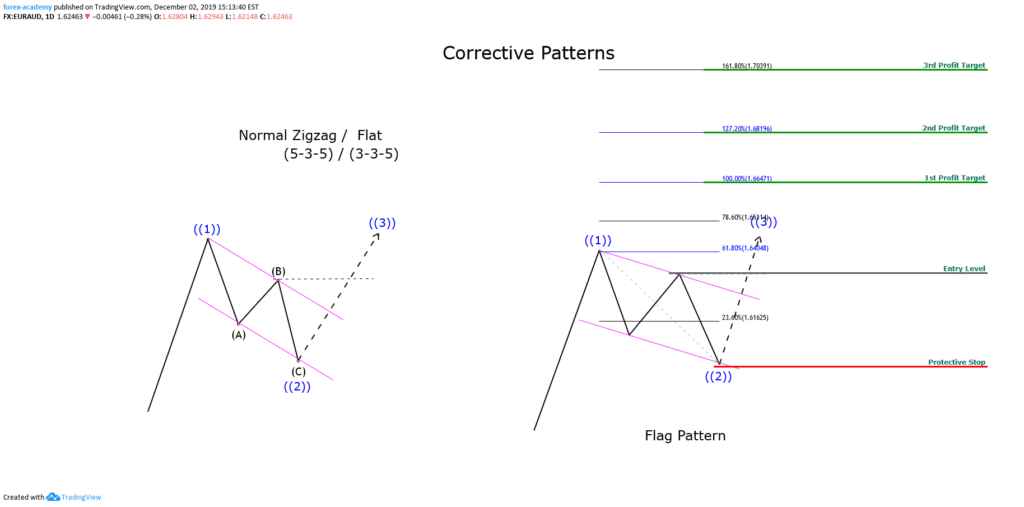
According to the Elliott Wave theory, a zigzag pattern is a corrective formation subdivided into a five-three-five sequence (5-3-5)

Once DAX 30 price had topped at its all-time high of 13,828.8 pts, it began a sharp selloff that ended on the March 19th low at 7,957.6 pts. Then, the German index began to show recovery signals, developing a bullish sequence into five waves of Minuette degree labeled in blue, which ended on April 30th at 11,340.1 pts. This movement led the DAX 30 to complete wave ((a)) of Minute degree labeled in black.

On the other hand, as the price advanced in the first part of the corrective wave, on the RSI oscillator, we observe that the leading indicator surpassed the 60 level and found support at 40, confirming the bullish bias of the corrective structure. At the same time, the progress in the wave ((b)) of Minute degree labeled in black pierced bellow the 40 level, leading us to confirm the end of the three-wave movement.

Once the German index completed its wave ((b)), the market participants kept pushing the price upwards, increasing the bullish momentum of wave (iii) of Minuette degree which jumped up to 12,398 pts on June 08th, reaching its highest level since February 26th. After this high, DAX 30 started to develop its wave (iv) that elapsed until June 29th when the price began to advance in a new upward sequence, which currently looks incomplete.

In the 4-hour chart, we distinguish the DAX30 moving in an incomplete bullish sequence, which could be advancing in its wave iii of Subminuette degree labeled in green. On the other hand, the bullish breakout and consolidation observed in the RSI oscillator over the 60-level lead us to maintain our outlook for further upsides on the German index for the following trading sessions.

The projection made using the Fibonacci extension from the wave ((a)) lead us to foresee a rally continuation that could find resistance at 13,544.3 pts, which coincides with the 100% of Fibonacci extension. In other words, this bullish continuation could complete the 100% of equal waves between waves ((a)) and ((c)). There exists a possibility that the German index continues advancing further to 14,464.3 pts, corresponding to 127.2% of the Fibonacci extension.

In conclusion, our main outlook foresees more upsides for the following trading sessions. Furthermore, the bullish outlook will be valid while the German index remains above 12,085.5 pts, which coincides with the end of wave ii of Subminuette degree identified in green. If this scenario happens, it would be indicative that the wave (iv) is incomplete, and DAX 30 will continue consolidating, as the bullish pressure would decrease over time.

Categories
Forex Elliott Wave

How to Analyze the Zigzag Pattern – Intermediate Level

The zigzag pattern is a three-wave structure that has a limited number of variations. In this educational post, we’ll present how to analyze the zigzag pattern under an intermediate level perspective,

The Elliott’s Zigzag Pattern

R.N. Elliott, in his work The Wave Principle, described the zigzag as a corrective formation that follows an internal sequence defined by 5-3-5.

The wave analysis analyst should consider that corrective patterns are not easy to recognize while the structure is not complete; however, it results revealing and useful to make forecasts once the formation is complete.

Zigzag Construction

Glenn Neely, in his work Mastering Elliott Wave, describes the zigzag construction as follows:

  1. Wave A shouldn’t retrace beyond 61.8% of the impulsive wave.
  2. Wave B should retrace at least 1% of wave A, but shouldn’t exceed 61.8% of wave A.
  3. Wave C must finish at least slightly beyond the end of wave A.
  4. If wave B retraces more than 61.8% of wave A, thus the movement developed doesn’t correspond to the end of wave B. In this case, the move realized correspond to a segment of a complex wave B.

The following figure illustrates the steps of the zigzag pattern construction previously described.

Types of Zigzag

According to the extension of wave C, the zigzag pattern would be classified as normal, extended, or truncated.

Normal zigzag: In this case, wave C can reach between 61.8% to 161.8% extension of wave A. Concerning wave B, this segment doesn’t retrace more than 61.8% of wave A, and wave C shouldn’t extend beyond 161.8% of wave A.

Truncated zigzag: This formation is less frequent than the other two zigzag pattern variations. Further, wave C shouldn’t be lower than 38.2% of wave A, but not greater than 61.8% of wave A. 

Once wave C ends, the next path should retrace at least 81% of the entire zigzag formation. According to Neely, this pattern it is likely that appears in a triangle structure.

Extended zigzag: This variation is characterized by having a more prolonged wave C than the other two models, which surpasses the 161.8% of wave A, being similar to an impulsive sequence. 

Once completed the wave C, the next path tends to retrace at least 61.8% of wave C.

Canalization Process

To canalize a zigzag formation, the wave analyst should pay attention to wave A and the end of wave B. 

The canalization process begins with the trace of a base-line linking the origin of wave A with the end of wave B, then using this line, a parallel line is projected at the end of wave A.

If the wave analyst encounters a zigzag pattern, then the corrective formation could move inside the channel, violate it, but never move in a tangent way to the channel. If it occurs, then the corrective sequence may correspond to a complex correction.

Finally, once the price violates the base-line O-B, we can conclude that the zigzag pattern ended.

NASDAQ e-mini and its Zigzag Pattern

The following figure represents to NASDAQ in its 12-hour timeframe. The chart reveals the upward process that the technologic index developed in the Christmas rally of 2018 at 5,820.50 pts.

The impulsive bullish sequence completed its internal five-wave moves at 7,879.50 pts on April 24th, 2019, from where the price began to develop a corrective zigzag pattern.

As illustrated in the last figure, the wave (a) in blue looks as a five-wave structure that ended at 7,290 pts on May 13th, 2019. The second leg of the zigzag pattern advanced close to 61.8% of the wave (a), which accomplishes the requirement of zigzag construction.

The next bearish path, corresponding to wave (c) produced a second decline in five waves and dropped beyond the 61.8% and below 161.8% of (a) which lead us to conclude that the type of zigzag pattern is normal.

At the same time, we observe that the price didn’t violate the lower line of the descending channel. However, once NASDAQ soared above the upper line of the descending channel, the corrective structure ended, giving way to the next upward motive wave.

Conclusion

In this educational article, we reviewed the characteristics of the zigzag pattern and how the wave analysts can differentiate from another kind of corrective formation. 

At the same time, the Fibonacci tools represent a useful way to validate what structure develops the market. In this context, this knowledge will allow the wave analyst to identify potential zones of reaction, which would enable us to incorporate into the trend.

In the next article, we will review the triangle pattern and how to recognize its variations.

Suggested Readings

  • Neely, G.; Mastering Elliott Wave: Presenting the Neely Method; Windsor Books; 2nd Edition (1990).
  • Prechter, R.; The Major Works of R. N. Elliott; New Classics Library; 2nd Edition (1990).
Categories
Forex Elliott Wave Forex Market Analysis

Dollar Index Long Term Wave Analysis

The US Dollar Index (DXY) from last October shows signs of exhaustion of the bullish cycle that started in February 2016. What says us the Elliott Wave Principle about the next path of the US Dollar? In this article, we will discuss what to expect for the Greenback.

Fundamental Perspective

The Federal Reserve, during the last FOMC meeting, realized on December 11, decided to keep the interest rate at 1.75% by letting it unchanged for the second consecutive month.

The FED’s Chairman Jerome Powell, in his latest statement, indicated that the current monetary policy is adequate to sustain the expansion of economic activity in the United States. On the other hand, the labor market conditions remain stronger, and inflation continues in the 2% target.

In its projections for next year, the committee members do not visualize any further cut changes in the reference rate.

Technical Perspective

Dollar Index (DXY), in its weekly chart, shows the price action developing a downward corrective structure. This bearish structure began on January 03, 2017, when the DXY reached the level 103.82.

Until now, DXY has carried out two internal waves, which we identified as wave ((A)), and ((B)) labeled in black. In the weekly DXY chart, we observe that wave ((A)) progressed in five waves.

According to the Elliott Wave Principle, the formation developed by DXY should correspond to a corrective structure that presents the characteristics of a zigzag pattern. A zigzag formation is characterized by a 5-3-5 internal sequence.

The graph below shows the daily DXY chart, which reveals a bullish sequence that develops into three internal waves, labeled in blue as (A), (B), and (C), which corresponds to the complete movement of upper-degree, identified as wave ((B)).

Likewise, we recognize how the price developed a structure in the form of an ending diagonal, that in terms of the Elliott Wave Theory, appears typically in waves “5” or “C.”

On the other hand, the pierce and closing below the August 2019 low at 97.17, make us suspect that the price could be making a change from the upward cycle started in February 2018 to a downward trend.

This movement could start the third internal move of the corrective wave, which should be developed in five waves.

Our Forecast

The 4-hour chart shows DXY has completed its first bearish motive wave labeled as (1) in blue. Once its five internal segments has ended, the price bounded off from the level of 96.59 on December 12.

Short term, we expect a bullish rebound in three waves that could reach the zone between 97.94 and 98.44. From this zone, the Greenback could find sellers waiting to activate their short positions.

The long-term target is located in the zone of the 90 points as a psychological round-number level. Further, this zone is the area of the 2018’s lows. This target area coincides with the lower line of the downward channel.

The invalidation level of the bearish scenario is located at level 99.67, which corresponds to the highest level reached in early October 2019.

Categories
Forex Elliott Wave

Corrective Waves and the Flag Pattern

Is it possible to simplify the wave analysis and compare it with classic chartist patterns? Identifying Elliott Wave patterns can seem confusing, especially if you are looking to differentiate between a flat or a zigzag pattern. In this educational article, we will look at some of Elliott’s patterns and compare them to traditional chartist figures.

The Normal Zigzag, Flat and the Flag Pattern

In the Elliott wave theory, the zigzag and the flat pattern are formations built by three internal waves. At the same time, depending on the strength of the corrective move, these could be more or less profound. The following figure shows the comparison between a normal corrective wave, which can be a zigzag or flat, and the flag pattern.

If we remember the wave theory, a zigzag pattern follows a 5-3-5 sequence, and the flat structure, a 3-3-5 internal subdivision. However, both formations can be simplified as a three-legs formation. Now, as we can see in the previous figure, the normal Zigzag and Flat structures can be simplified by a flag pattern.

The flag pattern is a chartist figure that represents a pause of the market trend and usually resolves as a continuation of the previous movement. The same situation occurs with the zigzag and flat pattern.

The flag pattern is spotted by a descending (or ascending) move, which connects in a tight range, its highs, and lows within a parallel channel.

The following chart exposes a series of flag formations detected on the GBPJPY cross in its 12-hour range.

On the figure, we observe that Flag patterns are commonly found in financial markets. According to Thomas Bulkowski’s publication, the flag pattern has a break-even or failure rate below 4%, which converts it as a “pretty nice” pattern to trade.

Flag Pattern Trade Setup

The flag trade setup is similar to the zigzag of flat configuration.

  • Entry: The trade is triggered once the price surpasses the end of wave “B,” or the previous swing high or low.
  • Protective Stop: The trade will be invalid if the price drops below the low of the flag.
  • Target: We will determine the profit target level using the Fibonacci expansion tool. The first target will be at the 100% level, as a second target at 127.2%, and the third profit target level will place at 161.8%

Putting All-together

The following chart illustrates the GBPCHF in its 8-hour range. In early January 2019, the cross developed a rally from 1.2248, which drove to the price until 1.2573. Once reached this high, the price action formed a corrective move in three waves. The bullish position was activated once price action surpassed the previous swing at 1.2524.

After the breakout, the price rallied over the three profit targets proposed. Note how the price runs when the flag pattern is tight and high, and the difference when the flag is broad in terms of price and time.

Conclusion

From the analysis realized, we conclude that a corrective structure as a normal zigzag or flat formation can be simplified as a flag pattern. This simplification could aid the traders in reducing the time analysis elapsed to the decision process before to place an order.

The confidence level of this pattern as a continuation figure could contribute to reducing the risk in the trading process.

Categories
Forex Elliott Wave

Trading the Elliott Wave Principle – Part 3

The zig-zag pattern is a corrective Elliott Wave structure developed by a 5-3-5 internal sequence. In this educational article, we will unfold two guidelines to trade this pattern.

Looking at the wave B

The first guideline is looking at wave B with the eyes placed in wave C progress. The following chart shows an idealization of this trading setup.


There are two different ways to set up the entry into the market. The first one is to wait for the retrace of wave (B) into the area between 38.2% and 61.5% of Fibonacci retracement. The second one settles once the price breaks and closes below wave B of wave (B). In the chart, wave B has a blue label, and wave (B) has a black degree.

The invalidation level is above wave 5, or the last swing. To set the profit target, we use the Fibonacci projection. The first target (conservative scenario) is at the 61.8% of waves (A) and (B). The second target is at 100%, and the last one is at 127.2%.

Following the trend

The second guideline is at the end of wave C. In this context; we seek to join the primary trend. The next chart explains the model for this setup.


The setup is as commented in the article “Trading the Elliott Wave Principle – Part 1.” In this case, from the previous chart, we enter the market after the breakout and close of wave 4 of wave (C).

The first profit target is at 100% of the Fibonacci projection of waves ((1)) and ((2)) labeled in red degree. Note that a conservative profit target could be at the 61.8% of the Fibonacci projection.

An alternative to placing the invalidation level is below the end of wave (C). A second option is under the origin of wave ((1)) labeled in red degree.

Trading the zig-zag pattern

The Bank of America Corp. (NYSE:BAC) 3-hour chart shows a zig-zag structure. The Elliott Wave formation started on December 31, 2014, when the price found sellers at $18.21 per share.


Sometimes, the line-chart can be helpful to unveil the internal structure. From the BAC line chart (left), we observe the 5-3-5 sequence started at the end of December 2014.

On the right side, we see the OHLC chart. In this figure, we observe the trading setup looking for trade the wave C.

From the example; the short position is active once BAC dropped and closed below $17.10.

The first profit target at $16.50 (61.8% Fib projection) is conservative. This level could allow us to move to breakeven and left the trade without risk. Finally, the BAC sell-off drove to the price to find the second target at $15.95 and the third target at $15.57.

Categories
Forex Elliott Wave

Corrective Waves Construction – Part 2

R.N. Elliott, in his work “The Wave Principle” described the zig-zag structure as a corrective pattern. In this educational article, we will unfold the zig-zag formation.

The basics

The zig-zag pattern contains three waves in a higher degree, and follow a 5-3-5 sequence in its lower degree. This order means that the first leg (A) has five internal waves; the wave (B) has three segments. Finally, wave (C) is formed by five waves. The following picture shows the formation of a zig-zag pattern.


Zig-zag variations

A zig-zag pattern could develop some variations as a normal, truncated, and extended. The following chart represents the different variations of the zig-zag structure.

Consider as a key to classify what kind of zig-zag structure is running, each segment of the corrective wave must follow the 5-3-5- sequence, and the extension of wave C.


Zig-zag patterns: Channeling

Another tool to identify the type of zig-zag pattern is the use of channels. Channeling allows us to identify the potential movement of a zig-zag formation.

Channeling is developed in the same way as motive waves. In this case, we must connect the end of the last motive wave with the end of wave B and project the parallel line at the end of wave A.

In the next figure, we observe the difference between a normal and a truncated zig-zag not necessarily surpass the base-line of the channel. The main difference is that in a normal zig-zag, the wave C projection could be at least 2/3 of wave A.

In the truncated zig-zag, the wave C projection is between 1/3 and less than 2/3 of wave A.

On the extended zig-zag pattern case; the sequence could be indicative of a complex corrective sequence formation.


The S&P 500 weekly chart shows a zig-zag pattern. The bearish sequence started in October 2007 when the price reached at 1,576.1 pts. The corrective move ended on March 2009 at 666.8 pts. In some cases, the line chart could be helpful to visualize each segment of a wave. In this example, we observe in the line chart how the structure accomplishes the 5-3-5 sequence.