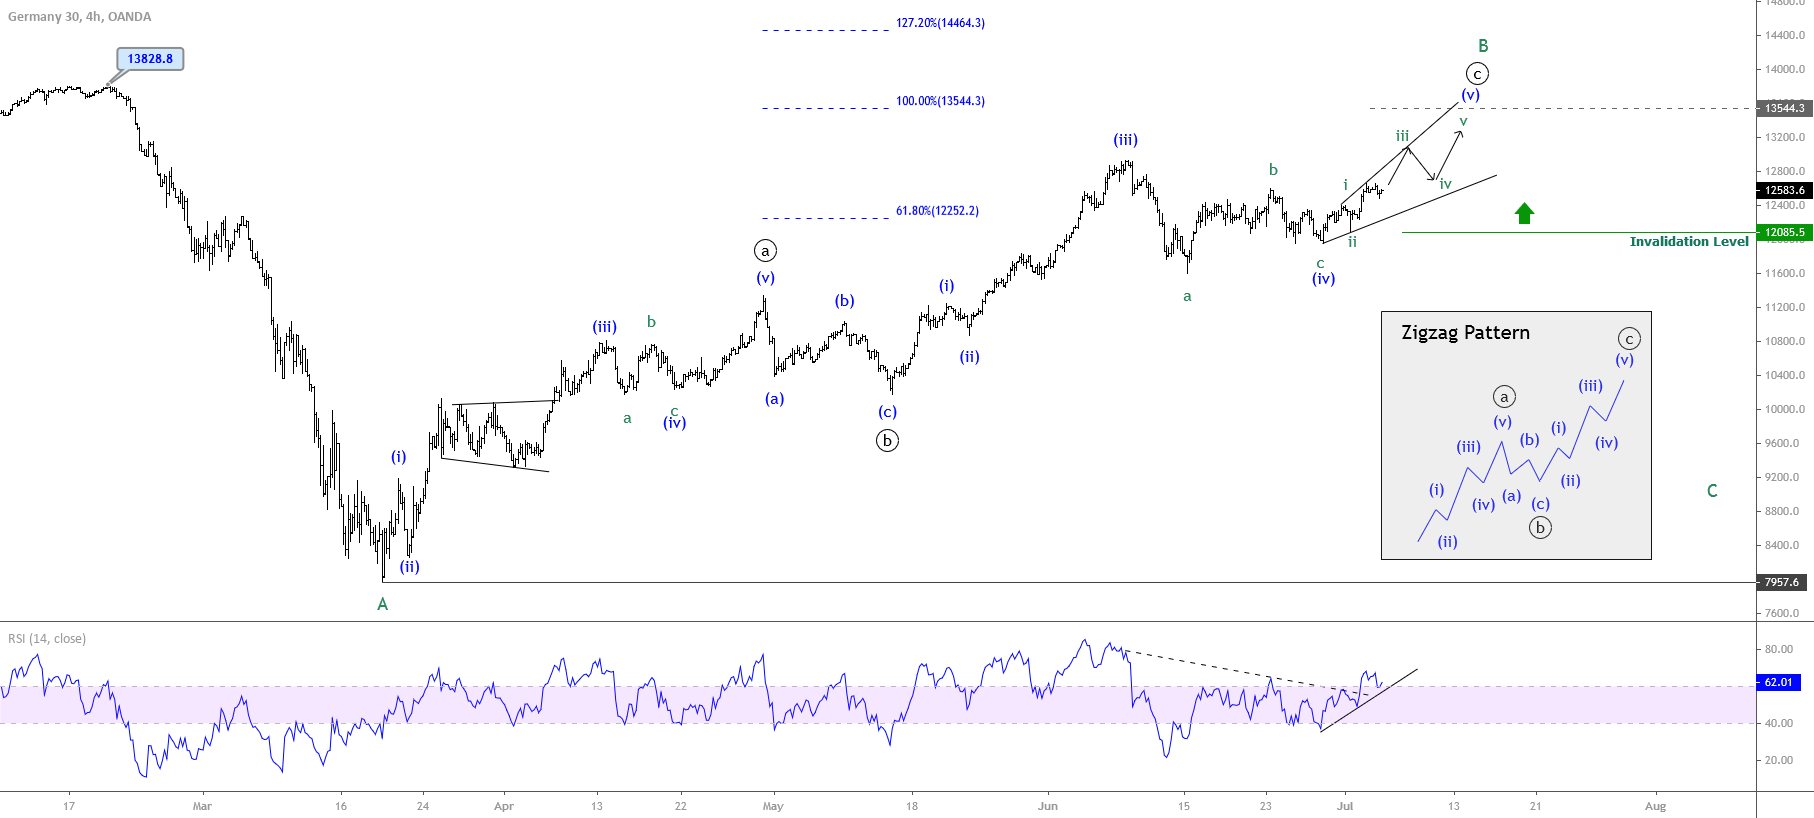
The German index DAX 30 advances in an upward Elliott wave sequence that suggests more upsides in the following trading sessions.
DAX, in its mid-term Elliott wave outlook illustrated in the 4-hour chart, reveals the recovery that the German index develops in an incomplete zigzag pattern, which corresponds to wave B of Minor degree.

According to the Elliott Wave theory, a zigzag pattern is a corrective formation subdivided into a five-three-five sequence (5-3-5)
Once DAX 30 price had topped at its all-time high of 13,828.8 pts, it began a sharp selloff that ended on the March 19th low at 7,957.6 pts. Then, the German index began to show recovery signals, developing a bullish sequence into five waves of Minuette degree labeled in blue, which ended on April 30th at 11,340.1 pts. This movement led the DAX 30 to complete wave ((a)) of Minute degree labeled in black.
On the other hand, as the price advanced in the first part of the corrective wave, on the RSI oscillator, we observe that the leading indicator surpassed the 60 level and found support at 40, confirming the bullish bias of the corrective structure. At the same time, the progress in the wave ((b)) of Minute degree labeled in black pierced bellow the 40 level, leading us to confirm the end of the three-wave movement.
Once the German index completed its wave ((b)), the market participants kept pushing the price upwards, increasing the bullish momentum of wave (iii) of Minuette degree which jumped up to 12,398 pts on June 08th, reaching its highest level since February 26th. After this high, DAX 30 started to develop its wave (iv) that elapsed until June 29th when the price began to advance in a new upward sequence, which currently looks incomplete.
In the 4-hour chart, we distinguish the DAX30 moving in an incomplete bullish sequence, which could be advancing in its wave iii of Subminuette degree labeled in green. On the other hand, the bullish breakout and consolidation observed in the RSI oscillator over the 60-level lead us to maintain our outlook for further upsides on the German index for the following trading sessions.
The projection made using the Fibonacci extension from the wave ((a)) lead us to foresee a rally continuation that could find resistance at 13,544.3 pts, which coincides with the 100% of Fibonacci extension. In other words, this bullish continuation could complete the 100% of equal waves between waves ((a)) and ((c)). There exists a possibility that the German index continues advancing further to 14,464.3 pts, corresponding to 127.2% of the Fibonacci extension.
In conclusion, our main outlook foresees more upsides for the following trading sessions. Furthermore, the bullish outlook will be valid while the German index remains above 12,085.5 pts, which coincides with the end of wave ii of Subminuette degree identified in green. If this scenario happens, it would be indicative that the wave (iv) is incomplete, and DAX 30 will continue consolidating, as the bullish pressure would decrease over time.


