In our latest EURGBP technical analysis, we commented on the cross moving in an incomplete sideways corrective formation of Minor degree, identified in green. Its internal structure suggested the completion of a double-three pattern of Minute degree.

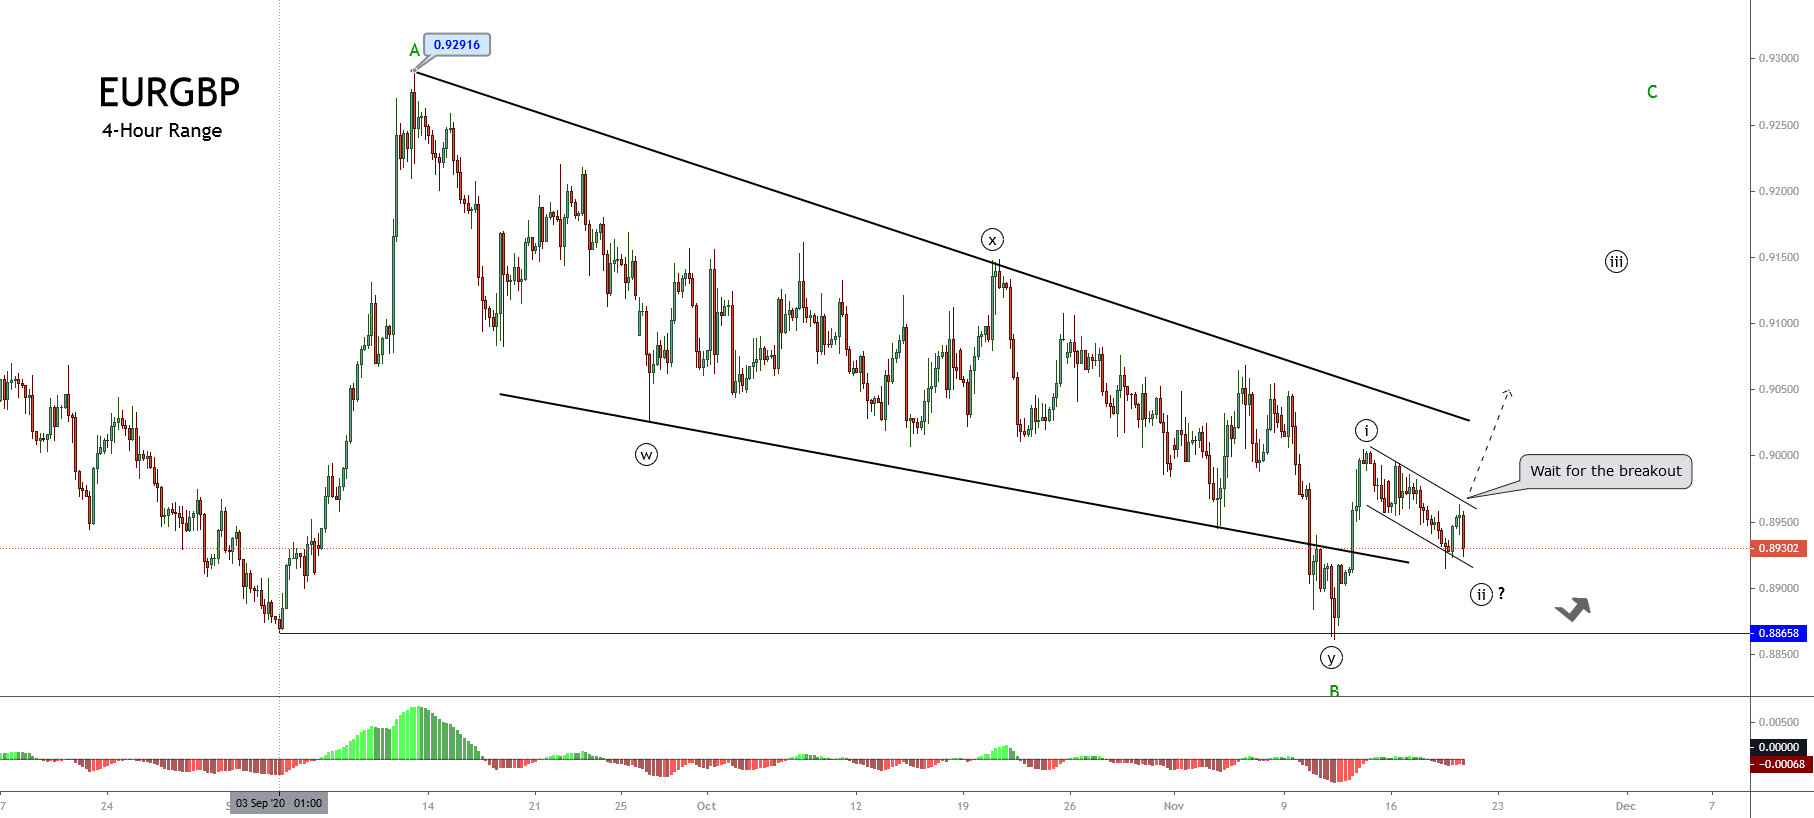 Also, we saw the pierce and bounce of the September 03rd low at 0.8658, when EURGBP dropped to 0.88610, found fresh buyers there, and created an intraday impulsive move identified as the first wave of Minute degree, labeled in black.
As the next 4-hour chart shows, once the EURGBP cross completed its first wave, in black that belongs to wave C, in green, it reacted mostly bearish, developing a correction, extending the move below our forecasted area, and testing the lows of the previous bullish impulsive move.
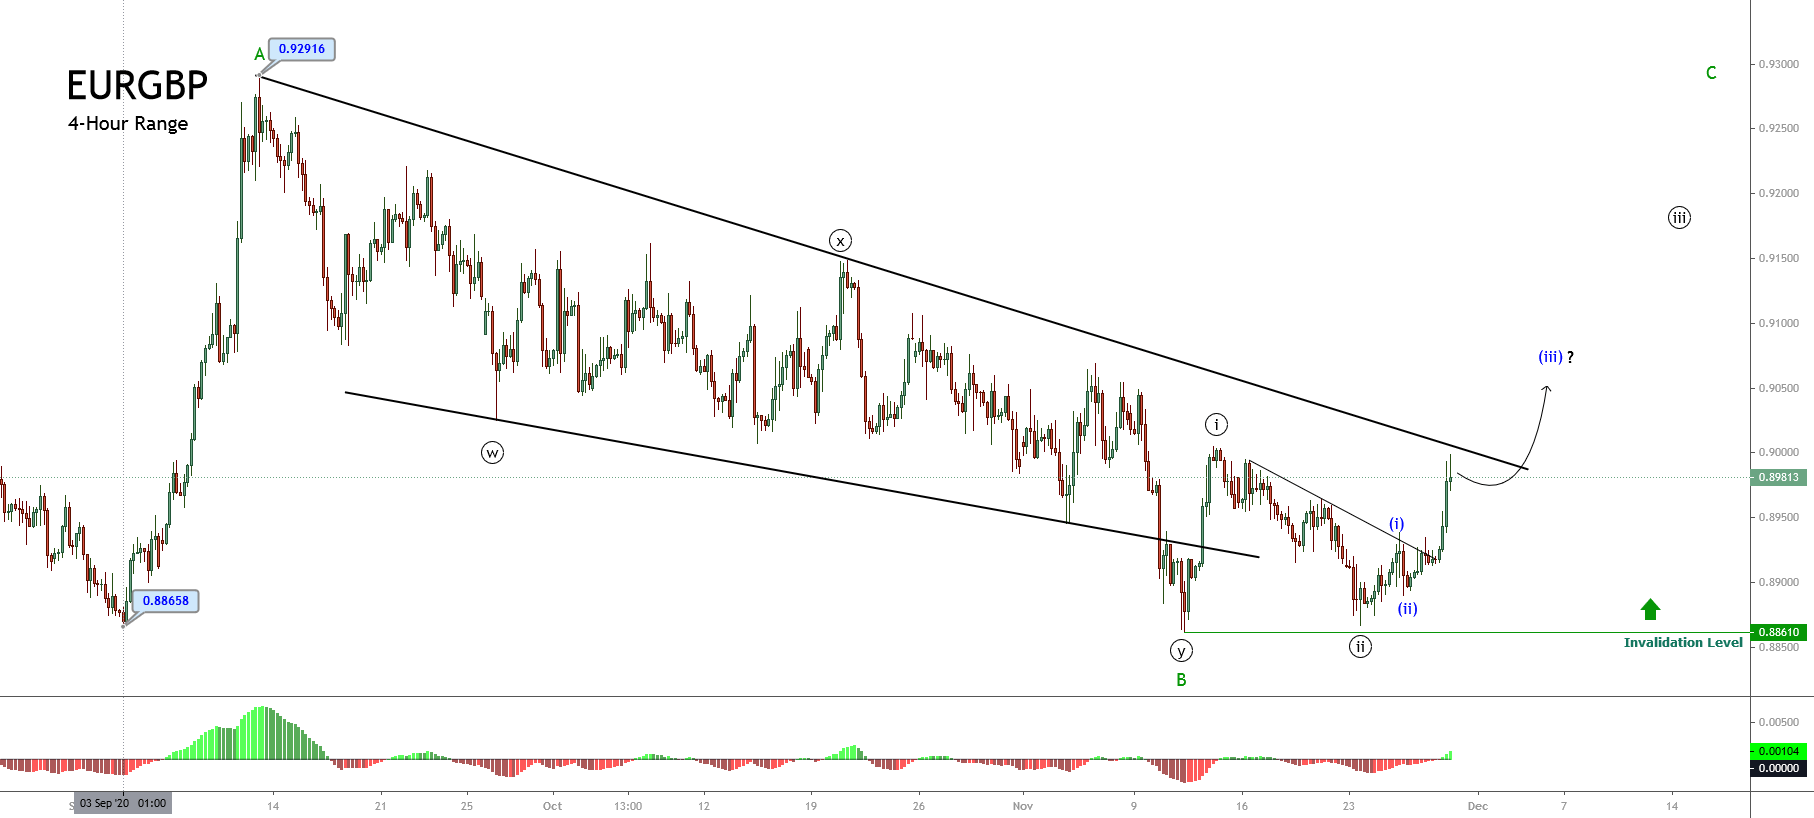
The breakout of the short-term descending trendline confirmed the end of wave ((ii)) of Minute degree and the beginning of the third wave of the same degree, which remains in progress.
Likewise, in the last chart, we distinguish the advance of the third wave of Minuette degree identified in blue in its internal structure.
Short-term Technical Outlook
The short-term Elliott Wave view of the EURGBP cross, unveiled in the below 4-hour chart, reveals the breakout of the descending trendline that follows the wave ((ii)) identified in black, which suggests the beginning of a new rally.
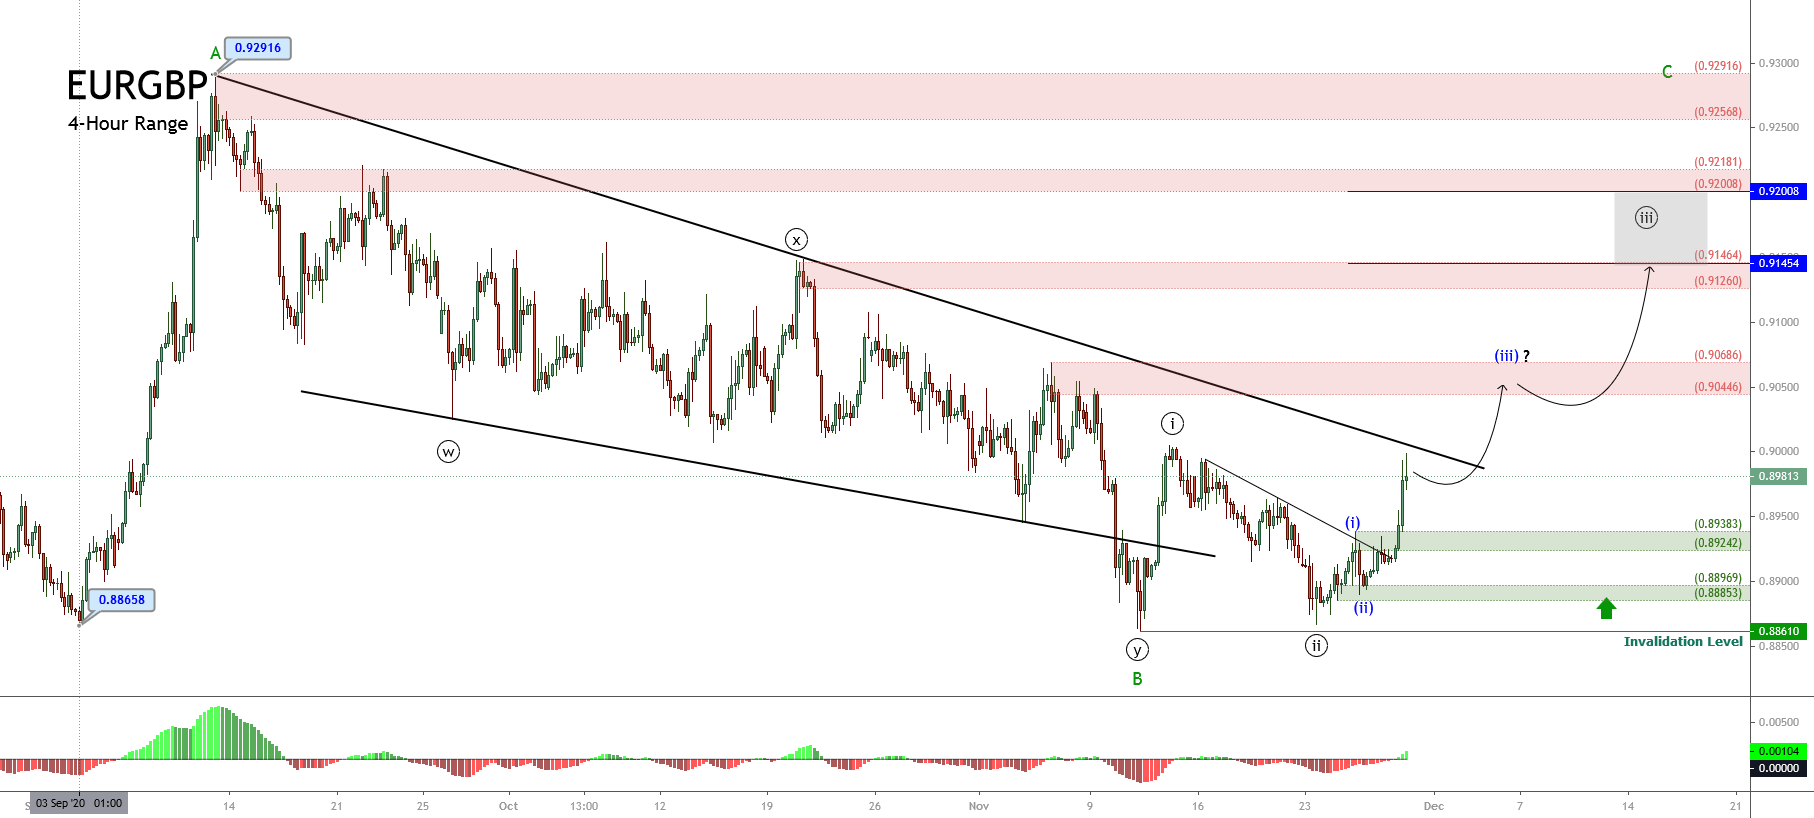 Once the price found fresh buyers at 0.88998, the cross began to advance mostly bullish in an impulsive sequence of Minuette degree, identified in blue, that remains in progress. This upward move corresponds to the internal structural series of wave ((iii)) of Minute degree that belongs to wave C of Minor degree, in green.
Furthermore, considering the reduced period it took for the first stage of wave (iii) to complete, It is plausible that the third wave in progress will be the extended wave, as the Elliott Wave theory states that only one extended wave would occur in an impulsive structure.
In this context, the current upward move could advance to the next supply zone between 0.90446 until 0.90686. But, if the cross maintains its bullish momentum, it could strike the next potential target zone between 0.91260 and 0.91464.
Finally, the current bullish scenario’s invalidation level is 0.88610, which corresponds to the origin of the wave C in green.