Categories
Forex Elliott Wave Forex Market Analysis

Why GBPJPY Plummeted in Friday’s Session?

The GBPJPY cross declined on Friday trading session dragged 0.70% after the price surpassed the psychological barrier of 142, being the highest level reached since early September 2020.

Technical Overview

The GBPJPY cross drops over 100 pips on the last trading session of the week, accumulating a modest advance of 0.02% (YTD) since the yearly opening.

On the fundamental side, the industrial production in the United Kingdom eased 4.7% (YoY) in November 2020, informed the Office for National Statistics on Friday. The reading is worse than the decline of 4.2% expected by analysts. Likewise, both coronavirus lockdown and the Brexit uncertainty contributed to the decline in the industrial output.

Source: TradingEconomics.com

On the other hand, the doubts in the fourth quarter 2020 earnings season kick-off and the elected U.S. President Biden’s stimulus plan seem not enough to keep fueling the stock market participants’ euphoric sentiment. This context looks fading the record highs in the stock market, boosting the risk-off bias pushing lower the GBPJPY cross.

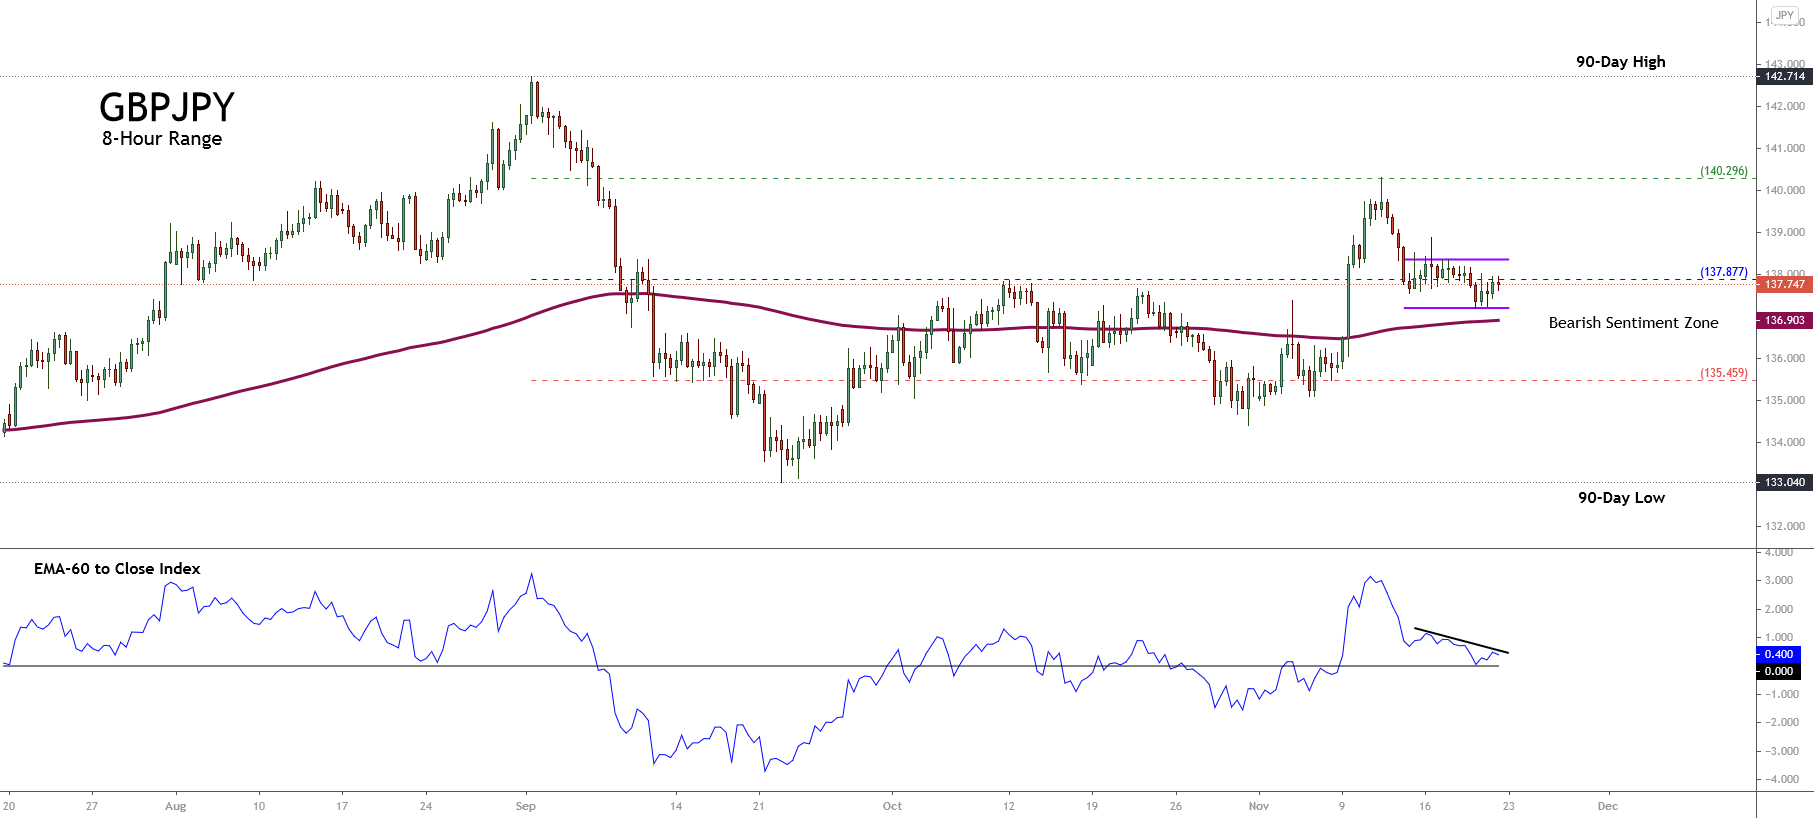
The big-picture illustrated in the next daily chart shows the price action moving in the extreme bullish sentiment where the cross ended the Friday session unveiling a bearish engulfing pattern, which carries to expect further declines in the coming trading sessions.

Finally, the piercing below the yearly opening level at 140.779 suggests potential declines during the first quarter of 2021.

Technical Outlook

Our previous analysis saw the progress in a complex correction identified as a double-three pattern (3-3-3). Nevertheless, the corrective rally suggests that the GBPJPY moves in a triple-three formation (3-3-3-3-3), which looks in its terminal stage.

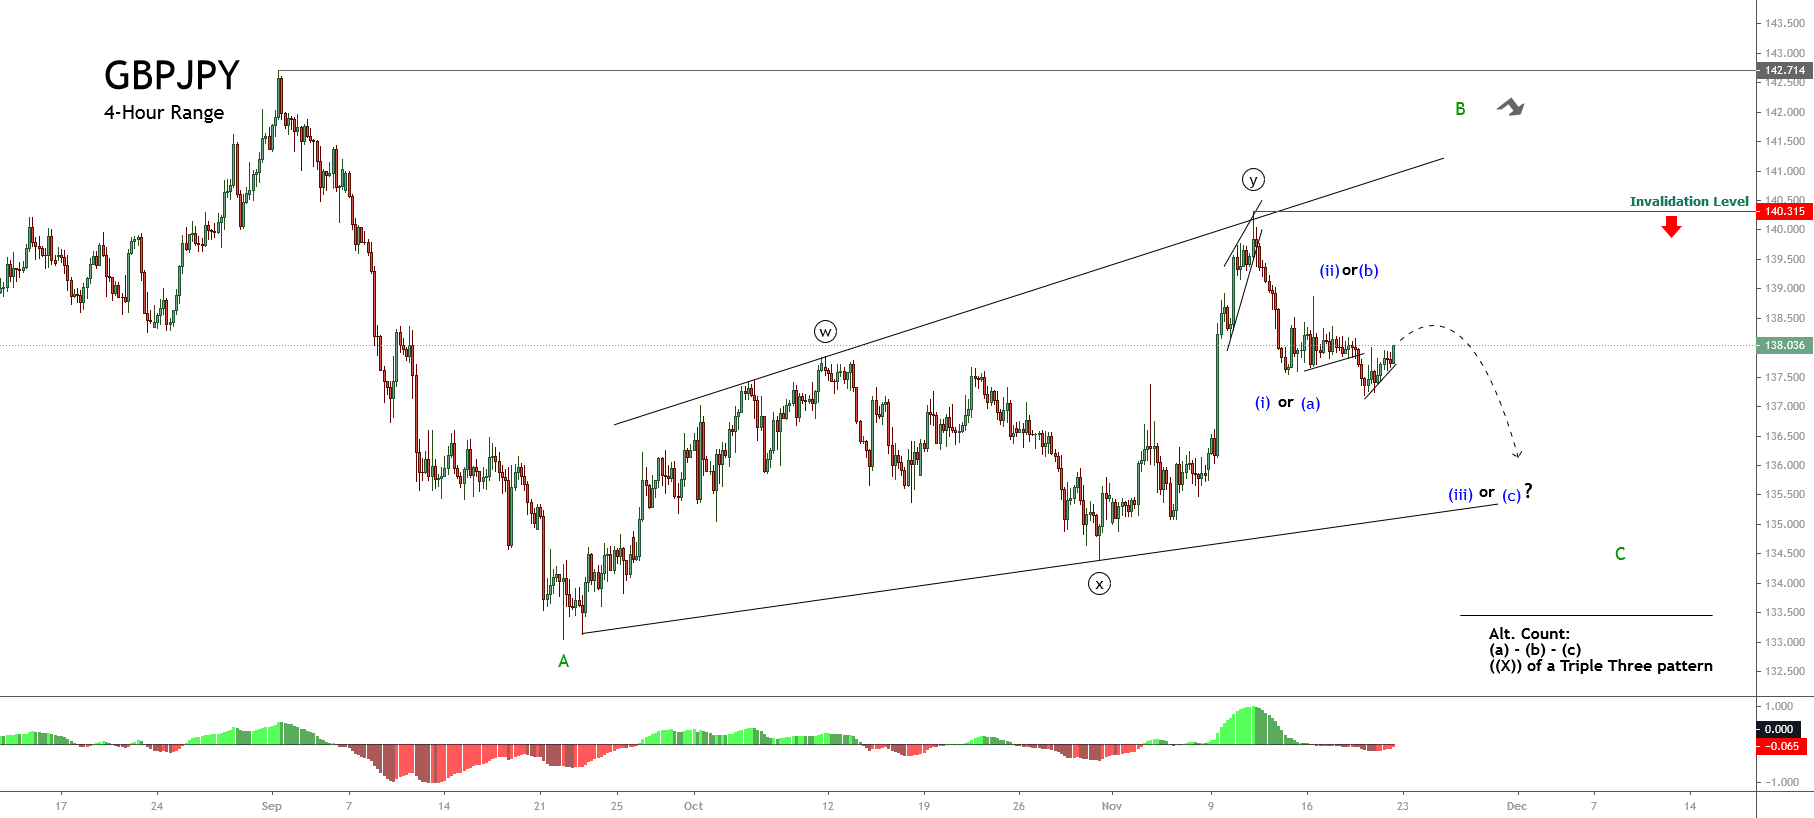
The following 4-hour chart shows the completion of a triple-three pattern of Minute degree labeled in black, which moves inside a wave B of Minor degree identified in green since the cross found support at 133.040 touched in last September 22nd.

The internal structure of wave ((z)) in black shows its last corrective leg corresponding to wave (c) in blue, developing an ending diagonal pattern, which seems finished its wave v of Subminuette degree labeled in green. The breakdown of the guideline that connects the end of waves ii with iv carries to support the ending diagonal pattern’s finalization.

On the other hand, the timing indicator exposes the intraday oversold (see the yellow circle), which leads to the conclusion that the GBPJPY cross should develop an upward retracement as a flag pattern before continuing with its potential further decline.

In summary, the GBPJPY cross plummeted in last Friday’s session dragged by the completion of an ending diagonal pattern, which belongs to wave ((z)) of a triple-three formation, where its upper degree sequence corresponds to wave B of Minor degree. Although the news media continue supporting hopes in the stimulus plan for the U.S. economy, the Elliott wave structure showed by the cross unveils a different story.

According to the Elliott wave theory, the price should develop a downward wave C of Minor degree. The timing oscillator also suggests an intraday upward consolidation likely as a flag pattern before continuing its drops.

If you are interested in expanding your knowledge about the Elliott wave theory from the basics to advanced, visit our Forex.Academy Educational Section.

Categories
Forex Elliott Wave Forex Market Analysis

USDCAD Bullish Divergence in a Complex Corrective Formation; What’s next?

The big picture of the USDCAD pair shows a bullish divergence suggesting the exhaustion of the current bearish trend that remains active since past March 2020 when the price topped at 1.46674 and began to decline in a complex corrective pattern. Follow with us what’s next for Lonnie.

Technical Overview

The long-term Elliott wave view of the USDCAD pair unfolded in its 2-day chart and log-scale, illustrates a downward movement that began on the second half of March 2020 when the price found fresh sellers at level 1.46674. Once the price topped, the Lonnie started to decline in a complex corrective formation identified as a double-three pattern (3-3-3) of Minor degree labeled in green.

According to the textbook, the double-three pattern characterizes itself by following an internal sequence subdivided into 3-3-3, each “three” a complete corrective formation. In this regard, the previous figure shows the price action moving in the third segment of the double-tree pattern corresponding to its wave Y. Also, the lower degree structural sequence reveals the progress in its wave ((c)) of Minute degree identified in black.

On the other hand, the technical indicators support the bearish bias that dominates the downtrend, persisting since March 2020. Both the trend and the momentum oscillators confirm the downtrend in progress. Nevertheless, the timing oscillator shows a bullish divergence plotted in green. This reading suggests the exhaustion of the bearish trend. In this context, the candlesticks formations observed in the last chart remains weighting declines over rallies.

Technical Outlook

The short-term outlook for USDCAD exposed in the next 8-hour chart reveals the incomplete downward advance corresponding to wave ((c)) of Minute degree identified in black, suggesting a potential new decline.

The figure illustrates the downward channel in play that connects the extremes of waves (i)-(iii) and (ii)-(iv) Minuette degree identified in blue. The Elliott Wave theory suggests that the penetration below the base-line between waves (i) and (iii) could reveal the end of wave (v). In this regard, a potential new decline could strike the area bounded between 1.2585 and 1.2425. Likewise, the gap between momentum and timing oscillators supports the likely additional downward move in the USDCAD pair. 

In summary, the USDCAD advances in a downward complex corrective sequence identified as a double-three pattern of Minor degree, which looks running in its wave Y. Simultaneously, the internal structure reveals the progress in its wave ((c)) of Minute degree, which could see a new drop to the potential target area between 1.2585 and 1.2425. Finally, the bearish scenario will invalidate if the price soars and closes above 1.27980.

Categories
Forex Elliott Wave Forex Technical Analysis

EURGBP Soars!, More Gains Ahead?

The EURGBP cross soared on Friday session, surpassing the psychological 0.92 barrier, advancing until the target area forecasted in our previous short-term analysis (here.)

Technical Overview

Our previous analysis discussed the completion of the complex corrective formation identified as a double-three pattern of Minute degree labeled in black, which began on last September 11th at 0.92916 and finished on November 11th at 0.88610. Likewise, after the double-three completion, the cross completed the wave B of Minor degree identified in green.

Once the EURGBP found the bottom at 0.88610, the cross began a rally corresponding to wave C. We have seen in our previous analysis the price completed wave ((ii)) at 0.88667 on November 23rd. After this completion, both the breakout of the descending trendline of the second wave in black and the strong bullish long-body candlestick formation developed in the November 27th session confirmed the start of the third wave in black.

Technical Outlook

During the last trading session of the week, the short-term Elliott wave view for the EURGBP cross exposed in the following 8-hour chart reveals the acceleration in its advance, which surpassed the supply zone between 0.92008 and 0.92181, finding resistance at 0.92298.

The impulsive upward movement observed during Friday’s session allows us to distinguish the completion of the wave ((iii)) at 0.92298 and the beginning of the fourth wave of the same degree.

In this context, the current corrective formation identified as wave ((iv)) in black could decline until the previous supply zone between 0.90686 and 0.90446, where the cross could find fresh buyers. Once the fourth wave completes, the cross should advance in a new rally corresponding to wave ((v)), which would be subdivided into a five-wave sequence. The potential target for the end of wave C is within the next supply zone between 0.92568 and 0.92916.

In summary, the EURGBP cross appears moving in an incomplete wave C of Minor degree, which, in its lesser degree count, shows the beginning of the fourth wave in black. This corrective formation could decline until the previous supply zone is located between 0.90446 and 0.90686. The cross, then, could find fresh buyers expecting the continuation of the trend that would push up the price toward the supply zone between 0.92568 and 0.92916.

Lastly, the invalidation level for this bullish scenario can be found at 0.90031.

Categories
Forex Elliott Wave Forex Market Analysis Forex Price Action Forex Technical Analysis

Is EURGBP Ready for a Fresh Rally?

In our latest EURGBP technical analysis, we commented on the cross moving in an incomplete sideways corrective formation of Minor degree, identified in green. Its internal structure suggested the completion of a double-three pattern of Minute degree.

Also, we saw the pierce and bounce of the September 03rd low at 0.8658, when EURGBP dropped to 0.88610, found fresh buyers there, and created an intraday impulsive move identified as the first wave of Minute degree, labeled in black.

As the next 4-hour chart shows, once the EURGBP cross completed its first wave, in black that belongs to wave C, in green, it reacted mostly bearish, developing a correction, extending the move below our forecasted area, and testing the lows of the previous bullish impulsive move.

The breakout of the short-term descending trendline confirmed the end of wave ((ii)) of Minute degree and the beginning of the third wave of the same degree, which remains in progress.

Likewise, in the last chart, we distinguish the advance of the third wave of Minuette degree identified in blue in its internal structure.

Short-term Technical Outlook

The short-term Elliott Wave view of the EURGBP cross, unveiled in the below 4-hour chart, reveals the breakout of the descending trendline that follows the wave ((ii)) identified in black, which suggests the beginning of a new rally.

Once the price found fresh buyers at 0.88998, the cross began to advance mostly bullish in an impulsive sequence of Minuette degree, identified in blue, that remains in progress. This upward move corresponds to the internal structural series of wave ((iii)) of Minute degree that belongs to wave C of Minor degree, in green.

Furthermore, considering the reduced period it took for the first stage of wave (iii) to complete, It is plausible that the third wave in progress will be the extended wave, as the Elliott Wave theory states that only one extended wave would occur in an impulsive structure. 

In this context, the current upward move could advance to the next supply zone between 0.90446 until 0.90686. But, if the cross maintains its bullish momentum, it could strike the next potential target zone between 0.91260 and 0.91464.

Finally, the current bullish scenario’s invalidation level is 0.88610, which corresponds to the origin of the wave C in green.


Categories
Forex Elliott Wave Forex Market Analysis Forex Technical Analysis

AUDNZD: Potential Bounce among Overall Weakness

This analysis discusses AUDUSD’s overall Elliott Structure, the likelihood of a short bounce in the AUDUSD, and its potential continuation.

Technical Overview

In our last AUDNZD technical analysis, the Oceanic cross was moving in an incomplete complex corrective sequence corresponding to wave (c) of Minuette degree labeled in blue, which belongs to wave ((y)) of Minute degree identified in black. 

As illustrated in the following 8-hour chart corresponding to our previous mid-November analysis, we commented on the broadening corrective formation the cross develops, which implies an acceleration of the downward sequence. Also, the move that pierced below the wave (a) in blue suggested further declines in the following trading sessions.

Likewise, we observed the potential bearish reaction areas for the decline until two potential demand zones. The first one located between 1.05186 and 1.04870, and the second one bounded between 1.03511 and 1.02864.

On the other hand, according to the Elliott wave theory, a complex corrective formation as a double-three pattern follows an internal sequence subdivided into 3-3-3, where each “three” corresponds to a single complete corrective wave.

Once completed, the current corrective structural series of wave 2 or B of Minor degree, the AUDNZD cross should give way to the start wave 3 or C, in green.

Technical Outlook

The AUDNZD cross in the next 8-hour chart exposes the price action advancing in its wave iii of Subminuette degree labeled in green, which belongs to the incomplete wave (c) of Minuette degree identified in blue. 

Considering the acceleration present in wave (c), the cross could develop an internal upward corrective movement corresponding to wave iv, in green. This move could find resistance in the adjacent supply zone between 1.0457 and 1.05603, where the cross could resume its downward movement, leading it to complete the wave ((y)) of Minute degree and, in consequence, wave 2 or B, in green. 

Once the current downward sequence finishes, the Oceanic cross will be ready for a new long-term rally corresponding to wave 3 or C, in green, which according to the Elliott wave theory, should be the largest wave of the impulsive sequence.

Finally, the invalidation level for the short-term bearish scenario is found at 1.07029, above the end of wave ii in green.


Categories
Forex Elliott Wave Forex Market Analysis

GBPJPY Consolidates in the Bearish Sentiment Zone

The GBPJPY cross continues moving by its seventh session in a row in a sideways channel turning in the neutral zone. However, since the last Thursday trading session, the price is consolidating in the bearish sentiment zone.

Technical Overview


The following 8-hour chart illustrates the 90-day high and low range, which exposes the market participants’ sentiment. The figure shows the price action moving around the pivot level at 137.877. Nevertheless, the close below the pivot level pulled the price toward the bearish sentiment zone.

Additionally, the strong bearish rejection in the price action decreasing from the extreme bullish sentiment zone of 140.296 toward the pivot level leads to suspect that the intraday upward movement developed on November 09th couldn’t be as strong as it seemed.

On the other hand, both the positive EMA(60) to Price Index and the 200-period moving average moving below the price, leads to the conclusion that the mid-term sentiment remains on the bullish side. In this regard, the short-term sideways channel’s breakdown could confirm the turning bias from bullish to bearish.

Short-term Technical Outlook

The GBPJPY cross short-term view and under the Elliott Wave perspective reveals the sideways progress in an incomplete corrective sequence that corresponds to wave B of Minor degree labeled in green.

The next 4-hour chart illustrates the advance in a broadening structural series that could correspond to a possible double-three pattern that ended once the price topped at 140.315 on November 11th.

If this scenario is correct, then the pair’s action should be advancing in wave C of Minor degree labeled in green. In this context, the GBPJPY cross should confirm the end of its internal corrective wave corresponding to wave (ii) of Minuette degree identified in blue. In this scenario, the bearish pressure could drag the price toward the end of wave A zone located between levels 133.70 and 133.

The alternative count considers the possibility that wave B of Minor degree remains incomplete and the internal structural series corresponds to a triple-three pattern. In consequence, the current downward move would correspond to the second wave ((x)) of Minute degree. If this scenario is valid, the wave (c) of Minuette degree in blue should have a limited decline, likely until the previous lows located between 135 and 134.

Finally, the invalidation level for both short-term scenarios locates at 140.315, which corresponds to the end of wave ((y)) in black.

Categories
Forex Elliott Wave Forex Market Analysis

Is EURGBP Ready for an Elliott Wave Rally?

Technical Overview

The EURGBP cross develops an incomplete Elliott wave correction of Minor degree labeled in green, which began on September 03rd when the price found fresh buyers at 0.88658 and rallied until 0.92916, in where the cross completed its wave A in green. 

The following 4-hour chart illustrates wave B completion.  We see that its internal structure looks like a double-three pattern. This second leg started on 0.92916 on September 11th and ended on November 11th when the price found fresh buyers that boosted the cross in a move that looks like an impulsive intraday rally.

According to the Elliott Wave theory, the double-three pattern is a complex correction that follows an internal structure subdivided into 3-3-3. Likewise, in a corrective formation subdivided into three-wave movements, the segment corresponding to wave C should hold five segments inside it.

On the other hand, considering the Elliott wave theory’s alternation principle, the price likely could advance in an aggressive rally after an extended complex movement.

The cross is advancing in its wave ((ii)) of Minute degree labeled in black that belongs to wave C of Minor degree. In this context, the descending channel’s upper line’s breakout would confirm the potential bullish continuation of wave (iii).

Short-term Technical Outlook

The next 4-hour chart shows the second wave of Minute degree’s internal corrective structure, which could be advancing in its wave (c) of Minuette degree labeled in blue. 

From the previous chart, if the cross finds support in the demand zone located between 0.8917 and 0.8901, opens the likelihood of a new rally corresponding to wave ((iii)), which could advance toward the first supply zone between 0.9126 and 0.91464. The next potential target zone resides between 0.9200 and 0.9218.

On the other hand, both the breakout of the intraday descending trendline that connects the end of waves ((i)) in black and (b) in blue and the surpassing of the end of wave ((i)) will confirm the advance in wave ((iii)) of Minute degree.

Finally, the bullish turning scenario’s invalidation level locates at 0.88610, which corresponds to the origin of wave ((i)).

Categories
Forex Elliott Wave Forex Market Analysis

AUDNZD Continues Under Bearish Pressure

Overview

The AUDNZD cross remains moving mostly bearish in the bullish sentiment zone. It alters the price surpassing the 1.10 psychological barrier and begins a corrective sequence that remains in progress; however, this downward movement could end soon.

Market Sentiment

The AUDNZD moves mostly downward in the bullish sentiment zone, piercing July’s low area at 1.056. The Oceanic Cross advances over 1.5% (YTD).

The following figure exposes the AUDNZD cross in its daily timeframe. The chart reveals the long-term market participants’ sentiment bounded by its 52-week high and low range. The price action began a downward sequence; after that, the cross surpassed its last 52-week high of June 02nd, located on 1.08807 in a rally that elapsed six sessions in a row.


Moreover, the 60-day weighted moving average confirms the downward short-term bearish bias that favors the price action. Nevertheless, considering that the cross moves in the bullish sentiment zone, the AUDNZD cross’s decline could be a correction of the upward cycle that began last mid-March.

Technical Overview

The AUDNZD cross under the Dow Theory perspective reveals that the price has started to develop a bullish primary trend that began on March 18th when the price found fresh buyers at 0.99906.

The following chart illustrates AUDNZD in its daily timeframe. The figure exposes the demand incorporation below the parity, which carried up the price until 1.10438, from where the price started to decline in a secondary trend.

The retracement developed by the Oceanic cross beyond the 33% leads us to confirm that the latest decline in progress corresponds to the rally’s corrective movement that began on March 18th.

The mid-term Elliott wave view of the AUDNZD cross illustrates in its 12-hour chart the downward move in a complex corrective structure that looks like an incomplete double-three pattern (3-3-3).

The previous chart reveals the price action is moving in its wave (c) of Minuette degree labeled in blue, which belongs to wave ((y)) of Minute degree in black. Likewise, this entire move corresponds to wave 2 or B, which retraces the upward five-wave sequence that began on March 18th at 0.99906.

Technical Outlook

Once the AUDNZD found sellers at 1.07565, the Oceanic cross began its wave (c) of Minuette degree labeled in green that remains in progress.

As illustrated in the following 8-hour chart, the price could extend its declines to the area between 1.05186 and 1.04870, where the price could find support. Likewise, if the price extends its drops below 1.03511, the next movement’s strength could be limited to a re-test of the August 18th high located on 1.103.

On the other hand, if the price action breaks and closes above the supply zone between 1.06456 and 1.06718, there exists the possibility of a new rally. This new bullish leg could surpass the 1.103 mark.

Finally, the invalidation level for the short-term bearish scenario is located at 1.07565.

Categories
Forex Elliott Wave Forex Market Analysis

Is USDCAD Ready for a Short-Term Rally?

The USDCAD pair reveals a strong bearish movement that seems have found a short-term bottom. In this regard, the price could start a rally that could boost the price toward October’s highs zone.

Market Sentiment

The USDCAD pair continues moving in its extreme bearish sentiment zone, erasing the gains reached during the first quarter of the year when the price advanced over 13%. Currently, the Loonie gains a modest 0.67% YTD.

The next figure illustrates the USDCAD pair in its daily timeframe. The chart exposes the long-term market participants sentiment bounded by the 52-week high and low range. 

The chart reveals the price action continues developing fresh lower lows, which leads us to observe that market participants continue holding bearish positions on the pair. Furthermore, the 60-day weighted moving average continues above the price, which confirms the bearish bias that advances the price.

On the other hand, as long as the USDCAD price remains below 1.33631, the Loonie will stay under bearish pressure.

Technical Overview

The USDCAD pair exposes a bearish reversal formation that erased the progress developed during the first quarter of the year. The following weekly chart reveals a powerful bearish long-tailed candle in terms of a yearly candlestick, suggesting that the price would continue developing more declines in the long-term.


On the other hand, the big picture exposes a long-term sideways formation that persists since mid-2015. Likewise, the last downward movement that began at 1.46674 appears to have found a bottom on 1.29238 the current trading week. 

In this regard, if the price starts to develop a corrective rally, according to the Dow Theory, the USDCAD pair should advance to 1.35022 and up to 1.40761; this upward sequence would correspond to a valid correction of the same degree that the last bearish move developed by the pair since last mid-March.

The mid-term Elliott wave view of USDCAD illustrated in the next 12-hour chart reveals an incomplete corrective sequence that looks like a double three pattern (3-3-3) of Minor degree labeled, in green, which began on March 18th at 1.46674.

Currently, the USDCAD develops its wave ((b)) of Minute degree identified in black, which belongs to wave Y in green. In this context, the wave ((b)) looks like an incomplete flat pattern (3-3-5), which subdivides into a 3-3-5 sequence. Moreover, the actual structural series suggests that the Loonie started to develop its wave (c) of the Minuette degree labeled in blue. 

Short-term Technical Outlook

The short-term Elliott wave view of the USDCAD unfolded in the following 8-hour chart, anticipates its progress in an incomplete flat pattern, which could be starting to advance on its wave (c) of Minuette degree labeled in blue.

If the Loonie find fresh buyers in a retracement to the demand zone between 1.30433 and 1.30086, and the price breaks and closes above 1.31473, then the price could confirm the potential rally that corresponds to wave (c) of Minute degree with a potential target in the supply zone between 1.33970 and 1.34592.

Lastly, the invalidation level for the intraday bullish scenario locates at 1.29283

Categories
Forex Elliott Wave Forex Market Analysis

GBPCAD Advances in a Double-Three Pattern

Overview

The GBPCAD cross advances in a sideways sequence corresponding to an incomplete double-three pattern. The mid-term Elliott Wave view foresees a potential rally that could boost the cross toward last March’s highs.

Market Sentiment

The mid-term market sentiment overview of the GBPCAD cross unfolded by the 90-day high and low range and illustrated in its daily chart, reveals the price action moving in the bearish sentiment zone (SZ).

The previous chart reveals the sideways movement bounded between the extreme bullish SZ located at 1.76759 and the extreme bearish SZ at 1.69214. Likewise, the 60-Day moving average looks flat, suggesting the balance between supply and demand, or bull and bear traders, which in turn, is indicative of sideways action.

On the other hand, considering the year’s opening price at 1.71923, we distinguish that the yearly candlestick pattern corresponds to a narrow body candle identified as a doji, revealing the next direction’s market participants’ indecision that the price will take.

In consequence, while the GBPCAD cross remains moving mostly sideways, the primary bias will continue neutral.

Elliott Wave Overview

The long-term Elliott Wave landscape of the GBPCAD cross reveals the price action is developing an incomplete three-wave sequence of Intermediate degree labeled in blue, which currently advances its wave (B). The internal structure unfolds in a double-three pattern as it exposes the next weekly chart on a log scale.

The previous chart reveals that the double-three pattern in progress looks incomplete. According to the Elliott wave theory, this complex formation follows an internal structural series subdivided as 3-3-3. In this context, the GBPCAD cross advances in its last “three” or the third component of the double-three pattern identified as wave Y of Minor degree labeled in green.

The internal structure of wave Y subdivided into another “three” sequence, which advances in its wave ((b)) of Minute degree labeled in black. Likewise, the wave ((b)) follows the arrangement of a triangle pattern. Thus, the GBPCAD cross should develop an upward movement subdivided into five-waves, corresponding to its wave ((c)) of Minute degree identified in black.

Elliott Wave Outlook

Considering the progress of the GBPCAD cross into a triangle pattern, the following 12-hour chart unveils that the price completed its wave ((b)) with the failure of reaching a new lower low at 1.69014, where the cross began to advance in an upward sequence that corresponds to its wave ((c)) of Minute degree identified in black.

The previous chart illustrates the end of the wave (e) of Minuette degree identified in blue and the upward sequence of a potential leading diagonal pattern, which could follow a 5-3-3-3-3 internal sequence. Simultaneously, the price seems to be advancing in its fifth wave of Subminuette degree labeled in blue, which belongs to the first wave of Minuette degree in blue. 

The first impulsive wave of Minuette degree could find resistance in the supply zone between 1.73665 and 1.74341, from where the cross could start to retrace until the demand zone is located between 1.71151 and 1.70262. Once GBPCAD completes its second wave, the third wave could become the upward cycle’s extended wave. This upward movement could drive the pair toward 1.77356 and continue until 1.79911.

The bullish scenario’s invalidation level locates at 1.69014, which coincides with the wave’s origin ((c)) that remains in progress.

Categories
Forex Signals

EURGBP Could Start a New Rally

Description

The EURGBP cross, in its 4-hour chart, exposes an incomplete corrective structure that completed its wave B. The completion of the wave B of Minor degree suggests a new rally corresponding to the advance of wave C of Minor degree labeled in green.

From the EURGBP chart, we distinguish that the upper degree’s corrective formation subdivided into a three-wave sequence and labeled in a Minor degree and marked in green is incomplete. It could develop its third segment corresponding to wave C, which follows a five-wave internal structure.

On the other hand, the wave B internal structure unveils the double-three corrective pattern. According to the Elliott wave theory, the double-three formation follows a 3-3-3 internal sequence and looks labeled as ((w))-((x)-((y)) of Minute degree identified in black.

In summary, the completion of the double-three pattern of Minute degree that belongs to wave B of Minor degree labeled should give way to the upward advance of wave C identified in green. This wave structure could strike at least to level 0.92. However, the price action could lead the price toward the end of wave A at 0.92916.

The short-term bullish scenario suggests the positioning on the long-side looking for a potential target from the current zone, or better, with a potential profit target at 0.9191. The invalidation level locates below level 0.9041.

Chart

Trading Plan Summary

  • Entry Level:0.91012
  • Protective Stop:0.90412
  • Profit Target: 0.91912
  • Risk/Reward Ratio: 1.50
  • Position Size: 0.01 lot per $1,000 in trading account.


Check out the latest trading signals on the Forex Academy App for your mobile phone from the Android and iOS App Store.