Categories
Forex Elliott Wave Forex Market Analysis

Is AUDUSD Turning Bearish?

In our previous technical analysis of the AUDUSD pair, we mentioned the potential corrective formation that was developing. In particular, we warned about the progress of an incomplete fourth wave of Minute degree identified in black, in which the pair was advancing on the wave (b) of Minutette degree in blue.

Technical Overview

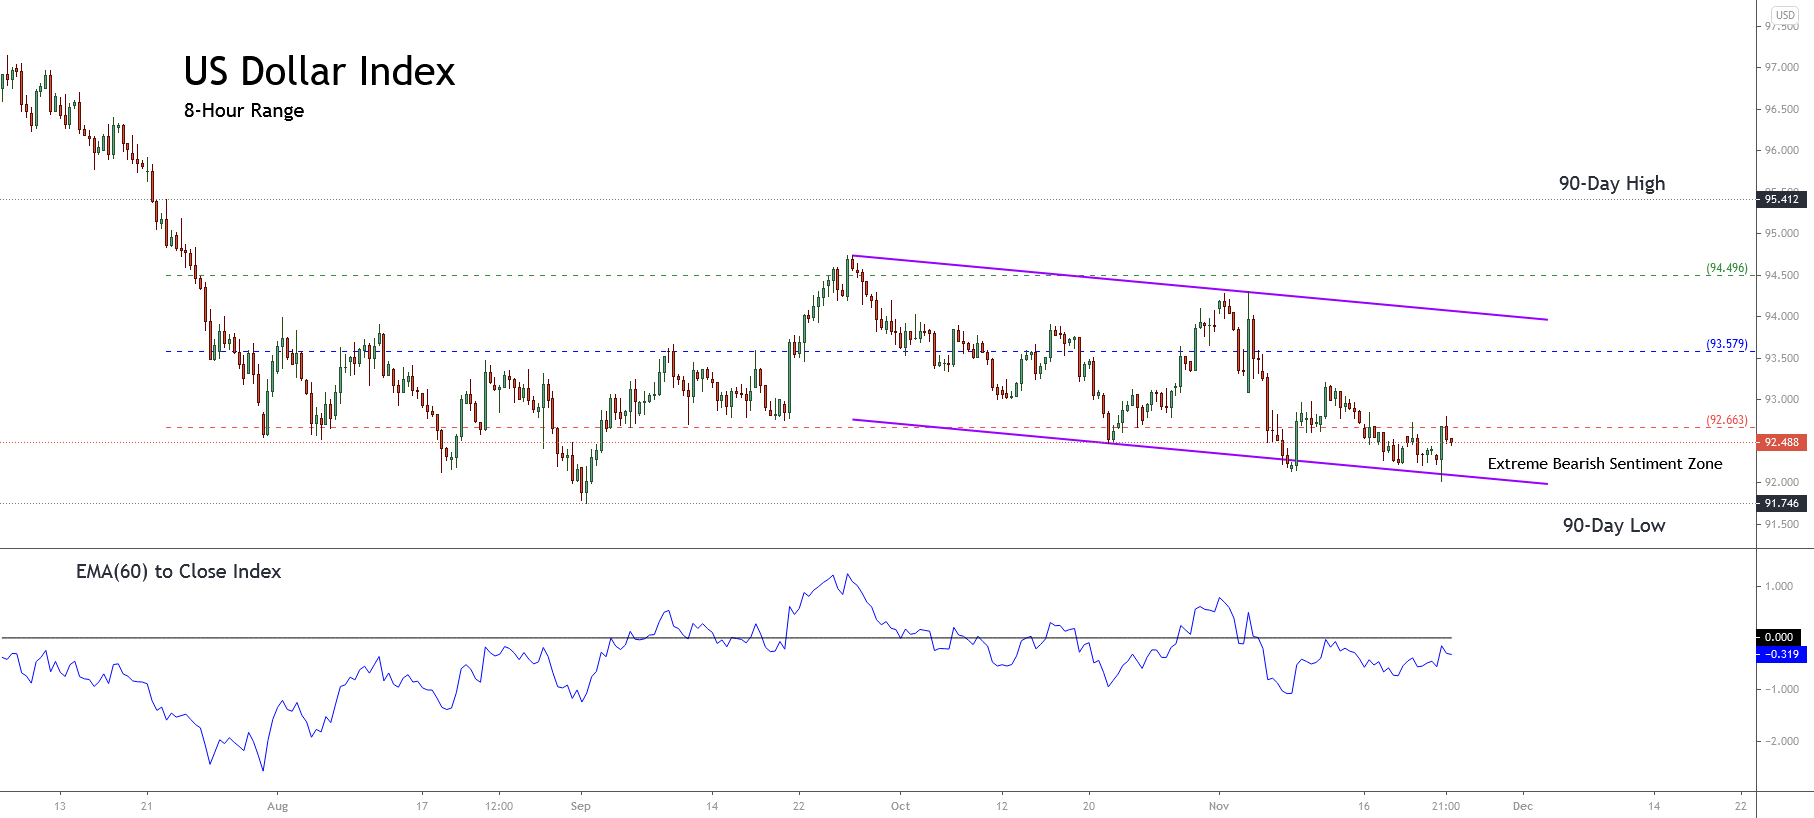
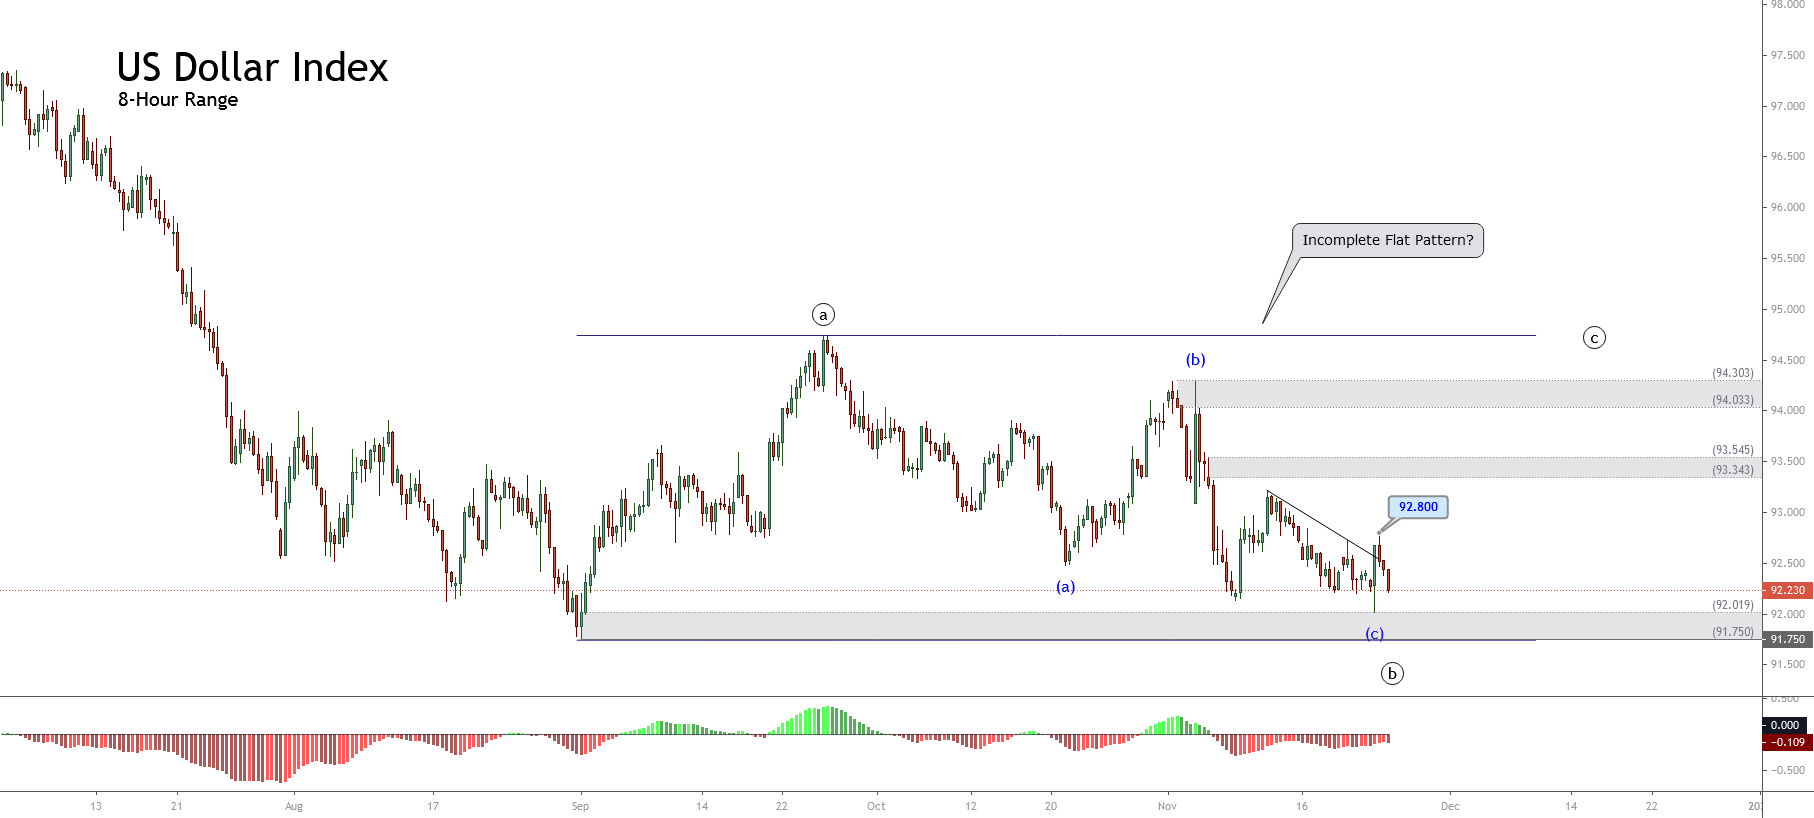
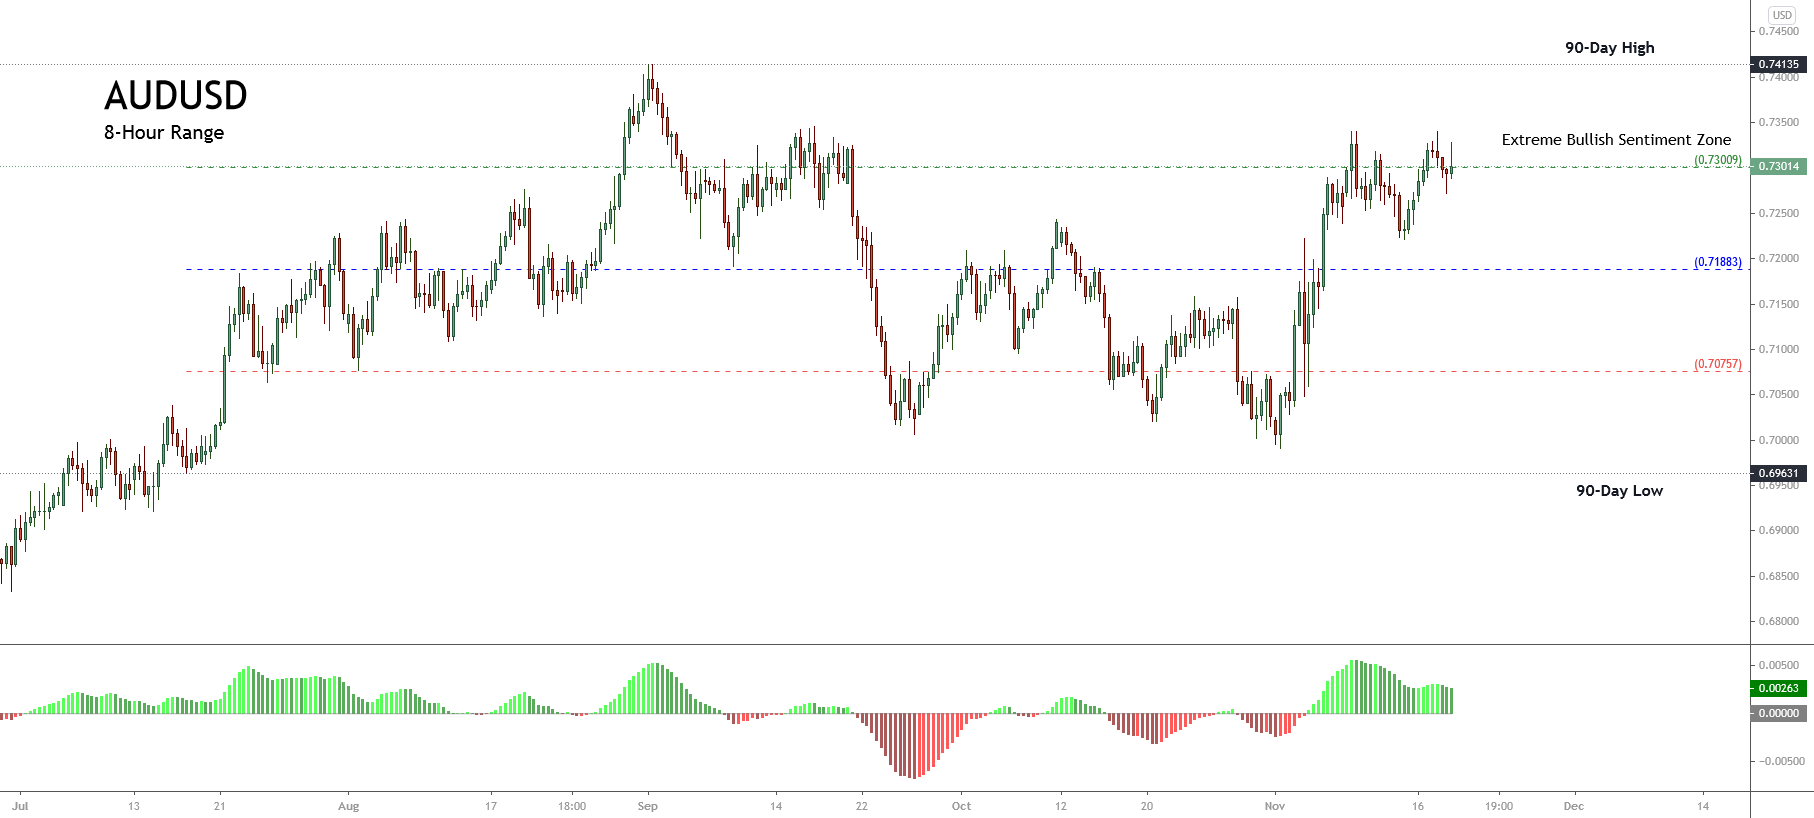
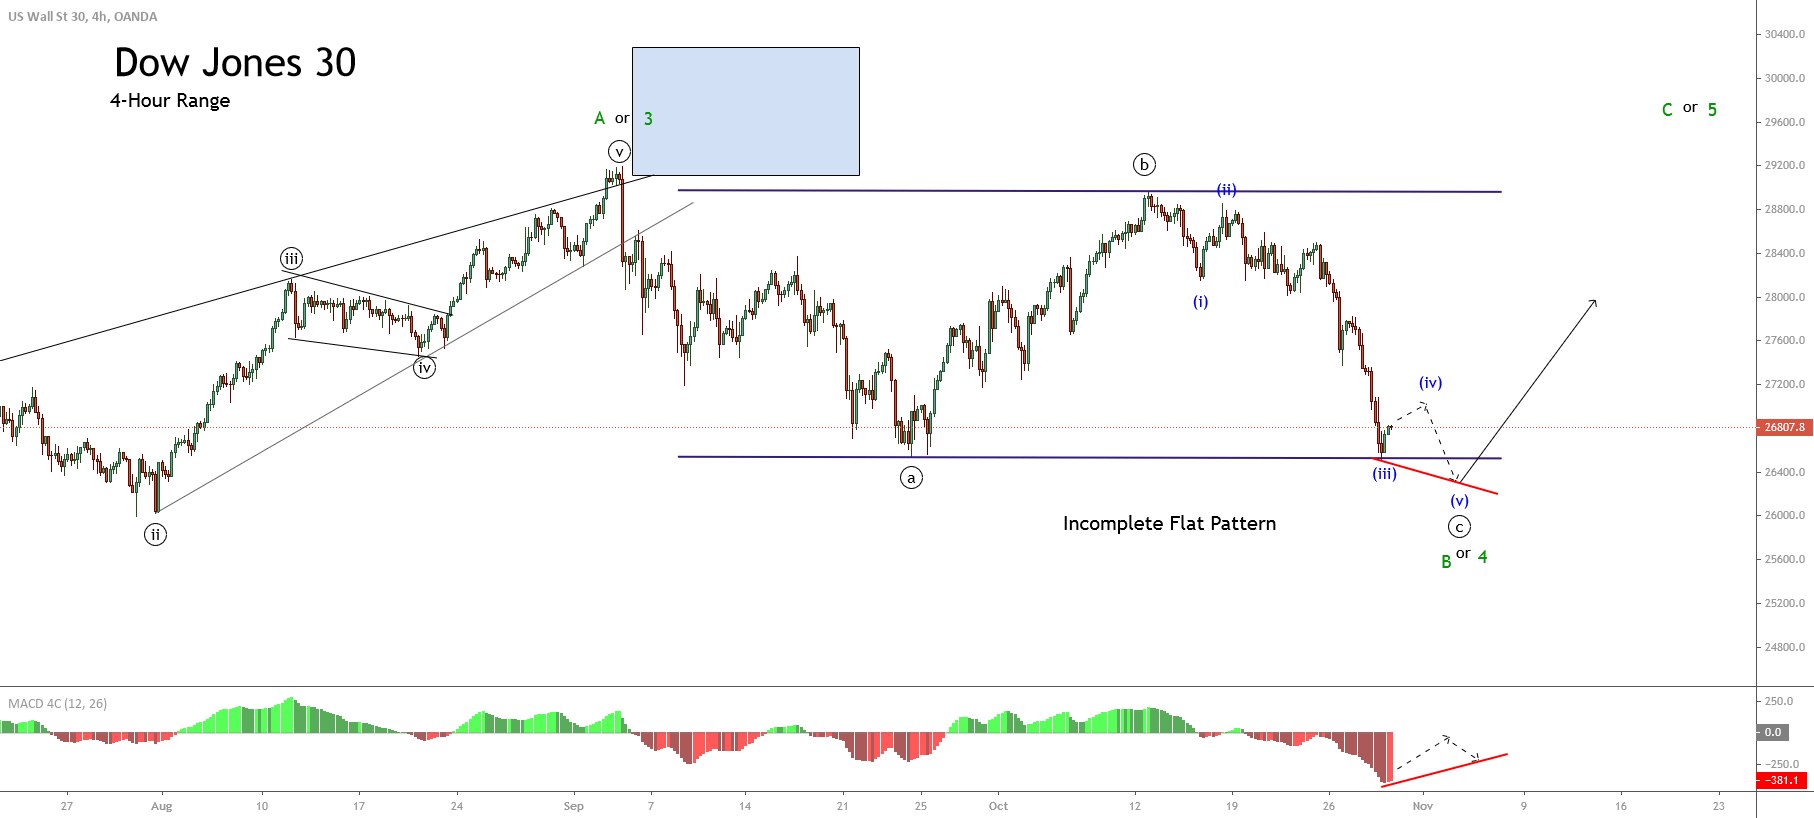
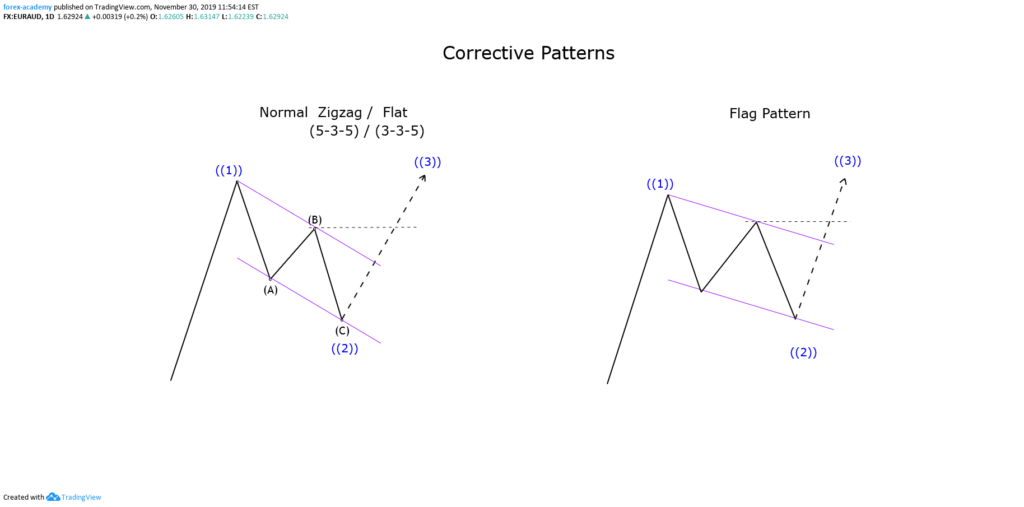
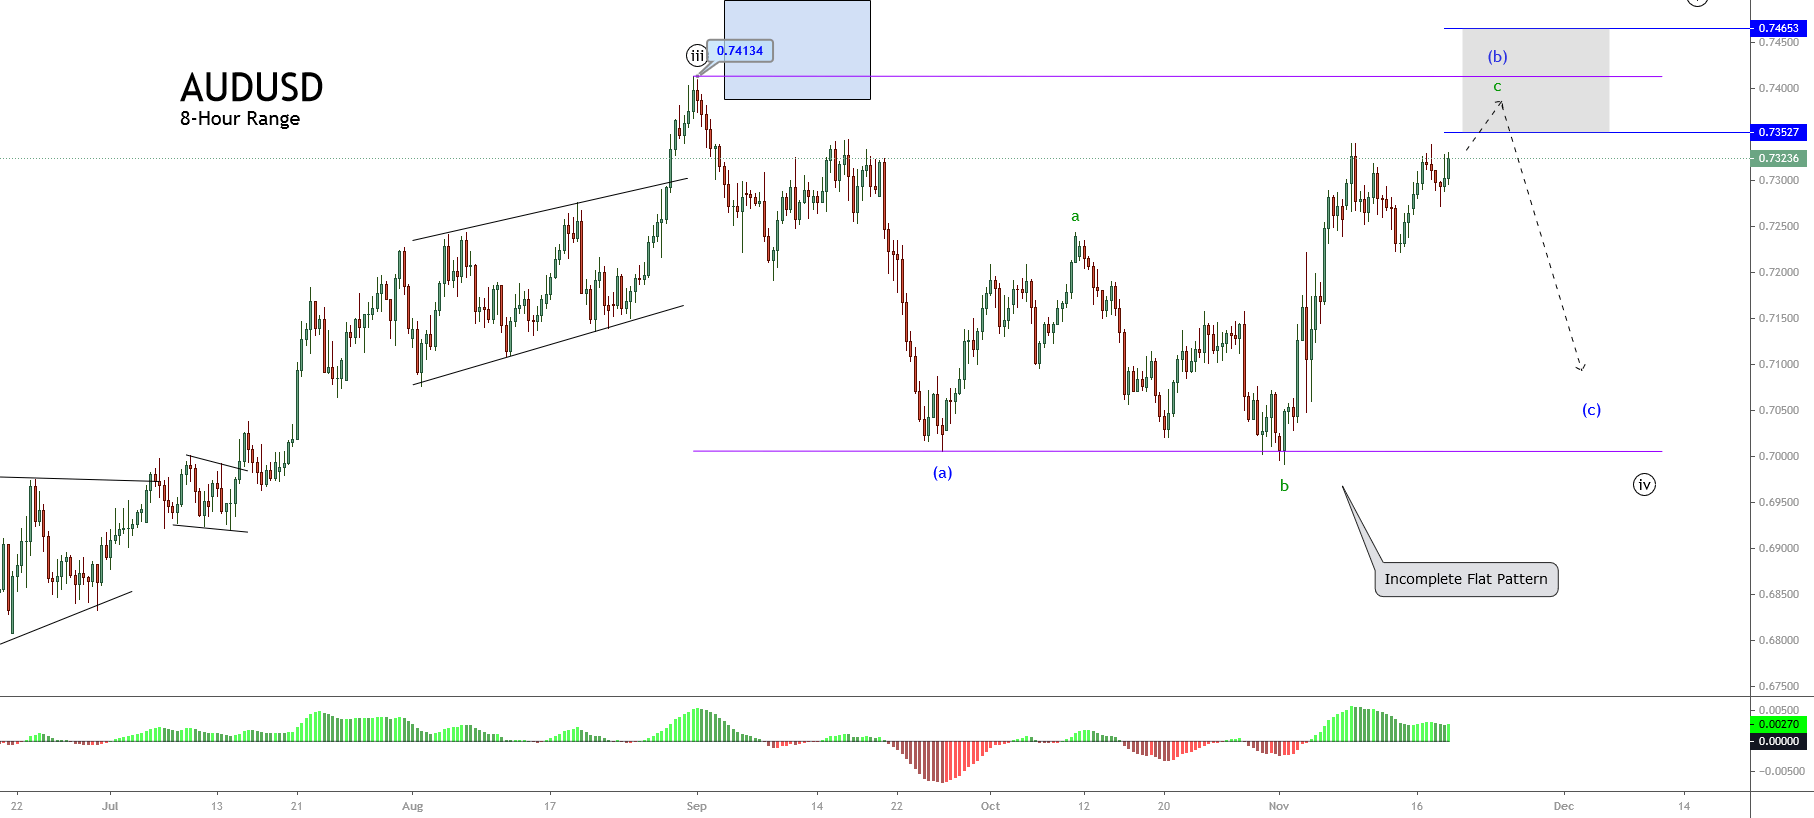
As the previous chart shows, the price action seems moving in a mid-term sideways channel. This formation has been evolving since early September, when the price topped at 0.74134. In terms of the Elliott Wave theory, the figure shows the progression of a likely incomplete flat pattern (3-3-5).

In this context, the bearish rejection below September’s high of 0.74134 should confirm the end of wave (b), in blue, and the beginning of wave (c). Also, according to Elliott’s textbook, the coming wave (c) should follow an internal sequence subdivided into five waves.

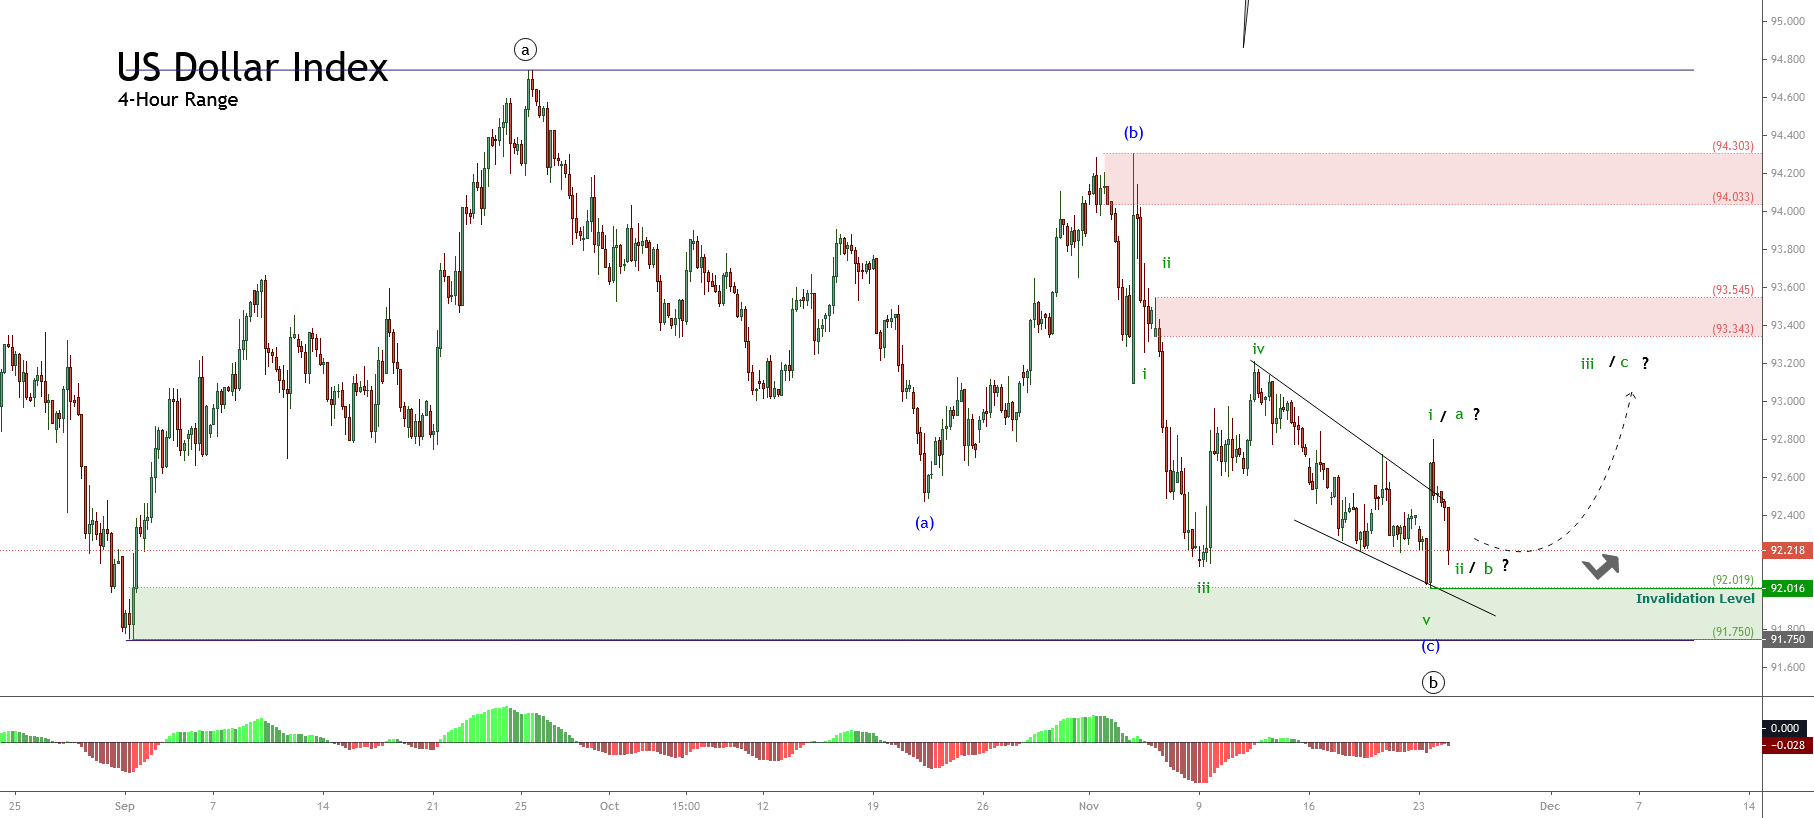
The big picture of the AUDUSD pair currently reveals the gray box’s rejection suggested in our previous analysis. From here, the Aussie could start to decline in a five-wave sequence corresponding to the already mentioned wave (c) of Minuette degree, labeled in blue. 

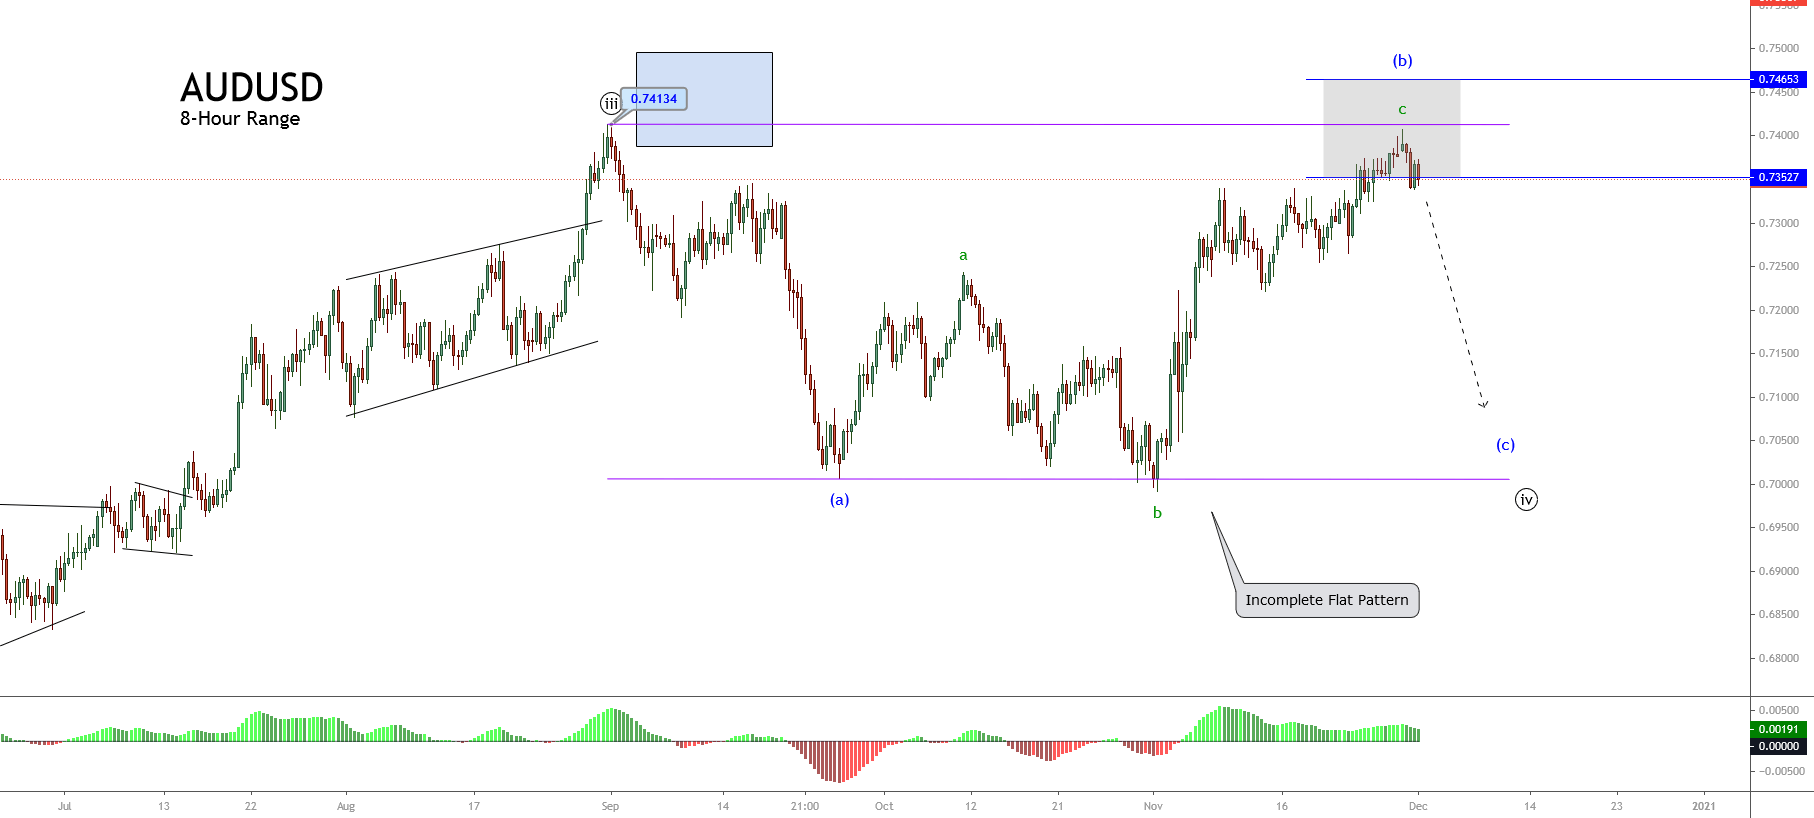
Moreover, after wave (c) completes, the Australian currency should also end its wave ((iv)) of Minute degree in black and giving way to a new impulsive wave corresponding to the fifth wave of the same degree.

Short-term Technical Outlook

The AUDUSD price exposed in the next 2-hour chart reveals the completion of wave c of Subminuette degree identified in green, which topped at 0.74076 on November 30th, as the price action developed an ending diagonal pattern.

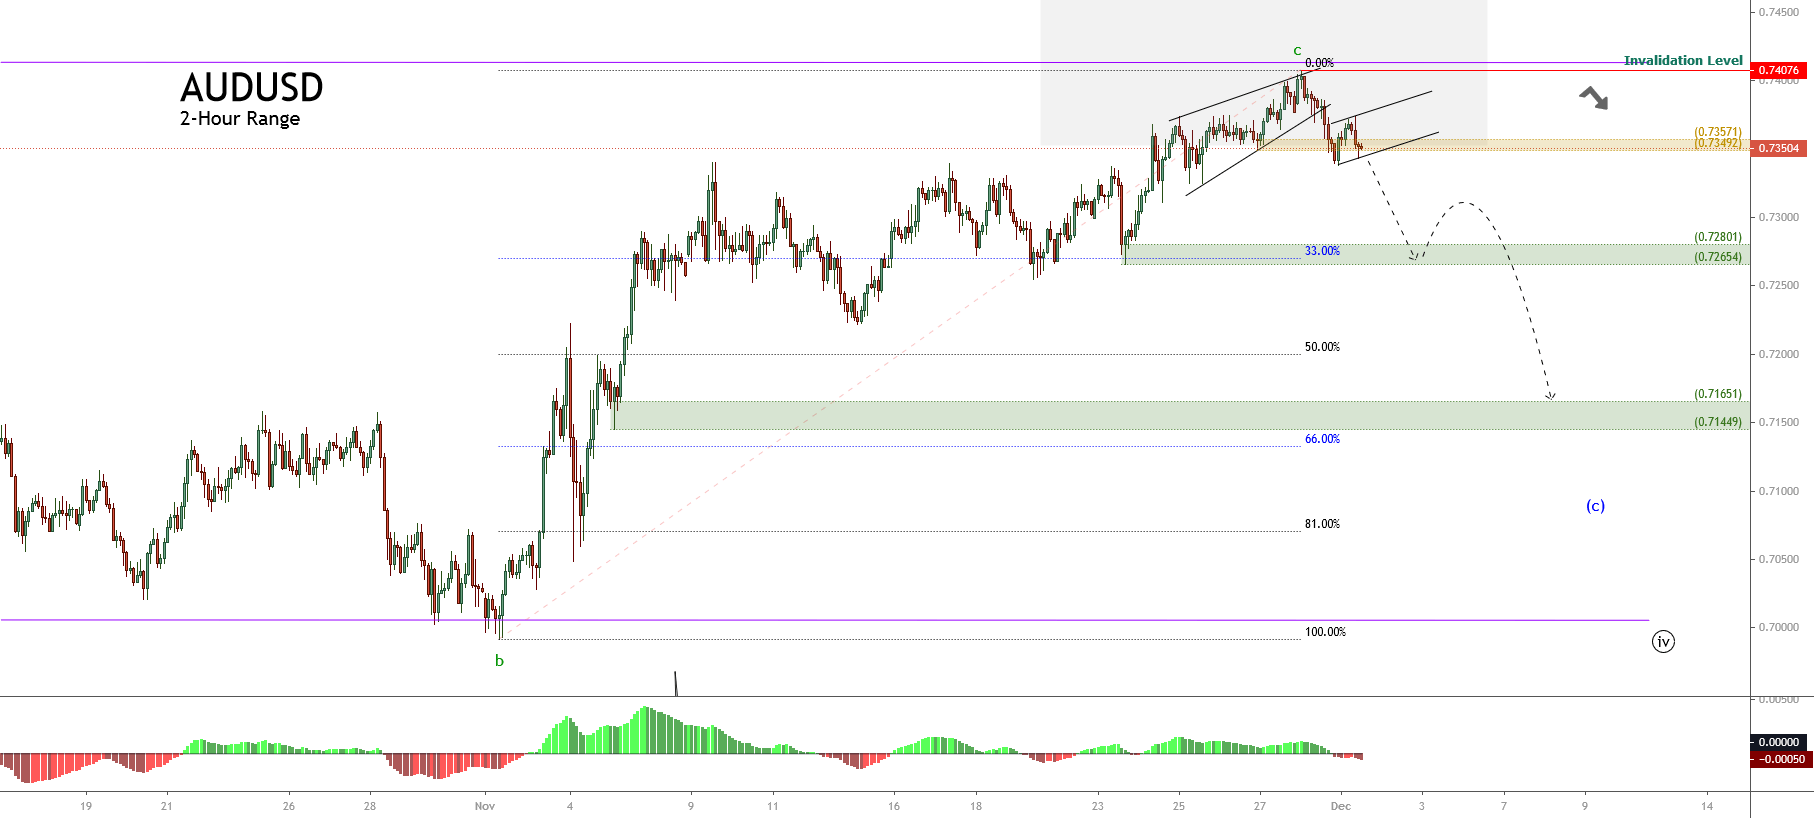
Once the price touched the psychological barrier of 0.74, the price began to decline, developing a breakdown below the baseline of the ending diagonal pattern, piercing the demand zone between 0.73492 and 1.73571, where the Aussie started a consolidation in the current trading session.

Considering that the pair started to consolidate, we expect an intraday sideways formation, likely a flag pattern. In this context, if the price breaks and closes below the baseline of this flag pattern, the AUDUSD could confirm the bearish continuation, which could make it drop to the next demand zone between 0.72654 and 0.72801.

Likewise, the price could extend its declines toward the next demand zone between 0.71449 and 0.71651. The movement, developed into a five-wave sequence, should complete the wave (c) of Minuette degree identified in blue, which, at the same time, could confirm the end of wave ((iv)) of Minute degree labeled in black, as we said earlier.

The invalidation level corresponding to this downward scenario is placed at the high of wave c, in green,  0.74076.

Categories
Forex Elliott Wave Forex Market Analysis

Is the US Dollar Index Ready for a Bounce?

The US Dollar Index (DXY) advances in the extreme bearish sentiment zone finding an intraday support on Monday’s trading session at 92.016. During this intraday bounce, the price jumped to the extreme bearish zone’s resistance, where the price action started to consolidate. Even considering this intraday recovery, the Greenback accumulates losses of nearly 4.40% (YTD).

Technical Overview

The US Dollar Index, represented in its 8-hour chart, shows the market sentiment’s participants moving within its 90-high and low range, and it reveals the bearish pressure on the Greenback. In this regard, as long as the price keeps moving below 92.663, the short-term trend should stay mostly bearish.

On the other hand, the big picture under the Elliott Wave perspective illustrated in its 8-hour chart reveals the progress in an incomplete corrective formation, which could correspond to a flat pattern.

According to the wave theory, the flat pattern follows an internal sequence subdivided into 3-3-5. In this case, the Greenback should advance in a rally in a wave ((c)) of Minute degree identified in black subdivided into five segments.

An alternative scenario considers the possibility of a triangle pattern (3-3-3-3-3) or a double-three (3-3-3) in progress. However, the structure observed until this point doesn’t allow us to confirm or discard any of these potential Elliott wave formations.

Short-term Technical Outlook

The Greenback in its 4-hour range unveils the completion of the wave ((b)) of Minute degree labeled in black in the demand zone between 92.019 and 91.750, where the price bounced from on Monday’s trading session until 92.800.


Once the price reacted mostly upward, the US Dollar Index began to decline in a wave ii or B of Subminuette degree identified in green. In this regard, a bullish confirmation should lead us to expect further upward movements that could boost the price toward the next supply zone between 93.343 and 93.545.

If the Elliott wave formation corresponds to a Flat pattern, the price could surpass the supply zone level of 94.303 and seek to test the end of wave ((a)) located on 94.742.

On the other hand, we should be aware that a rally in the US Dollar Index implies a potential drop in the pairs against the US Dollar, for example, EURUSD or GBPUSD.

Finally, the return to a  bullish scenario holds its invalidation level at 92.016, which corresponds to the bottom of the first upwards move identified in green.

Categories
Forex Market Analysis

AUDUSD Prepares for Employment Data Ahead

Market Overview

The AUDUSD pair during the overnight trading session will be driven by October’s employment data, to be released by the Australian Bureau of Statistics in a few hours. The analysts’ consensus expects an increase of 7.1% in the unemployment rate (YoY), representing a deterioration in the labor market conditions and a rise over the 6.9% reported in September.

The unemployment rate jumped from 5.1% in January to 7.5% in August during the current year. In this context, the Governor of the Reserve Bank of Australia (RBA), Philip Lowe, confirmed the change in the focus from inflation rate to labor market conditions, which according to Governor Lowe, would face “an extended period of higher unemployment than we have become used to.”

On the other hand, the next 8-hour chart illustrates the market participants’ sentiment unveiled by the 90-day high and low range, where the price action looks testing the extreme bullish sentiment zone support located at 0.73009.

Likewise, the Aussie advances in a sideways movement. We can see that, after reaching its yearly high at 0.74135, the Aussie was dragged toward the extreme bearish sentiment zone, where the Australian currency bounced back to the extreme bullish sentiment.

Currently, the re-test of the recent intraday high at 0.7335 leads us to expect further upsides in the following sessions, likely to head to its early September highs at 0.7400.

Short-term Technical Outlook

The short-term Elliott Wave view exposed in the next 8-hour chart reveals the sideways advance in an incomplete flat pattern of Minuette degree identified in blue, which, according to the Elliott Wave theory, follows an internal sequence subdivided into 3-3-5. This corrective pattern in progress belongs to the fourth wave of Minute degree labeled in black.

The previous figure shows the current wave (b) in blue, which began on September 25th on 0.70059. The end of wave b of Subminuette degree identified in green pierced the origin of wave a. That leads us to consider the possibility that the current corrective formation could correspond to an expanded flat pattern

Finally, the current incomplete movement corresponding to wave c in green could advance to the potential target area between 0.7352 and 0.7465. If the price action doesn’t surpass the level 0.7352, then the price could test the sideways channel’s previous lows. 

The alternative scenario is if the price breaks above the 0.74134 level, climbing until 0.7465. Thar means the bullish pressure is strong. In that case, the next decline corresponding to wave c in blue will likely be weaker, ending in a region under 0.71, but no further than 0.70.

Categories
Forex Elliott Wave Forex Market Analysis

Is GBPJPY Brewing a New Decline?

Is GBPJPY Brewing a New Decline?

The GBPJPY cross in its 4-hour chart exposes an upward movement corresponding to an incomplete corrective structural series of Minute degree labeled in black that began at 142.714 on September 01st. In terms of the Wave Theory, the Elliott Wave formation in progress could agree with an incomplete flat pattern. This flat pattern may follow an internal sequence subdivision into 3-3-5 internal waves.

The previous figure shows a corrective rally corresponding to wave ((b)) of Minute degree labeled in black. This structural series shows the breakdown that the GBPJPY cross did after the price found resistance on 140.315. Moreover, the breakdown and consolidation below the intraday upward trendline suggest the completion of the wave ((b)) identified in black.

On the other hand, according to the Elliott Wave Theory, the next move that would correspond to wave ((c)) should follow an internal sequence subdivided into five movements of the Minuette degree labeled in blue.

The current consolidation sequence that is still in progress could correspond to wave (b) of the Minuette degree. However, while the price action doesn’t confirm the breakdown below the low of the November 13th at 137.541, wave (ii) will remain incomplete.

Finally, the wave ((c)) could extend its drops until the short-term ascending trendline that connects the end of waves ((a)) and (b).

Technical Outlook

The intraday Elliott wave view unfolded in the following 2-hour chart illustrates the sideways movement corresponding to an incomplete wave (ii) of the Minuette degree identified in blue. At the same time, the internal structure reveals the price action developing its wave b of Subminuette identified in green.

The previous chart suggests that GBPJPY could develop a limited recovery until the supply zone bounded between 138.65 and 138.965. Likewise, the price action could extend its gains until level 139.32. The cross could find fresh sellers expecting to incorporate their limited short positions with a potential profit target zone of the third wave of Minuette degree in blue locates in the demand zone between 136.45 and 136.03.

The bearish scenario’s invalidation level locates at 140.315, which corresponds to the downward sequence’s origin that remains in progress.


Categories
Forex Elliott Wave Forex Market Analysis

Is USDCAD Ready for a Short-Term Rally?

The USDCAD pair reveals a strong bearish movement that seems have found a short-term bottom. In this regard, the price could start a rally that could boost the price toward October’s highs zone.

Market Sentiment

The USDCAD pair continues moving in its extreme bearish sentiment zone, erasing the gains reached during the first quarter of the year when the price advanced over 13%. Currently, the Loonie gains a modest 0.67% YTD.

The next figure illustrates the USDCAD pair in its daily timeframe. The chart exposes the long-term market participants sentiment bounded by the 52-week high and low range. 

The chart reveals the price action continues developing fresh lower lows, which leads us to observe that market participants continue holding bearish positions on the pair. Furthermore, the 60-day weighted moving average continues above the price, which confirms the bearish bias that advances the price.

On the other hand, as long as the USDCAD price remains below 1.33631, the Loonie will stay under bearish pressure.

Technical Overview

The USDCAD pair exposes a bearish reversal formation that erased the progress developed during the first quarter of the year. The following weekly chart reveals a powerful bearish long-tailed candle in terms of a yearly candlestick, suggesting that the price would continue developing more declines in the long-term.


On the other hand, the big picture exposes a long-term sideways formation that persists since mid-2015. Likewise, the last downward movement that began at 1.46674 appears to have found a bottom on 1.29238 the current trading week. 

In this regard, if the price starts to develop a corrective rally, according to the Dow Theory, the USDCAD pair should advance to 1.35022 and up to 1.40761; this upward sequence would correspond to a valid correction of the same degree that the last bearish move developed by the pair since last mid-March.

The mid-term Elliott wave view of USDCAD illustrated in the next 12-hour chart reveals an incomplete corrective sequence that looks like a double three pattern (3-3-3) of Minor degree labeled, in green, which began on March 18th at 1.46674.

Currently, the USDCAD develops its wave ((b)) of Minute degree identified in black, which belongs to wave Y in green. In this context, the wave ((b)) looks like an incomplete flat pattern (3-3-5), which subdivides into a 3-3-5 sequence. Moreover, the actual structural series suggests that the Loonie started to develop its wave (c) of the Minuette degree labeled in blue. 

Short-term Technical Outlook

The short-term Elliott wave view of the USDCAD unfolded in the following 8-hour chart, anticipates its progress in an incomplete flat pattern, which could be starting to advance on its wave (c) of Minuette degree labeled in blue.

If the Loonie find fresh buyers in a retracement to the demand zone between 1.30433 and 1.30086, and the price breaks and closes above 1.31473, then the price could confirm the potential rally that corresponds to wave (c) of Minute degree with a potential target in the supply zone between 1.33970 and 1.34592.

Lastly, the invalidation level for the intraday bullish scenario locates at 1.29283

Categories
Forex Market Analysis

Dow Jones Turns Bearish As the US Presidential Election Approaches

Overview

The Dow Jones Industrial Average holds its bearish bias expecting the US presidential election scheduled next November 03rd. Throughout this year, the Industrial Average has declined over 6% (YTD). Although the latest decline looks like a short-term top, the US leading benchmark could resume its advances.

Market Sentiment Overview

The Dow Jones Industrial Average (DJIA) accelerated its declines on Wednesday’s trading session, backed by the market participants’ expectations before the US presidential election scheduled next November 03rd.

The following daily chart exposes the short-term market movements of the Industrial Average. The figure shows the penetration below the psychological level of 27,035.1 pts, which indicates the Dow Jones penetrating the bearish sentiment zone.

Simultaneously, the price action reveals its consolidation below the 60-day weighted moving average, which confirms the bearish bias. On the other hand, the re-test of the previous low located at 26,541 pts increases the likelihood of further declines.

The next daily chart unveils the 90-day high-low range of the Dow Jones Volatility Index (VXD). The figure shows the advance of VXD in the bullish sentiment zone, which confirms the bearish sentiment observed in the Industrial Average, as an increasing (bullish) volatility is mostly associated with declining prices.

Therefore, considering both the Industrial Average as the Dow Jones Volatility Index, the short-term market sentiment bias for the DJ-30 remains on the bearish side. The likelihood of extended declines would drive the DJIA toward the extreme bearish sentiment zone.

Technical Analysis Outlook

The big picture of the Industrial Average reveals that the retracement experienced during the last two weeks belongs to the bullish sequence that began on March 23rd when the Dow started its recovery, following the massive mid-February sell-off.

The DJIA’s technical outlook under the Elliott Wave Theory is unveiled in the following log-scale daily chart. We can see that the primary bullish trend that began with March 23rd’s low located at 18,213.5 pts, which is currently in progress.

In the figure, we see DJIA’s price consolidating in a sideways formation. This stage began once the Industrial Average topped at 29,193.6 pts on September 03rd.

On the other hand, we should consider that the sideways formation moves above the 25,570.2 level, or 33% of the bullish sequence of the primary trend. Therefore, the upward trend remains intact right now, and the current correction represents a pause and not a deeper correction for the US benchmark.

The below 4-hour chart shows the Industrial Average under the Elliott Wave perspective, developing an incomplete flat pattern (3-3-5) of Minute degree labeled in black that looks incomplete.

Currently, Dow Jones completed its wave (iii) of Minuette degree labeled in blue, which belongs to wave ((c)) of Minute degree. This structural series that remains in progress moves inside the wave B or 4 of Minor degree labeled in green.

Considering that the flat pattern looks incomplete, the Industrial Average should see a new lower low, which would reveal a bullish divergence on the MACD oscillator confirming the progress on the fifth wave of Minuette degree. After this move, the Dow Jones should develop a wave C or 5 of Minor degree with an internal five-wave sequence.

Therefore, short-term, we may expect a limited decline, likely toward the 26,050 pts, from where Dow Jones could start to develop a new rally in five waves.

Categories
Forex Elliott Wave Forex Market Analysis

Hang Seng Moves in an Incomplete Flat Pattern

Overview

The Hang Seng Index continues advancing mostly sideways in an incomplete bearish sequence, corresponding to a flat pattern sequence, still in progress. Once the current corrective formation ends, the Chinese benchmark will likely start developing a new long-term bullish cycle.

Market Sentiment Overview

The Chinese benchmark Hang Seng Index (HSI) shows a drop of over 12% (YTD). However, even when it has recovered 16 percent from the lows reached after the massive sell-off occurred during the first quarter of the year, the market sentiment of the Chinese benchmark index continues dominated by the bearish side. 

In the following Hang Seng’s daily chart, we can spot its 90-day high-low range. The figure exposes the index developing in a sideways movement happening since the second quarter of the year. On the other hand, the rejection of the 24,953.4 points suggests that the mid-term market sentiment is slightly bearish. 

Besides, considering that the Hang Seng Index moves on the 60-day weighted moving average, a short-term upward pressure is observed.

In conclusion, the Chinese benchmark’s market sentiment seems neutral, waiting for the price action to unveil the next trend’s direction.

Elliott Wave Outlook

Under an Elliott Wave perspective, Hang Seng’s big picture reveals the incomplete corrective movement from the end of a bullish cycle the Hang Seng Index initiated in mid-February 2016 from 18,278.8 pts. This bullish sequence ended its five-wave structural series when the Chinese benchmark reached its all-time high of 33,484.1 pts in late January 2018.

The next figure illustrates the HSI log chart on a 2-day timeframe. The price pattern reveals the Chinese benchmark moving mostly bearish on its wave (C) of intermediate degree labeled in blue, which seems incomplete. In this context, although HSI reached the minimum requirement for this movement: 100% of equal waves between waves A and C, the internal structure of its C wave is unfinished.

The following 4-hour chart exposes the internal structure of wave 4. We distinguish that the corrective structure has created two Minute degree segments, labeled in black on the figure. Considering that each leg follows an internal sequence subdivided into three waves, the Elliott Wave Theory leads us to expect its progression on a regular flat pattern.

On the other hand, short-term, the Hang Seng Index could develop a new upward movement subdivided into a five-wave sequence, which should complete the ((c)) wave of Minute degree labeled in black. Once this move ends, the Chinese benchmark could develop a new decline corresponding to a wave 5 of Minor degree, which should complete the (C) wave of Intermediate degree.

Finally, considering that the third wave of Minor degree labeled in green was the extended move, and considering the amplitude of wave 4, the fifth wave of Minor degree should not penetrate below the low of wave 3 located at 21,139.3 pts. In other words, the wave (C) of Intermediate degree identified in blue is likely not to end below 21,139.3 pts.

Categories
Forex Elliott Wave Forex Market Analysis

NZDUSD Short-Term Wave Analysis

Overview

The NZDUSD pair advances in a sideways corrective formation suggesting the progress in an incomplete short-term flat pattern. The completion of its move could give way to a new bearish movement of the upper degree; however, this incomplete correction could be temporary.

Market Sentiment Overview

The New Zealand Dollar moves slightly bullish this Thursday, 22nd advancing 0.13%, expecting the inflation data released by New Zealand’s Statistics, Stats NZ, in the upcoming overnight session. The data corresponds to the third quarter of 2020, and surveyed analysts expect an increase that could rise to 1.7% (YoY), being 0.2% more than the previous reading published in July.

The New Zealand Dollar futures market sentiment, presented in the following daily chart, unveils the price moving in the extreme bullish sentiment zone. In the chart, we can distinguish  0.6463 as support the level and 0.6797 as the resistance level. A level that corresponds to the 52-week high. 

On the other hand, the chart highlights the price action is moving mainly sideways, consolidating around the weighted moving average of 60 days. This context of price action suggests we can expect a corrective move before continuing its bullish trend.

Concerning the evolution of the Commitment of Traders Report, the previous chart exposes the institutional positioning on the bullish side. In consequence, although the current consolidation calls for a corrective move, the primary trend is bullish.

The next figure unveils that 73% of retail traders currently hold their positions on the bearish side, confirming a contrarian long-term upward bias to this pair.


Elliott Wave Outlook

The NZDUSD short-term outlook under the Elliott Wave perspective unveiled in its 3-hour chart exposes the kiwi’s sideways advance since the oceanic currency topped at 0.67978 on September 18th, where the pair started to develop a corrective structure that remains in progress.

Considering that a corrective structure is subdivided into a three-wave sequence, we can notice in the previous figure that the NZDUAD action progresses in its second wave, identified as wave B of Minor degree, and labeled in green. This segment corresponds to a flat pattern (3-3-5), which currently develops its wave ((c)) of Minute degree identified in black.

At the same time, the internal structure of the wave ((c)) reveals that the price action could be advancing in its wave (v) of the Minuette degree labeled in blue. This market context suggests the possibility of a limited upside before start developing a downward sequence, corresponding to wave C of Minor degree. 

In summary, the short-term outlook for the NZDUSD pair, under the Elliott Wave perspective, foresees a downward move, which corresponds to a wave C of Minor degree. This potential next move may subdivide into a five-wave sequence. Once this corrective formation completes, the Kiwi should begin to develop a new upward impulsive sequence of upper degree coinciding with the long-term institutional bias.

Categories
Forex Elliott Wave

Corrective Waves and the Flag Pattern

Is it possible to simplify the wave analysis and compare it with classic chartist patterns? Identifying Elliott Wave patterns can seem confusing, especially if you are looking to differentiate between a flat or a zigzag pattern. In this educational article, we will look at some of Elliott’s patterns and compare them to traditional chartist figures.

The Normal Zigzag, Flat and the Flag Pattern

In the Elliott wave theory, the zigzag and the flat pattern are formations built by three internal waves. At the same time, depending on the strength of the corrective move, these could be more or less profound. The following figure shows the comparison between a normal corrective wave, which can be a zigzag or flat, and the flag pattern.

If we remember the wave theory, a zigzag pattern follows a 5-3-5 sequence, and the flat structure, a 3-3-5 internal subdivision. However, both formations can be simplified as a three-legs formation. Now, as we can see in the previous figure, the normal Zigzag and Flat structures can be simplified by a flag pattern.

The flag pattern is a chartist figure that represents a pause of the market trend and usually resolves as a continuation of the previous movement. The same situation occurs with the zigzag and flat pattern.

The flag pattern is spotted by a descending (or ascending) move, which connects in a tight range, its highs, and lows within a parallel channel.

The following chart exposes a series of flag formations detected on the GBPJPY cross in its 12-hour range.

On the figure, we observe that Flag patterns are commonly found in financial markets. According to Thomas Bulkowski’s publication, the flag pattern has a break-even or failure rate below 4%, which converts it as a “pretty nice” pattern to trade.

Flag Pattern Trade Setup

The flag trade setup is similar to the zigzag of flat configuration.

  • Entry: The trade is triggered once the price surpasses the end of wave “B,” or the previous swing high or low.
  • Protective Stop: The trade will be invalid if the price drops below the low of the flag.
  • Target: We will determine the profit target level using the Fibonacci expansion tool. The first target will be at the 100% level, as a second target at 127.2%, and the third profit target level will place at 161.8%

Putting All-together

The following chart illustrates the GBPCHF in its 8-hour range. In early January 2019, the cross developed a rally from 1.2248, which drove to the price until 1.2573. Once reached this high, the price action formed a corrective move in three waves. The bullish position was activated once price action surpassed the previous swing at 1.2524.

After the breakout, the price rallied over the three profit targets proposed. Note how the price runs when the flag pattern is tight and high, and the difference when the flag is broad in terms of price and time.

Conclusion

From the analysis realized, we conclude that a corrective structure as a normal zigzag or flat formation can be simplified as a flag pattern. This simplification could aid the traders in reducing the time analysis elapsed to the decision process before to place an order.

The confidence level of this pattern as a continuation figure could contribute to reducing the risk in the trading process.

Categories
Forex Elliott Wave

Understanding the Flat Pattern

The flat pattern is a corrective formation that runs in a 3-3-5 sequence. Also, compared with other Elliott wave patterns, it has the most extensive variations. In this educational article, we will review the characteristics of the flat correction and its varieties.

The Broad Concept

The flat structure is one of the three basic corrective patterns described by R.N. Elliott in his hork “The Wave Principle.” This formation has an internal 3-3-5 sequence. The next figure illustrates the basic concept.

The main characteristic of the flat pattern is that wave B tends to extend more than 61.8% of wave A.

Even wave B can surpass 100% of wave A. Depending on its extension, wave B will be weak, regular, or strong. As a summary,

  • Wave B is Weak if wave B retraces between 61.8% and 81% of wave A.
  • Wave B is Regular if wave B retraces between 81% and 100% of wave A.
  • Wave B is Strong if wave B retraces more than 100% of wave A.

On the other hand, wave C must be above or equal to 38.2% of wave A. Additionally, wave C tends to variate its extension depending on the wave B strength.


  1. Strong Flat: If wave B retraces over 100% and less than 127.2% of wave A, likely, wave C completely retraces wave B.
    In case that wave B retraces more than 127.2% of wave A, it is highly probable that wave C does not retraces completely wave B.
  2. Regular flat: It occurs when wave B retraces between 81% and 100%. In this case, it is highly likely that wave C retrace completely wave B.
  3. Weak flat: In case that wave B retraces between 61.8% and 81% of A, it is possible that wave C retrace over 100% of wave B.

Measuring the Flat Pattern

The Gasoline daily chart illustrates a flat structure. The measuring process of wave A makes us observe that wave B retraces between 618% and 81% of wave A.

In consequence, as said previously, the corrective pattern corresponds to a weak flat structure. Thus, we should expect a wave C that retraces over 100% of wave B, as shown in the following chart.


In summary, the measuring process of wave B of a flat pattern is a useful process that could allow you to identify the potential extension of wave C.

Categories
Forex Elliott Wave

Trading the Elliott Wave Principle – Part 4

The flat pattern is the second fundamental Elliott Wave corrective structure. In this educational article, we will review the guideline to trade the flat structure.

The basics

Flat pattern is an Elliott wave corrective structure built by three waves, and its internal sequence is 3-3-5. There exist a single model to trade a flat formation. The following chart shows the trading setup of a flat corrective structure.


From the basic model, the entry is given once price action breaks and closes above wave 4 labeled in blue, of wave (C) labeled in black. The profit target is placed in the same way as the zig-zag trade setup. It is at 100%, 127.2%, and 161.8% of the Fibonacci projection of waves ((1)) and ((2)) labeled in red. The invalidation level is under the end of the wave (C).

Trading the flat pattern

Before to define place an order, we must answer the question, “Do I see some Elliott wave pattern?”.

In the example, the IBM (NYSE:IBM) in its 8-hour chart shows a first five waves bearish sequence started on April 10, 2014. Once IBM founded buyers on January 29, 2015, at $149.52 per share, the price developed a three waves movement as a flat pattern, which ended at $176,25 on May 04, 2015.


If our hypothesis is correct, it is the Elliott wave pattern recognized is a flat structure, we can do our trading plan. The entry should be placed after the completion of the second wave (B) or (2) labeled in black degree.

The short position is triggered after the breakdown and close below the last swing at $168.75. The target is defined using the Fibonacci projection between (A) and (B) waves. In our example, IBM reached the first target at $126.53 on 100% of the Fibonacci projection.

The third part of the trade is to manage the risk of the trading plan. The first stage is to reduce the risk; for this stage, we set the invalidation level above the end of wave (B) or (2) at $176.25. Once IBM plummets, we eliminate the risk after the price drops into the 61.8% of Fibonacci projection at $145.60.

Finally, we have to protect the open profits, for example, each $5 of advance, we can move the protective stop each $5 of progress.

Categories
Forex Elliott Wave

Corrective Waves Construction – Part 3

The second basic corrective formation is the Flat Pattern. Although this structure has three waves, it is different from the zig-zag. In this article, we will describe the structure of the Flats.

The basics

A Flat structure is an irregular corrective formation that contains three segments and built by a 3-3-5 sequence. If the price action breaks a motive wave rule, and the structure does not correspond to a zig-zag pattern, we are likely facing a 3-3-5 formation.

In a flat pattern tends to retrace less of the last impulsive move. Also, this corrective formation tends to occur after a strong trend; it means when the major trend is strong. In the following figure, we observe the basic structure of the flat formation.


Flat pattern variations

There are three types of Flat patterns: regular, expanded, and running flat. In a regular flat correction, wave B moves between the 2/3 and 100% of wave A, and wave C could travel from the 100% to 1/3 beyond of wave A.

In an Expanded Flat, wave B moves over the origin of wave A, and wave C extends ahead of wave A.

The Running flat structure, unlike the Extended Flat, characterizes by the extension of wave C, which ends before the end of wave A.

In the next diagram, we can appreciate the different flat formations.


Channeling in flat formations

A useful tool to identify a flat pattern is the channel. The channeling process allows us to visualize the potential next movement of the market.

The channeling process starts by tracing a horizontal line from the origin of wave A. Once completed; it must project the base-line at the end of wave A.

The next figure shows the different variations of the flat pattern.


The flat pattern in action

The e-mini SP 500 future (CME:ES) on its daily chart shows a sell-off started on October 03, 2018, when the price reached at 2,944.75 pts. The first decline was developed in three waves. As says the canalization process for this structure, we trace a horizontal channel from the origin to the end of wave A.

After this movement, ES made a sideways move in another three waves. Finally, the e-mini began a second bearish leg developed in five internal waves until 2,316.75.