Is it possible to simplify the wave analysis and compare it with classic chartist patterns? Identifying Elliott Wave patterns can seem confusing, especially if you are looking to differentiate between a flat or a zigzag pattern. In this educational article, we will look at some of Elliott’s patterns and compare them to traditional chartist figures.

The Normal Zigzag, Flat and the Flag Pattern
In the Elliott wave theory, the zigzag and the flat pattern are formations built by three internal waves. At the same time, depending on the strength of the corrective move, these could be more or less profound. The following figure shows the comparison between a normal corrective wave, which can be a zigzag or flat, and the flag pattern.
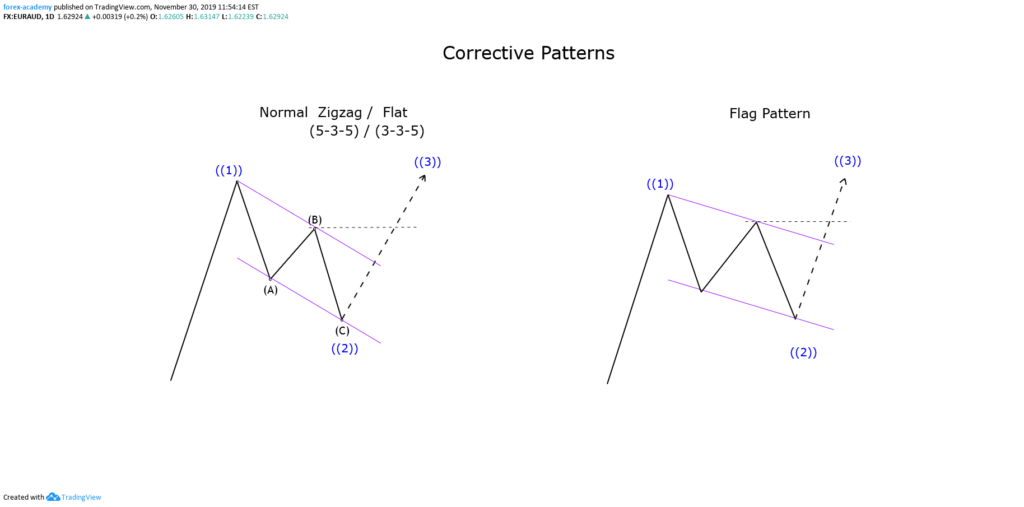
If we remember the wave theory, a zigzag pattern follows a 5-3-5 sequence, and the flat structure, a 3-3-5 internal subdivision. However, both formations can be simplified as a three-legs formation. Now, as we can see in the previous figure, the normal Zigzag and Flat structures can be simplified by a flag pattern.
The flag pattern is a chartist figure that represents a pause of the market trend and usually resolves as a continuation of the previous movement. The same situation occurs with the zigzag and flat pattern.
The flag pattern is spotted by a descending (or ascending) move, which connects in a tight range, its highs, and lows within a parallel channel.
The following chart exposes a series of flag formations detected on the GBPJPY cross in its 12-hour range.
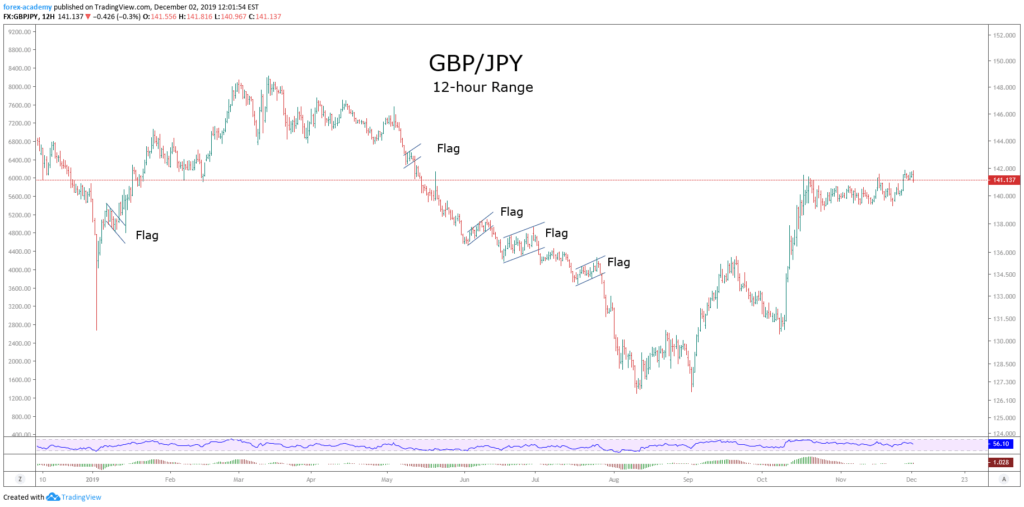
On the figure, we observe that Flag patterns are commonly found in financial markets. According to Thomas Bulkowski’s publication, the flag pattern has a break-even or failure rate below 4%, which converts it as a “pretty nice” pattern to trade.
Flag Pattern Trade Setup
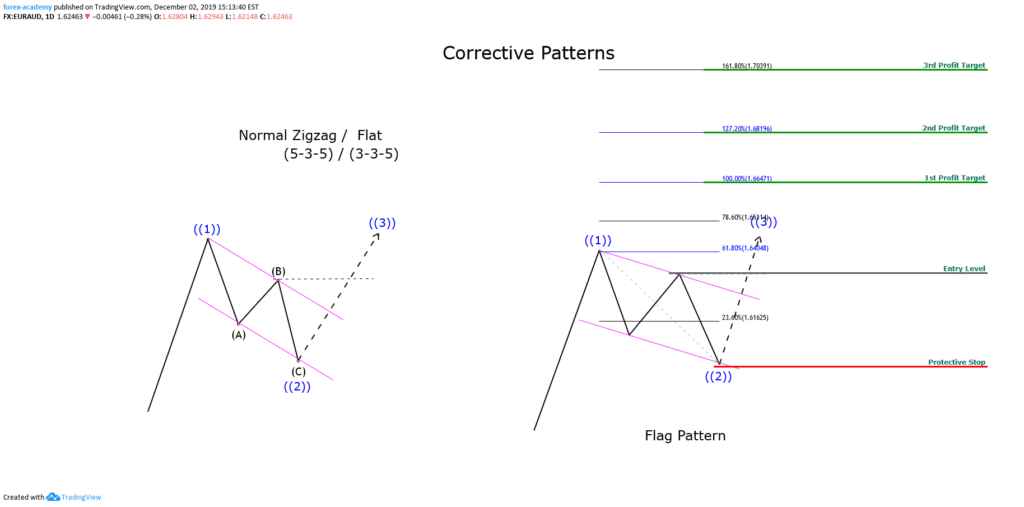
The flag trade setup is similar to the zigzag of flat configuration.
- Entry: The trade is triggered once the price surpasses the end of wave “B,” or the previous swing high or low.
- Protective Stop: The trade will be invalid if the price drops below the low of the flag.
- Target: We will determine the profit target level using the Fibonacci expansion tool. The first target will be at the 100% level, as a second target at 127.2%, and the third profit target level will place at 161.8%
Putting All-together
The following chart illustrates the GBPCHF in its 8-hour range. In early January 2019, the cross developed a rally from 1.2248, which drove to the price until 1.2573. Once reached this high, the price action formed a corrective move in three waves. The bullish position was activated once price action surpassed the previous swing at 1.2524.
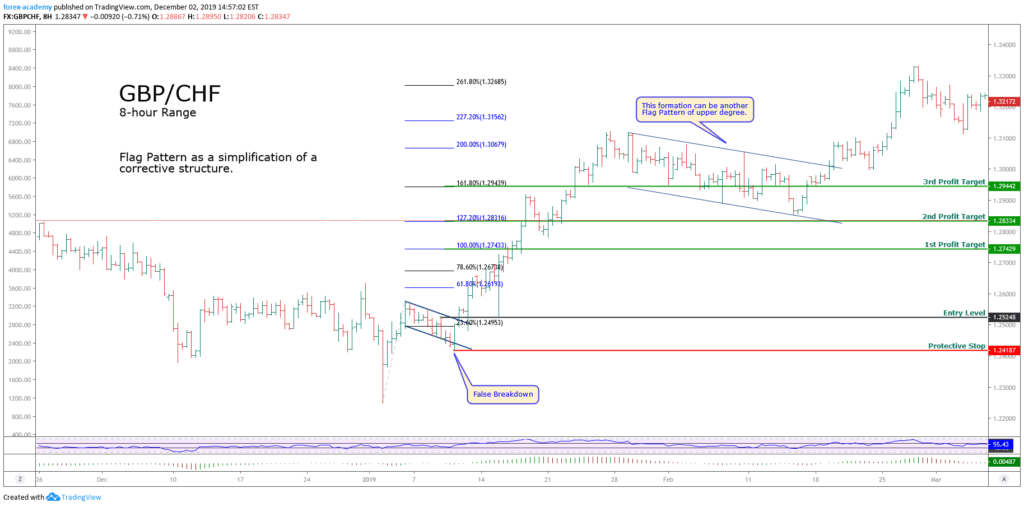
After the breakout, the price rallied over the three profit targets proposed. Note how the price runs when the flag pattern is tight and high, and the difference when the flag is broad in terms of price and time.
Conclusion
From the analysis realized, we conclude that a corrective structure as a normal zigzag or flat formation can be simplified as a flag pattern. This simplification could aid the traders in reducing the time analysis elapsed to the decision process before to place an order.
The confidence level of this pattern as a continuation figure could contribute to reducing the risk in the trading process.