Categories
Forex Elliott Wave Forex Market Analysis

Why GBPJPY Plummeted in Friday’s Session?

The GBPJPY cross declined on Friday trading session dragged 0.70% after the price surpassed the psychological barrier of 142, being the highest level reached since early September 2020.

Technical Overview

The GBPJPY cross drops over 100 pips on the last trading session of the week, accumulating a modest advance of 0.02% (YTD) since the yearly opening.

On the fundamental side, the industrial production in the United Kingdom eased 4.7% (YoY) in November 2020, informed the Office for National Statistics on Friday. The reading is worse than the decline of 4.2% expected by analysts. Likewise, both coronavirus lockdown and the Brexit uncertainty contributed to the decline in the industrial output.

Source: TradingEconomics.com

On the other hand, the doubts in the fourth quarter 2020 earnings season kick-off and the elected U.S. President Biden’s stimulus plan seem not enough to keep fueling the stock market participants’ euphoric sentiment. This context looks fading the record highs in the stock market, boosting the risk-off bias pushing lower the GBPJPY cross.

The big-picture illustrated in the next daily chart shows the price action moving in the extreme bullish sentiment where the cross ended the Friday session unveiling a bearish engulfing pattern, which carries to expect further declines in the coming trading sessions.

Finally, the piercing below the yearly opening level at 140.779 suggests potential declines during the first quarter of 2021.

Technical Outlook

Our previous analysis saw the progress in a complex correction identified as a double-three pattern (3-3-3). Nevertheless, the corrective rally suggests that the GBPJPY moves in a triple-three formation (3-3-3-3-3), which looks in its terminal stage.

The following 4-hour chart shows the completion of a triple-three pattern of Minute degree labeled in black, which moves inside a wave B of Minor degree identified in green since the cross found support at 133.040 touched in last September 22nd.

The internal structure of wave ((z)) in black shows its last corrective leg corresponding to wave (c) in blue, developing an ending diagonal pattern, which seems finished its wave v of Subminuette degree labeled in green. The breakdown of the guideline that connects the end of waves ii with iv carries to support the ending diagonal pattern’s finalization.

On the other hand, the timing indicator exposes the intraday oversold (see the yellow circle), which leads to the conclusion that the GBPJPY cross should develop an upward retracement as a flag pattern before continuing with its potential further decline.

In summary, the GBPJPY cross plummeted in last Friday’s session dragged by the completion of an ending diagonal pattern, which belongs to wave ((z)) of a triple-three formation, where its upper degree sequence corresponds to wave B of Minor degree. Although the news media continue supporting hopes in the stimulus plan for the U.S. economy, the Elliott wave structure showed by the cross unveils a different story.

According to the Elliott wave theory, the price should develop a downward wave C of Minor degree. The timing oscillator also suggests an intraday upward consolidation likely as a flag pattern before continuing its drops.

If you are interested in expanding your knowledge about the Elliott wave theory from the basics to advanced, visit our Forex.Academy Educational Section.

Categories
Forex Market Analysis

GBPJPY Under the Bearish Pressure

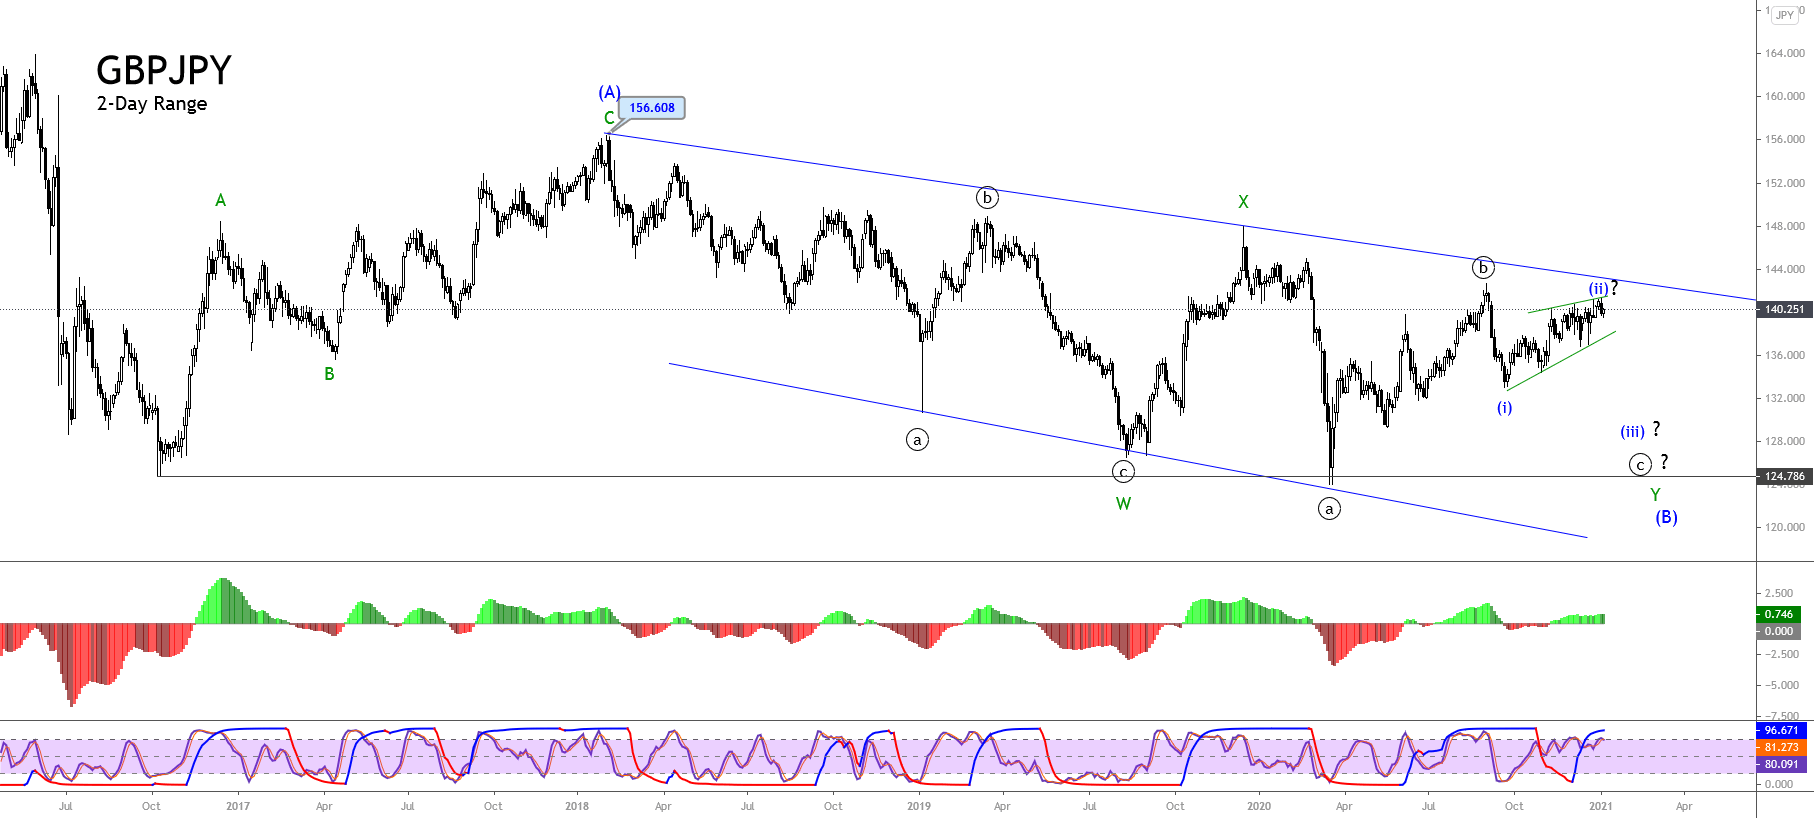
The GBPJPY cross continues moving in an incomplete long-term sideways corrective pattern of Intermediate degree that remains active since the price found support at 124.786 in early October 2016. The Elliott wave sequence in progress suggests the possibility of a new decline for the coming trading sessions.

Technical Overview

The following figure illustrates the GBPJPY cross in its 2-day range, developing a sideways formation of Intermediate degree labeled in blue, which could correspond to an incomplete, irregular flat pattern (3-3-5). This Elliott wave formation began in early October 2016 when the price found support at 124.786 and rallied until 156.608 reached in early February 2018 when the price completed its wave (A) identified in blue.

The previous chart exposes the downward advance of wave (B) in blue, which began once the cross topped at 156.608. In this context, wave (B) internal structure seems like a double-three pattern of Minor degree labeled in green, which currently advances in its wave Y.

Likewise, the lower degree sequence shows the progress in its incomplete wave ((c)) of Minute degree identified in black, which began in early September 2020 when the price found fresh sellers at 142.714.

According to the textbook, the wave ((c)) in progress should follow an internal sequence subdivided into five waves. In this context, the lower degree structure of GBPJPY might move in its second wave (ii) of Minuette degree labeled in blue. Thus, completing this corrective rally should give way to a new decline corresponding to wave (iii).

Technical Outlook

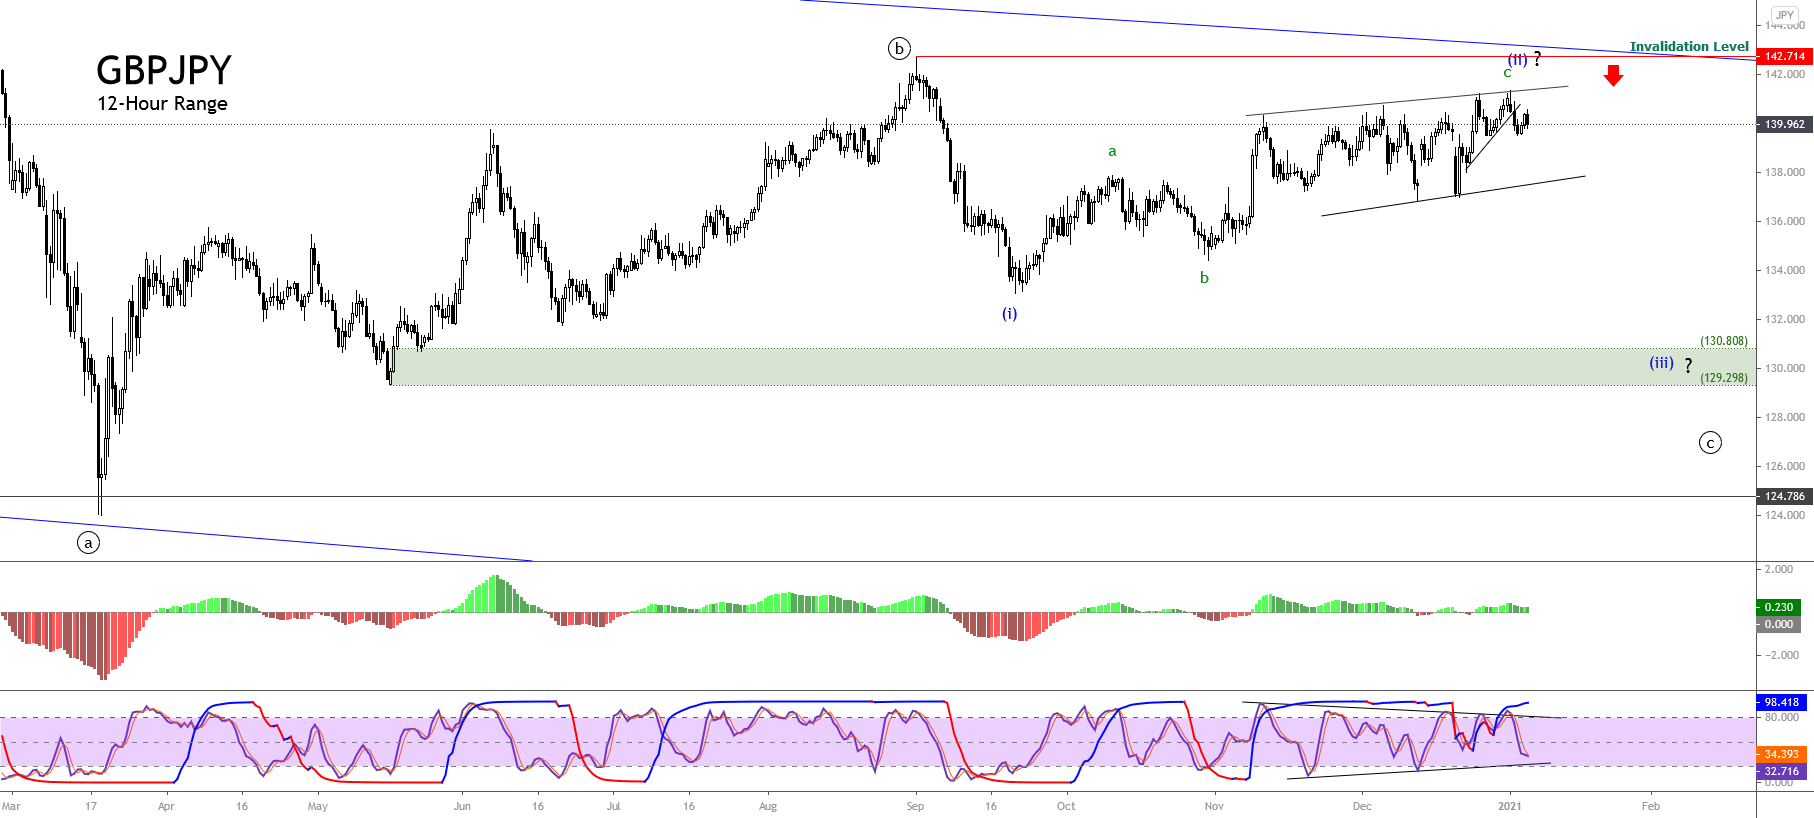
The next 12-hour chart shows the GBPJPY advancing in the wave c of Subminuette degree labeled in green inside the corrective rally corresponding to wave (ii) in blue. The completion of this corrective formation could correspond to an incomplete ending diagonal pattern suggesting a new decline.

The new decline’s potential bearish target corresponding to wave (iii) in blue locates in the demand zone between 130.808 and 129.298. On the other hand, the downward scenario’s invalidation finds at the top of the wave (i) at 142.714, corresponding to the last September 01st high.

In summary, the GBPJPY cross advances in an incomplete sideways corrective formation, which its internal structure suggests the progress in a complex double-three pattern. The lower degree structure exposes the advance of wave (ii), which seems incomplete. In this regard, the ascending base-line breakdown should confirm the potential next decline, which has a potential target the demand zone located between 130.808 and 129.298. Finally, the bearish scenario forecasted will be invalid if the price surpasses and closes above 142.714.

Categories
Forex Elliott Wave Forex Market Analysis

Beware of these Supply and Demand Zones on the GBPJPY

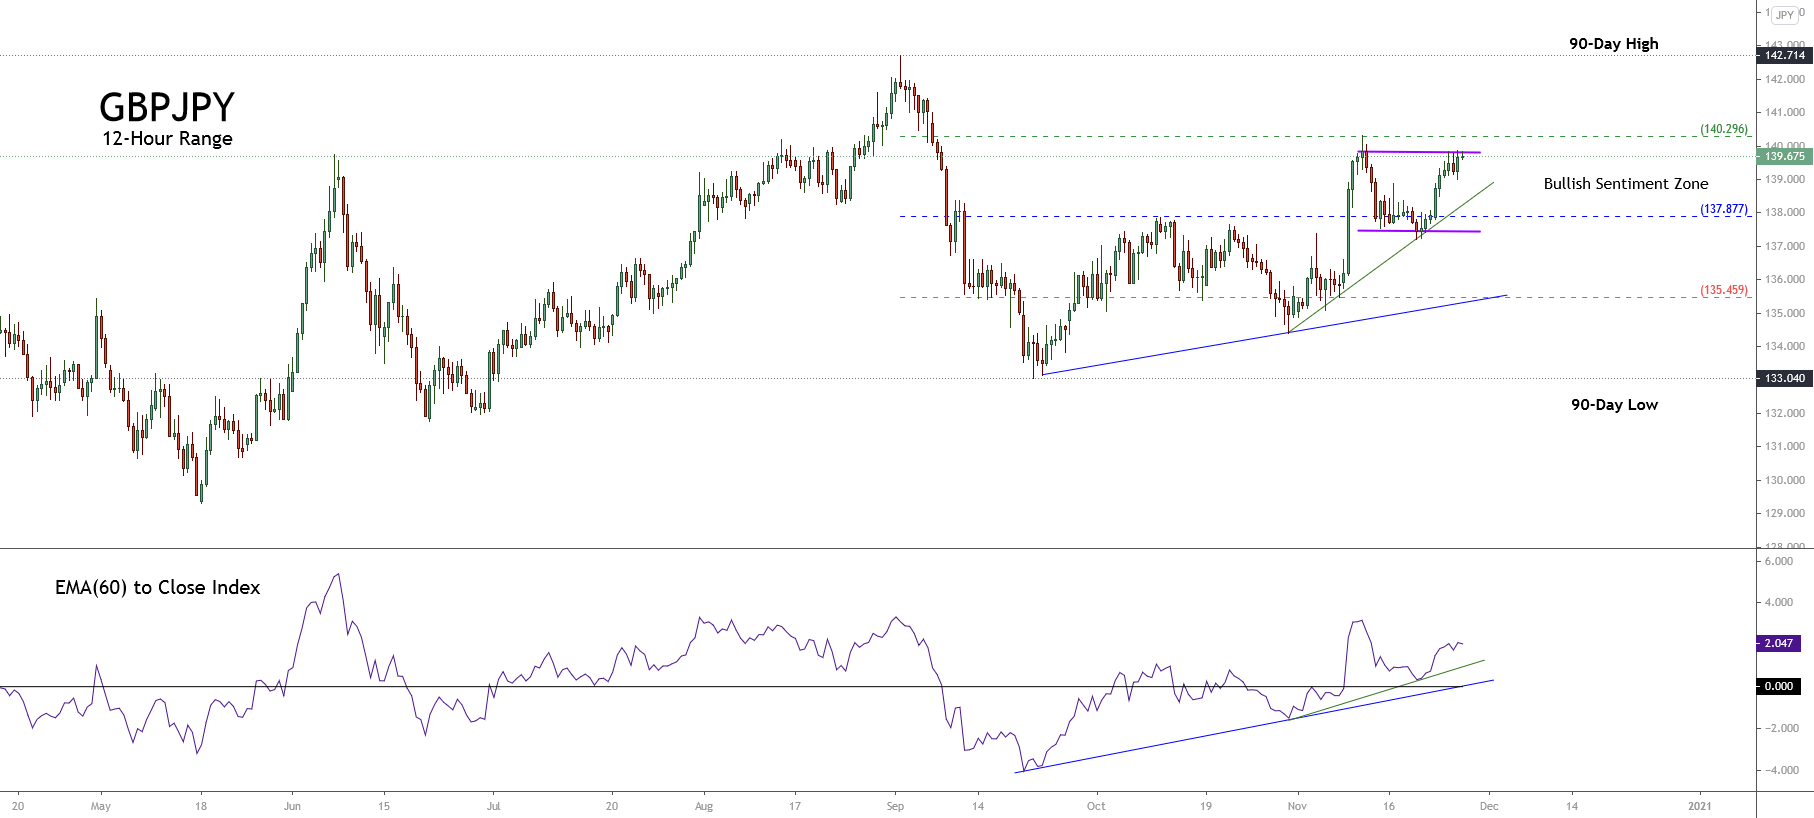
The short-term overview for the GBPJPY pair reveals the sideways movement in a trading range bounded by its 90-day high and low range between levels of 133.040 and 142.714. The cross recently developed a rally that found resistance in the bullish sentiment zone resistance located on 140.296, where the GBPJPY presents a set of scenarios.

Technical Overview

The following 12-hour chart illustrates the short-term market participants’ sentiment bounded by the 90-day high and low range. The figure presents a bullish bias that remains active since the GBPJPY found fresh buyers on 133.040.

After the cross found resistance at 140.296, the price action retraced it until a neutral zone located on 137.877, forming an intraday sideways channel that suggests a pause in the short-term bullish cycle.

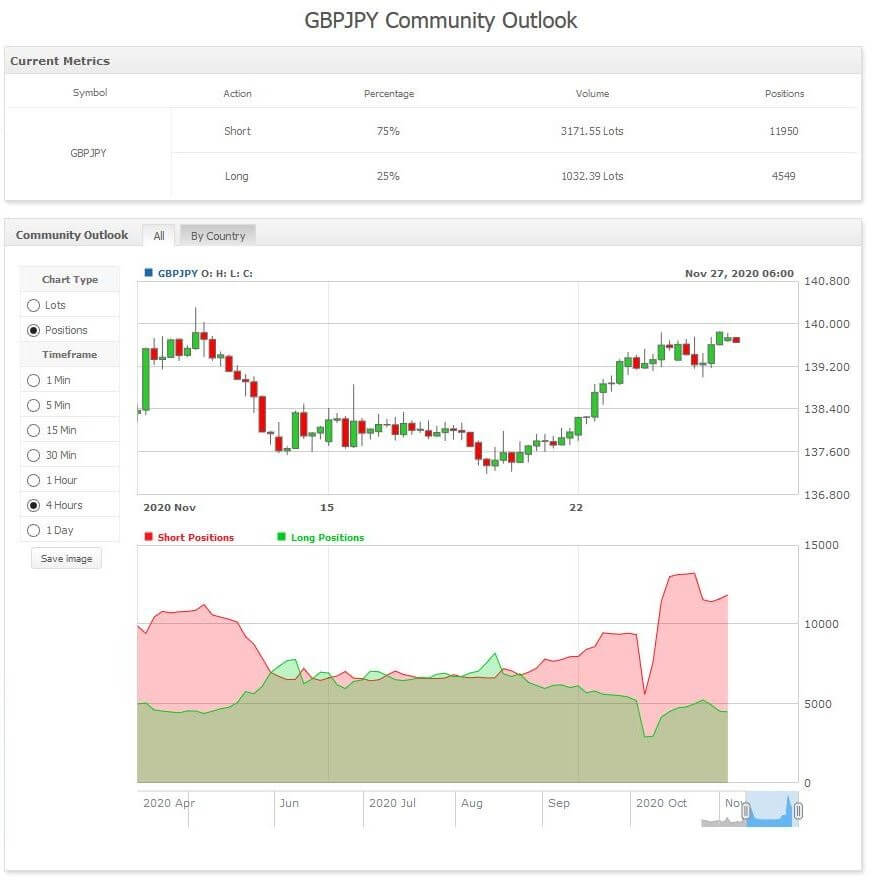
On the other hand, the following figure unveils that the retail traders’ market sentiment is positioned on the bearish side. As the chart shows, 75% of retail traders hold their positioning on the sell-side, which is contrarian.

(source: myfxbook.com)

In this context, we can see that numerous retail traders are expecting a downward movement, while the price action remains moving in the bullish sentiment without exposing a reversal pattern. Thus, it is plausible the GBPJPY pair could develop a new upward movement.

Short-term Technical Outlook

The short-term Elliott Wave view shows a movement inside an incomplete corrective wave of Minor degree, labeled in green, which could be in its wave C

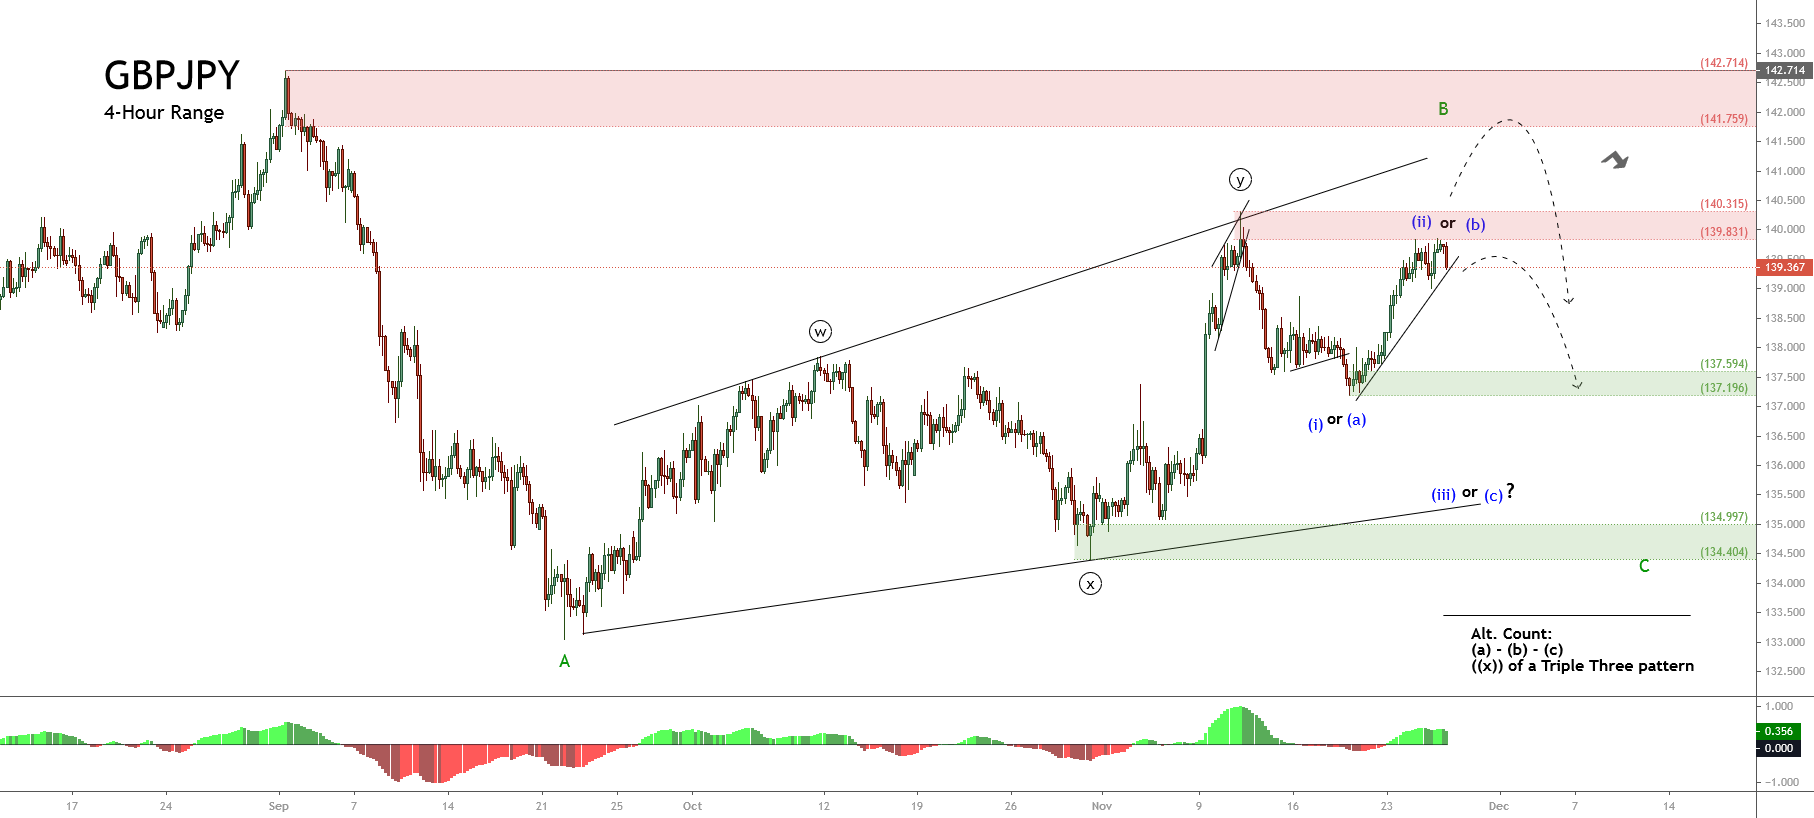
The following chart shows the price action developing an upward corrective rally, which could correspond to a wave (ii) or (b) of Minute degree identified in green. In this context, the following movement should correspond to wave (iii) or (c).

Under this scenario, if the supply zone between 139.831 and 140.315 confirms the end of the current second segment, in blue, GBPJPY should begin a decline to the first demand zone between 137.594 and 137.196. Moreover, the market action could extend its down move toward the next demand zone between 134.997 and 134.404.

An alternative scenario considers the possibility of the price extending its advance beyond the 140.315 level. In this case, the GBPJPY could find fresh sellers in the next supply zone between 141.759 and 142.714. The pair could complete its wave B in green and start to weaken, developing the wave C subdivided into a five-wave sequence with a potential target in the demand zones identified in green.

Finally, the invalidation level of the bearish scenario is set above the origin of wave A in green at 142.714

Categories
Forex Elliott Wave Forex Market Analysis

GBPJPY Consolidates in the Bearish Sentiment Zone

The GBPJPY cross continues moving by its seventh session in a row in a sideways channel turning in the neutral zone. However, since the last Thursday trading session, the price is consolidating in the bearish sentiment zone.

Technical Overview


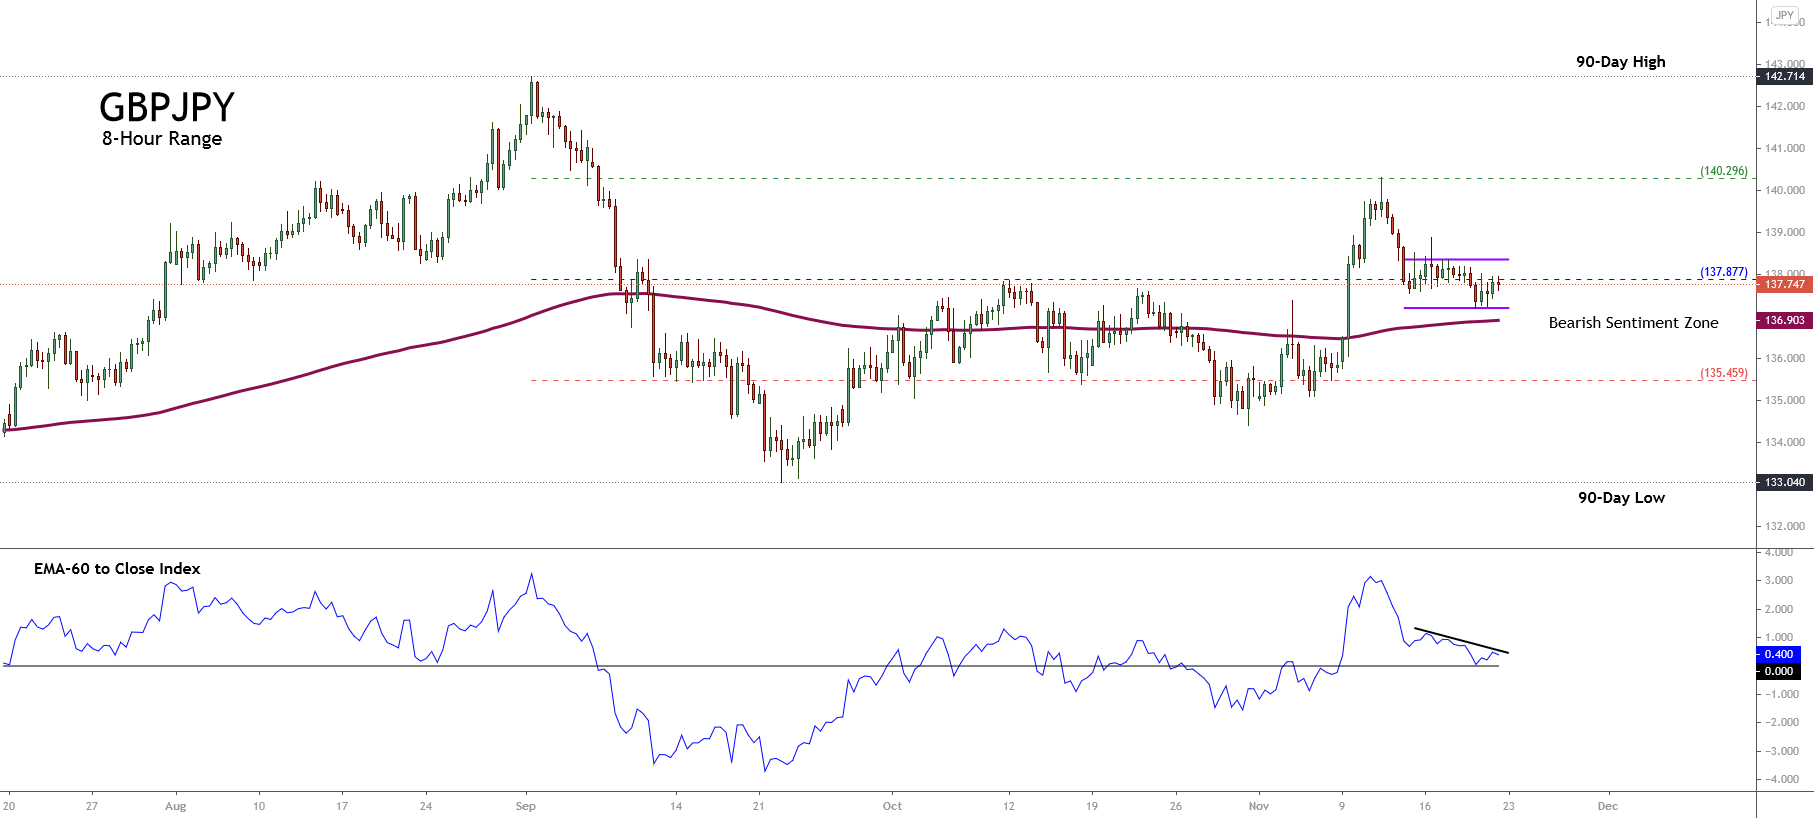
The following 8-hour chart illustrates the 90-day high and low range, which exposes the market participants’ sentiment. The figure shows the price action moving around the pivot level at 137.877. Nevertheless, the close below the pivot level pulled the price toward the bearish sentiment zone.

Additionally, the strong bearish rejection in the price action decreasing from the extreme bullish sentiment zone of 140.296 toward the pivot level leads to suspect that the intraday upward movement developed on November 09th couldn’t be as strong as it seemed.

On the other hand, both the positive EMA(60) to Price Index and the 200-period moving average moving below the price, leads to the conclusion that the mid-term sentiment remains on the bullish side. In this regard, the short-term sideways channel’s breakdown could confirm the turning bias from bullish to bearish.

Short-term Technical Outlook

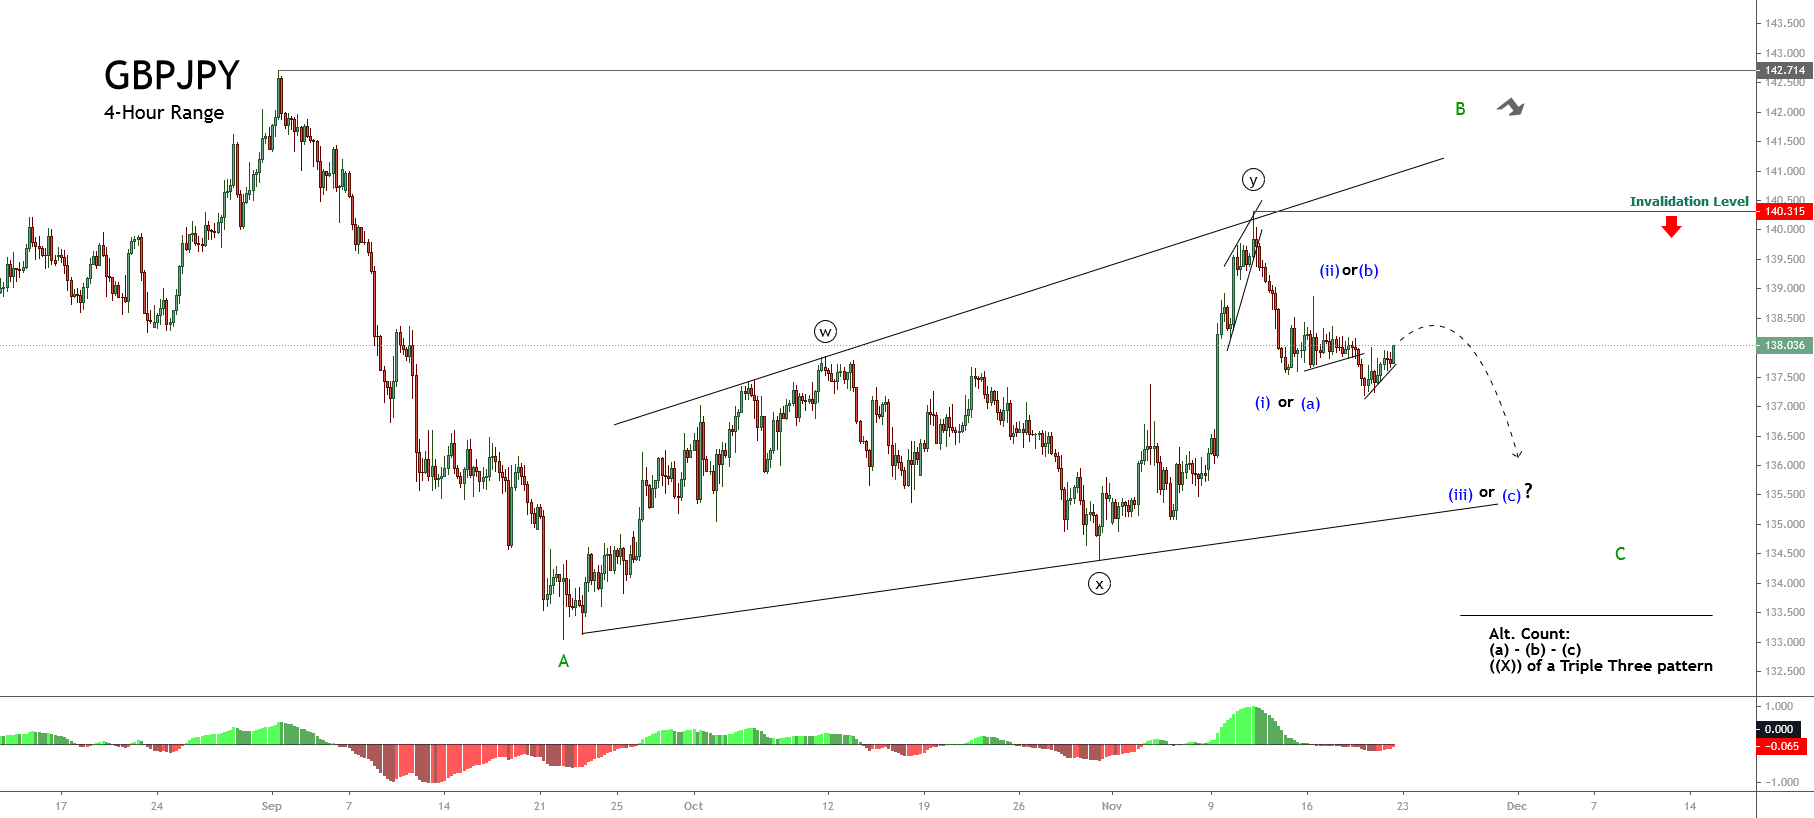
The GBPJPY cross short-term view and under the Elliott Wave perspective reveals the sideways progress in an incomplete corrective sequence that corresponds to wave B of Minor degree labeled in green.

The next 4-hour chart illustrates the advance in a broadening structural series that could correspond to a possible double-three pattern that ended once the price topped at 140.315 on November 11th.

If this scenario is correct, then the pair’s action should be advancing in wave C of Minor degree labeled in green. In this context, the GBPJPY cross should confirm the end of its internal corrective wave corresponding to wave (ii) of Minuette degree identified in blue. In this scenario, the bearish pressure could drag the price toward the end of wave A zone located between levels 133.70 and 133.

The alternative count considers the possibility that wave B of Minor degree remains incomplete and the internal structural series corresponds to a triple-three pattern. In consequence, the current downward move would correspond to the second wave ((x)) of Minute degree. If this scenario is valid, the wave (c) of Minuette degree in blue should have a limited decline, likely until the previous lows located between 135 and 134.

Finally, the invalidation level for both short-term scenarios locates at 140.315, which corresponds to the end of wave ((y)) in black.

Categories
Forex Elliott Wave Forex Market Analysis

Is GBPJPY Brewing a New Decline?

Is GBPJPY Brewing a New Decline?

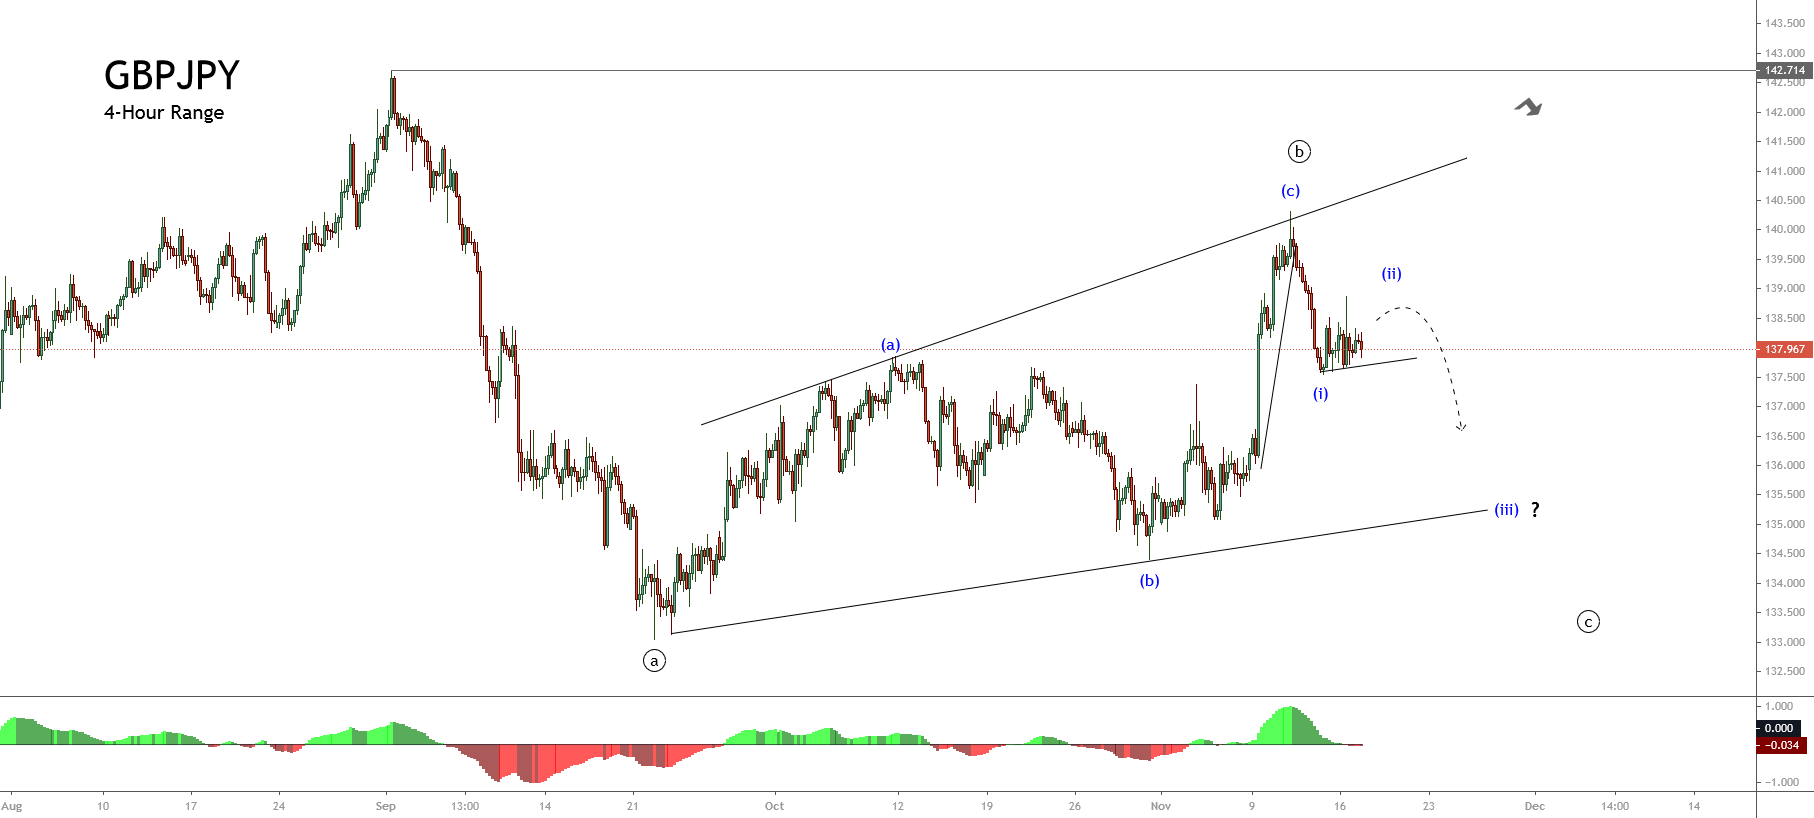
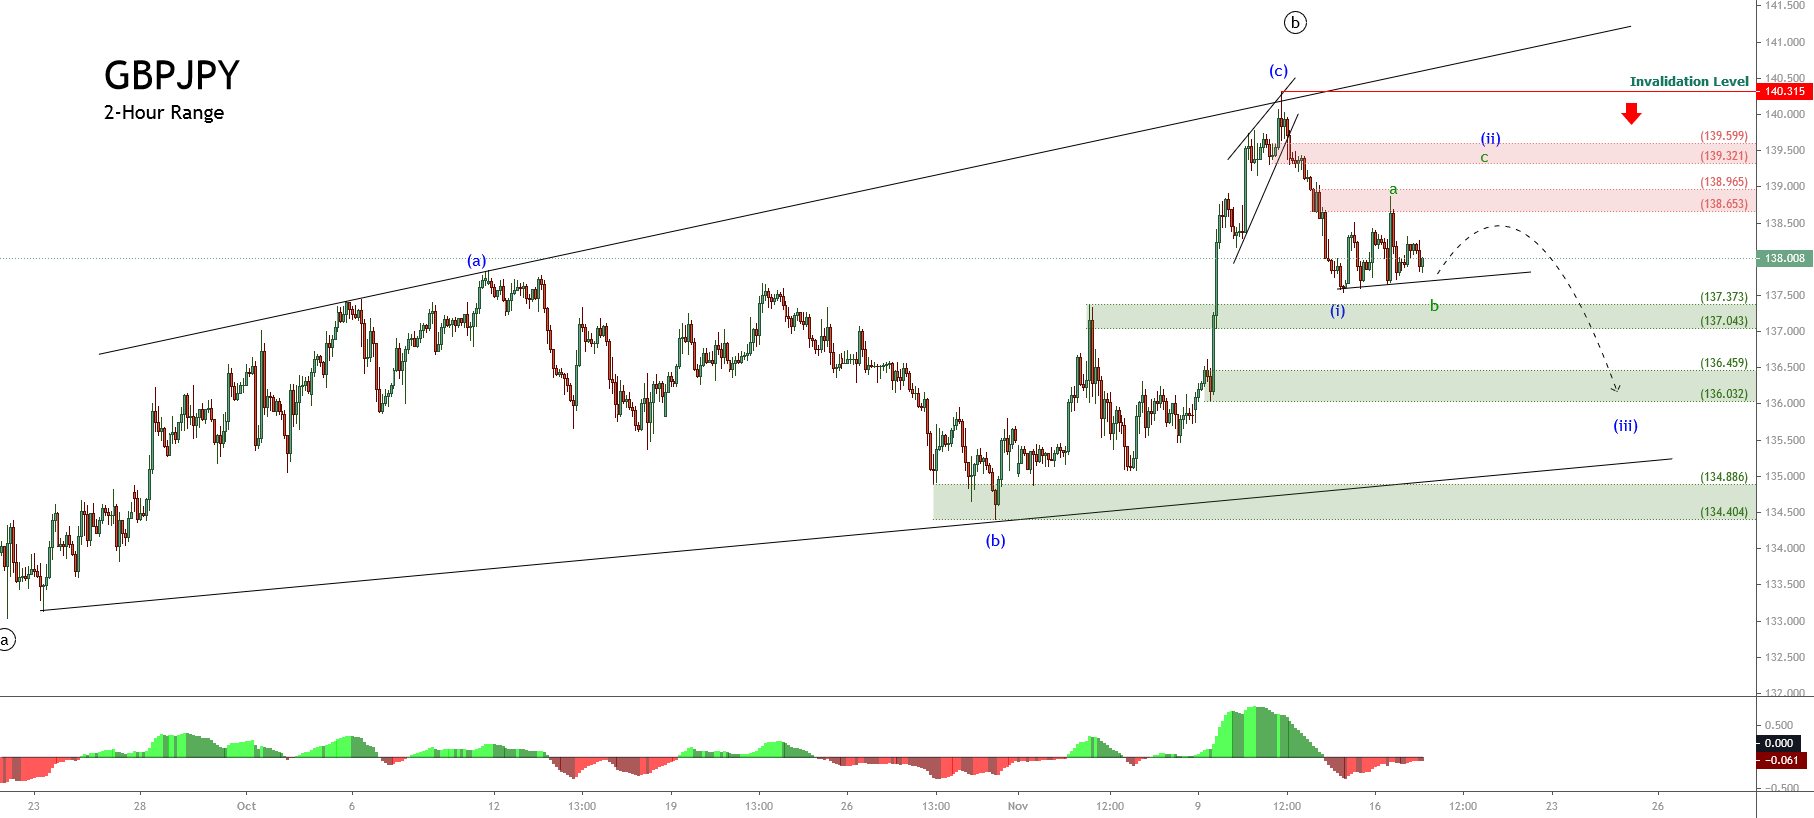
The GBPJPY cross in its 4-hour chart exposes an upward movement corresponding to an incomplete corrective structural series of Minute degree labeled in black that began at 142.714 on September 01st. In terms of the Wave Theory, the Elliott Wave formation in progress could agree with an incomplete flat pattern. This flat pattern may follow an internal sequence subdivision into 3-3-5 internal waves.

The previous figure shows a corrective rally corresponding to wave ((b)) of Minute degree labeled in black. This structural series shows the breakdown that the GBPJPY cross did after the price found resistance on 140.315. Moreover, the breakdown and consolidation below the intraday upward trendline suggest the completion of the wave ((b)) identified in black.

On the other hand, according to the Elliott Wave Theory, the next move that would correspond to wave ((c)) should follow an internal sequence subdivided into five movements of the Minuette degree labeled in blue.

The current consolidation sequence that is still in progress could correspond to wave (b) of the Minuette degree. However, while the price action doesn’t confirm the breakdown below the low of the November 13th at 137.541, wave (ii) will remain incomplete.

Finally, the wave ((c)) could extend its drops until the short-term ascending trendline that connects the end of waves ((a)) and (b).

Technical Outlook

The intraday Elliott wave view unfolded in the following 2-hour chart illustrates the sideways movement corresponding to an incomplete wave (ii) of the Minuette degree identified in blue. At the same time, the internal structure reveals the price action developing its wave b of Subminuette identified in green.

The previous chart suggests that GBPJPY could develop a limited recovery until the supply zone bounded between 138.65 and 138.965. Likewise, the price action could extend its gains until level 139.32. The cross could find fresh sellers expecting to incorporate their limited short positions with a potential profit target zone of the third wave of Minuette degree in blue locates in the demand zone between 136.45 and 136.03.

The bearish scenario’s invalidation level locates at 140.315, which corresponds to the downward sequence’s origin that remains in progress.


Categories
Forex Signals

GBP/JPY: Bearish Breakout

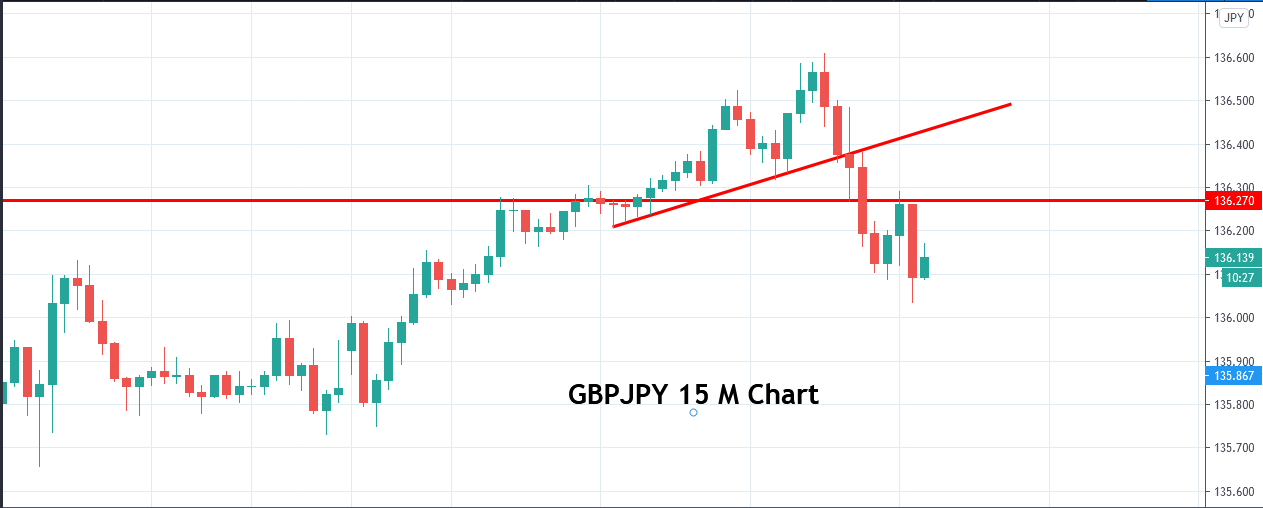
GBP/JPY made a bullish move to start its trading day today. The 15M chart shows that the price upon finding its resistance around 136.610 made a strong bearish move and made a bearish breakout at an up-trending trendline.

The chart produces two bullish corrective candles and finds its resistance around 136.270. It produces a bearish engulfing candle closing at the level where the price had a bounce after the breakout.

We triggered a short entry right after the candle closes. The 15 M chart shows that the price may find its next support around 135.797. The price may continue its bearish move if the level of 135.797 is breached.

Entry- 136.047

Stop Loss- 136.297

Take Profit– 135.797

The risk for the trade is 207 USD per standard lot, 20.7 USD for a mini lot, and 2.07 USD for a micro lot. The risk-reward is 1:1, so the reward is 207 USD per standard lot, 20.7 USD for a mini lot, and 2.07 USD for a micro lot.

Categories
Forex Signals

GBPJPY Breakout Retest Buy

Flow Assessment

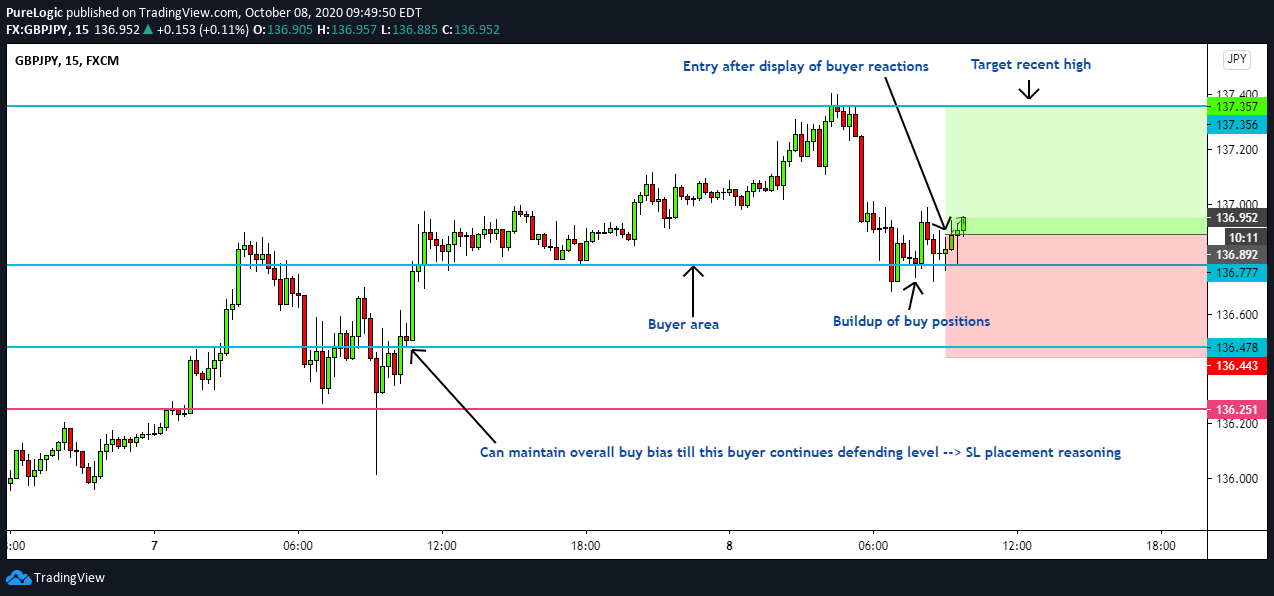
Price is in an up-flow and the seller momentum has slowed down.

Location Assessment

Price is at a key buyer area, which is showing reactions.

Momentum Assessment

Price has held near the buyers area and making smaller higher lows, suggesting buildup of positions.

Entry Price – Buy 136.892

Stop Loss – 136.443

Take Profit – 137.357

Risk to Reward – 1:1.04

Profit & Loss Per Standard Lot = -$425/ +$440

Profit & Loss Per Micro Lot = -$42.5/ +$44

Fellas, now you can check out forex trading signals via Forex Academy mobile app. Follow the links below.

iPhone Users: https://apps.apple.com/es/app/fasignals/id1521281368

Andriod Users: https://play.google.com/store/apps/details?id=academy.forex.thesignal&hl=en_US

Categories
Forex Signals

GBPJPY Moves Below an Ascending Wedge

Description

The GBPJPY cross in its hourly chart exposes the price action moving below an ascending wedge that found resistance in the zone of level 139 from where the cross started to retrace.

In this context, the pierce and close below the level 138.3 could represent a short-term resistance from where the price could confirm potential bearish incorporations. On the other hand, the RSI oscillator moves below level 40, which leads us to confirm the intraday bearish bias.

We expect a limited recovery toward the zone of 138.25 from where the price could find fresh sellers, which could drag the cross until the level 136.6, which corresponds to last July 23rd high.

Finally, the invalidation level of our bearish scenario locates at 138.83.

Chart

Trading Plan Summary

Check out the latest trading signals on the Forex Academy App for your mobile phone from the Android and iOS App Store.

Categories
Forex Signals

GBPJPY Expects Further Upsides

Description

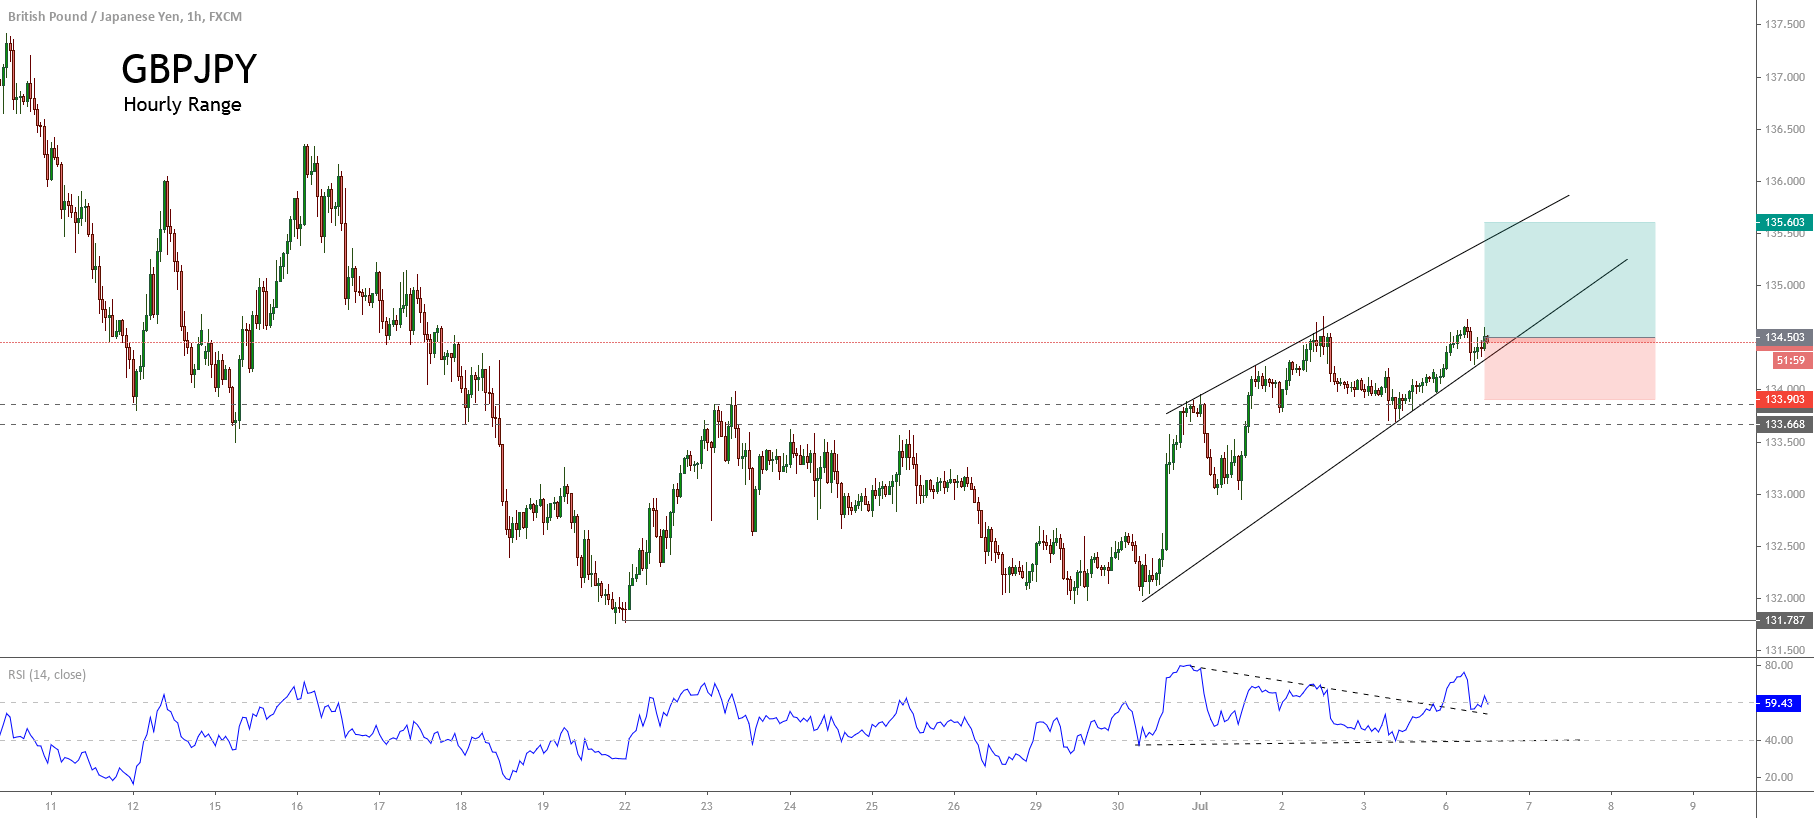
The GBPJPY cross in its hourly chart exposes a short-term upward sequence, which started on June 22nd when the price found fresh buyers at 131.78.

The price actions show a structural series that exposes a higher high and lower high sequence, which leads us to expect further upsides in the coming trading sessions.

On the other hand, the hourly chart shows the breakout developed by the price action, which consolidated over a resistance range between 133.66 and 133.86. This breakout leads us to support the possibility of a short-term bullish continuation. The RSI oscillator moving above the level-60 and the price action re-testing the previous highs of early July at 134.59, reveals the possibility of more upsides.

Our bullish outlook foresees upsides until 135.60 level, which coincides with the mid-June highs zone. The invalidation level of our scenario locates at 133.90 that corresponds to the lowest level of the current trading week.

Chart

Trading Plan Summary

Categories
Forex Signals

GBPJPY Bearish Engulfing after double top at the upper edge of the descending channel

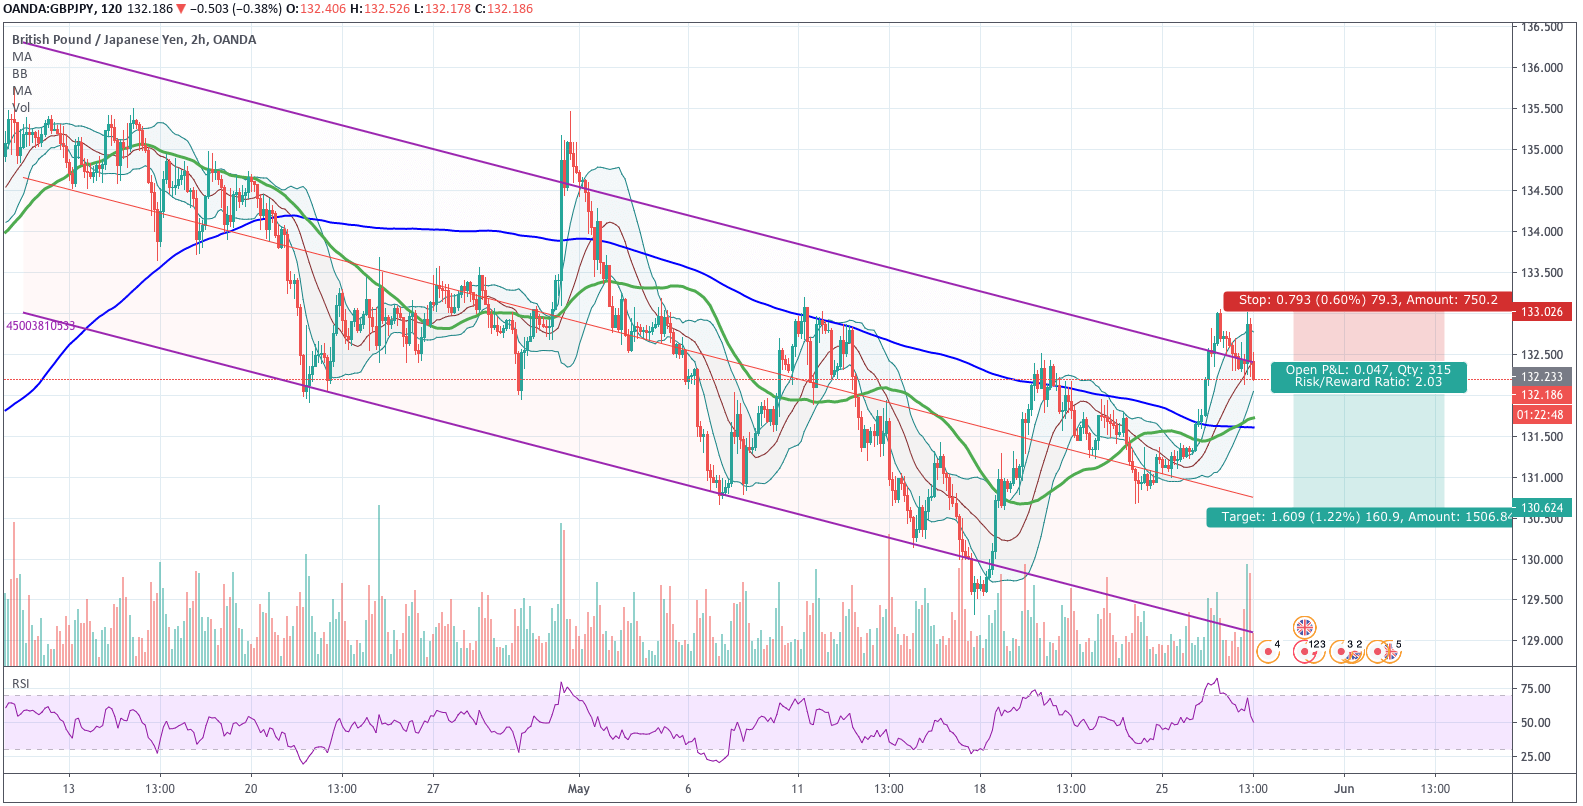
GBPJPY has been moving in a descending channel since April 10. The action created a lot of volatility, driving prices back and forth from top to bottom of the channel. The last iteration drove its price to surpass the upper limit, a +2 sigma event, which means the pair was overpriced if we compare it with what we may call the fair price, which is the linear regression channel, the red mid-line.

After the double top, a large bearish engulfing candle was drawn, confirming the reversal signal; thus, we can set up a short trade with entry at the current level, an invalidation point beyond the last top and a target at the projected linear regression point. The Reward/risk ratio of 2 is a conservative value that will ensure our long-term profitability.

Key levels:

Short-Entry:132.175

Take.profit:130.575

Stop-Loss: 132.965

Reward Ratio: 2.03

Risk:735 USD per lot, 73.5 USD per mini-lot.

Reward: 1,491USD per lot, 149 USD per mini-lot.

Position sizing: 2% Risk equals 3 micro-lots for every $1,000 balance in the trading account.

Categories
Forex Signals

GBP/JPY Retracesback Upward – Let’s Place a Sell Limit! 

The GBP/JPY pair flashing green as the currency pair soared from multi-day lows below the 129.260 as the Brexit uncertainty and also BOE’s willingness to act weighed on the pair. Whereas, the slowdown in the UK’s coronavirus (COVID-19) cases helping the currency pair to erase its early-day losses. 

The GBP/JPY recovered from the earlier losses, which they added in the downfall of GBP/JPY prices, was the increased tensions between US & China after the US Commerce Department announced to cut off Huawei from overseas chips manufacturers. The department showed concerns that the Chinese government was trying to spy by building backdoors into the network infrastructure. However, China denied such accusations and said that it would respond accordingly. This increased risk-appetite from the market is also driving bullish bias for the GBP/JPY pair. 


< Technically, the GBP/JPY is heading north to trade below an immediate resistance level of 131.33. The level is important as the 50 periods EMA holds there, while the downward trendline may also extend resistance around 131.336. Conversely, the bullish crossover of 131.336 level may help drive the selling trend in the GBP/JPY pair today. Let’s place a sell limit at 131.

Entry Price: Sell Limit at 131.419

Take Profit 130.819

Stop Loss 131.919

Risk/Reward 1

Profit & Loss Per Standard Lot = -$460/ +$557.4

Profit & Loss Per Micro Lot = -$46/ +$55.7

Categories
Forex Signals

GBPJPY – Bull Traders May Be Taking Back Control

Description

The GBPJPY cross in its hourly chart shows an intraday upward reaction leaving an engulfing candle. This movement suggests the possibility of a bullish sequence, which could continue in the trading sessions ahead. 

On the other hand, the RSI oscillator exposes a bullish breakout of the descending trendline corresponding to the last decline developed by the cross.

Our bullish scenario considers the possibility of a retrace of price action until the area of the previous pivot candle at level 132.62. This retracement could allow the incorporation of fresh bull traders supporting the movement left by the engulfing candle.

In our conservative scenario, we expect an upside above the previous highs at level 133.76. The level that invalidates our upward setup locates at 131.67.

Chart

Trading Plan Summary

Categories
Forex Signals

GBPJPY – Bullish Continuation Setup

Description

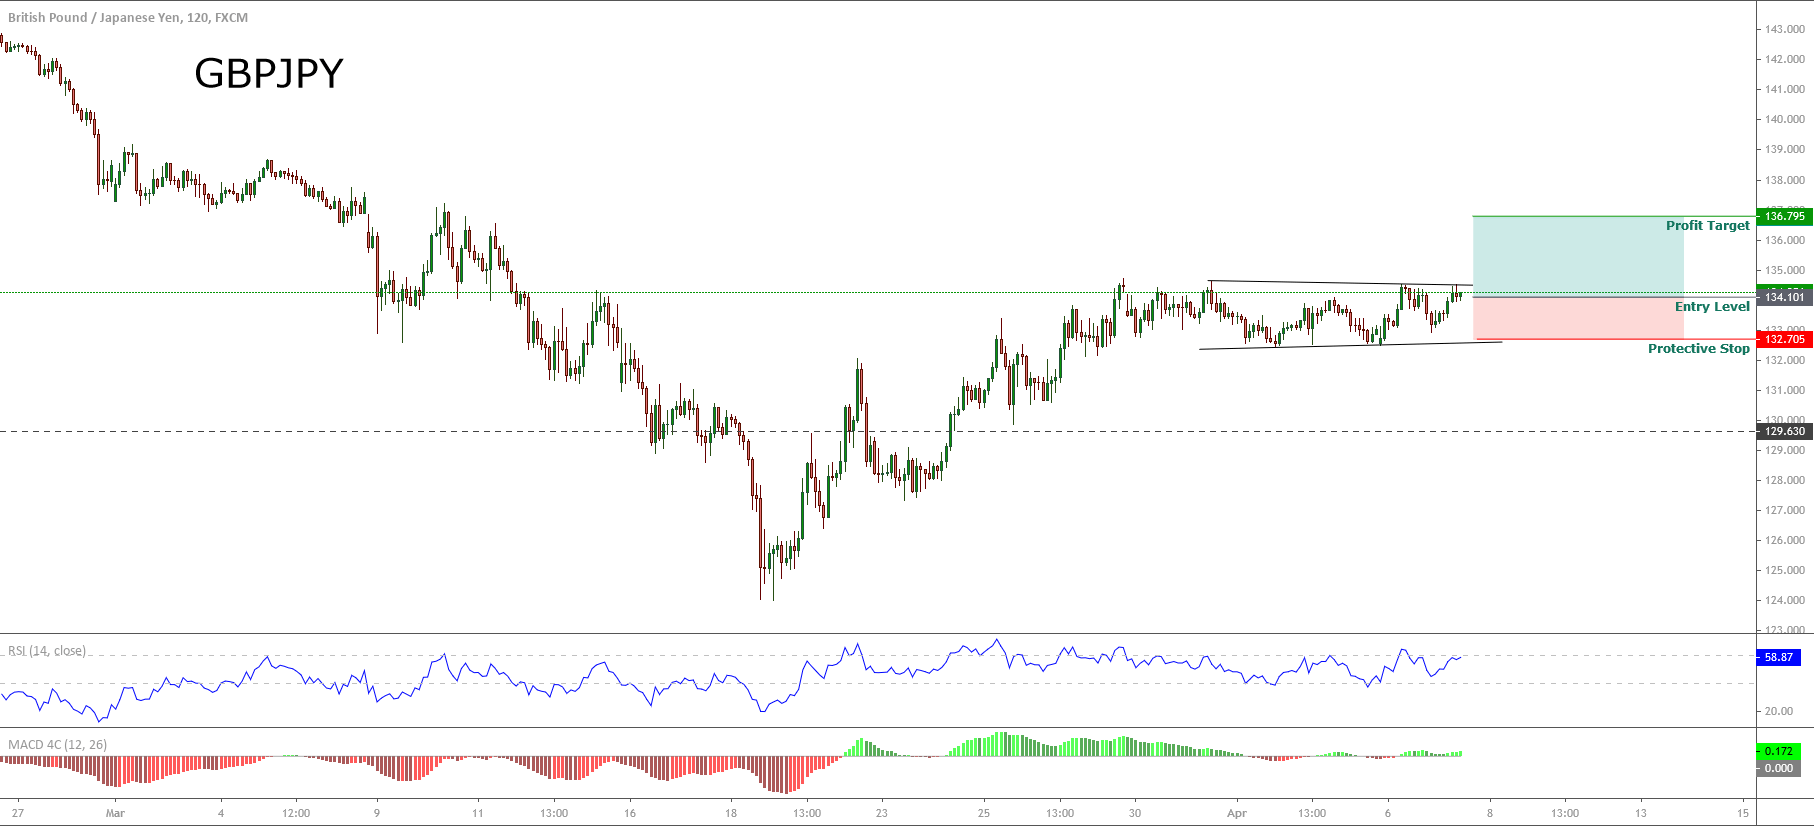
The GBPJPY cross in its 2-hour chart shows the sideways movement, which and the test of the psychological support at level-134. 

The consolidation above this level, and the absence of a reversal pattern, suggests the possibility of an upward movement which could drive the cross until 136.75 level.  

The level that invalidates our bullish scenario locates at 132.7

Chart

Trading Plan Summary

Categories
Forex Signals

GBP/JPY to Gain Support Over Upward Trendline – Buying Limit!

The Japanese cross currency pair GBP/JPY has dropped to trade at 130.300 as investors are moving towards safe-haven assets such as gold and Japanese yen. At the same time, traders seem to cash out from Sterling, causing it to tumble to its lowest level on record versus the currencies of the United Kingdom’s major trading partners.

It seems like the effects of the coronavirus pandemic proceed to shred through markets. Besides this, the British Consumer Prices Index, which is also known as inflation, surged to 1.7% in the month of February 2020. Comparing it to the previous month, the CPI figure is down by 0.1% from 1.8% in January 2020, and it has also been weighing on the GBP/JPY.


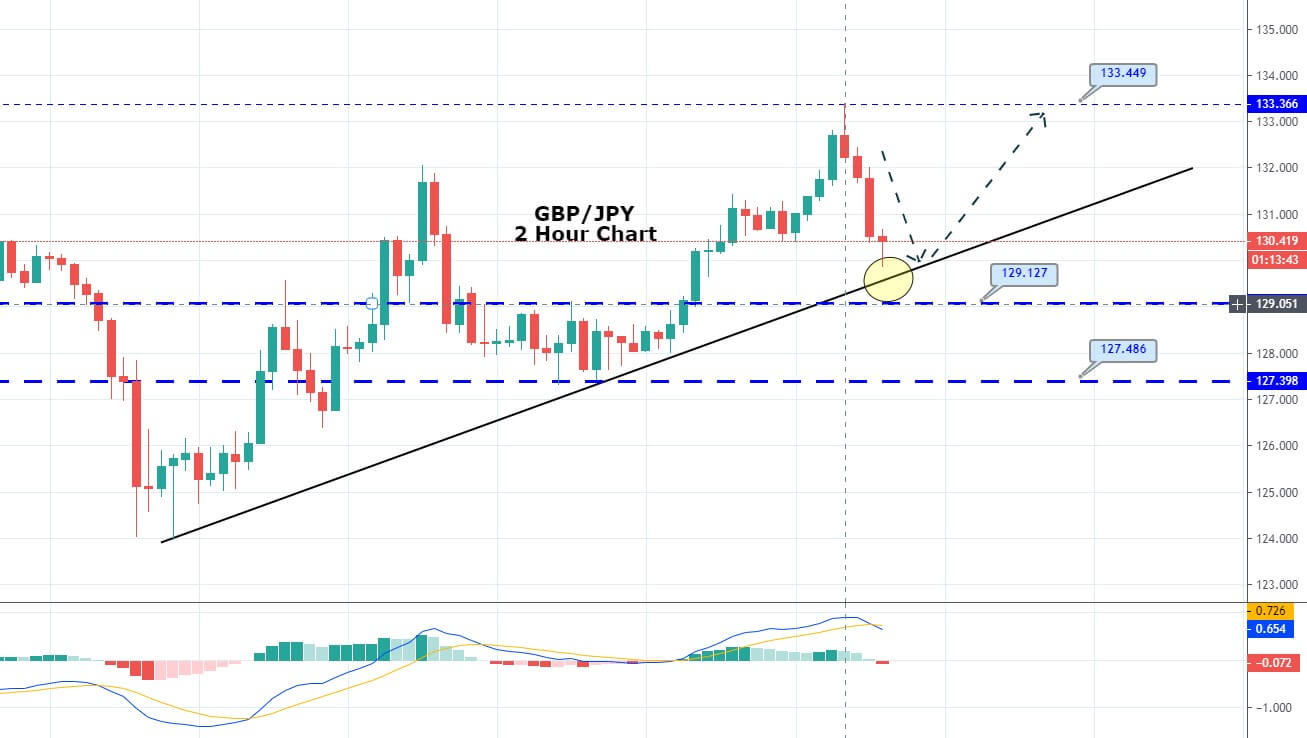
Technically speaking, the GBP/JPY is likely to test the support level of 129.650, which is extended by a bullish trendline. At the same level, the 50 periods exponential moving average is also supporting the Japanese cross.

While the resistance becomes a support level holds around 129.120. So to be more secure, we are looking to place a buy limit at 130.330 with a stop loss below 129.750 and take a profit of around 131.850.

Buy Limit 130.335

Take Profit 131.875

Stop Loss 129.735

Risk/Reward 2.57

Profit & Loss Per Standard Lot = -$530/ +$1,380

Profit & Loss Per Micro Lot = -$53/ +$138

Categories
Forex Market Analysis

European Union and Japan Sign a Trade Deal – Forex and Indices – Daily Update – 17.07.18


Fundamental Overview


European Union and Japan sign a trade deal

Financial Market Updates: Japan and the European Union signed a trade deal amid uncertainty generated by the protectionist policy led by the Trump Administration. The trade deal creates the largest open economic area. The agreement promises to eliminate 99 per cent of tariffs.


Technical Analysis


EURUSD

Today the EURUSD pair failed the bullish continuation, remaining in the consolidation range, it suggests that the pair should continue with the previous bearish cycle. In consequence, we update our bias from a bullish to a bearish move. The potential sell zone (PSZ) is between 1.1760 and 1.1807 with a bearish target placed at 1.1293. Invalidation level is 1.1852.


GBPUSD

As noticed in previous Daily Updates, the GBPUSD pair in a 2-hour chart is moving sideways, the short-term pivot level at 1.3275 has failed, in consequence, GBPUSD should make a new lower low. The Pound could fall to the area between 1.3024 and 1.2885, completing a major degree bearish cycle. Invalidation level is at 1.3472.


USDCHF

The complex corrective structure that is developing the USDCHF pair in the 2-hour chart shows a signal more for a bullish continuation than a downward reversal move. In the last session, the Swiss currency tested and bounced from the potential buy zone. We foresee USDCHF making a new higher high with the target placed in the area between 1.0112 and 1.0141. Invalidation level is at 0.9857.


EURJPY

The EURJPY cross in the 2-hour chart is moving bullish in an ascending wedge; the price tested the exhaustion zone between 132.01 and 133.05, from where we expect a bearish reversal move as a bull trap. We foresee drops to the area between 129.87 to 129.28. Consider that if the price makes a bull trap after this, it is highly likely that the price will make a bullish failure pattern.


GBPJPY

The GBPJPY cross in the 2-hour chart is making a consolidation pattern after a bullish impulsive move, which could make fresh highs to the area between 150 and 150.70. Our vision for the cross is that the price could make a limited low to the 146.2 level before it continues its previous bullish trend. Invalidation level is 143.799.


FTSE 100

As commented in previous Daily Update, FTSE 100 in the 2-hour chart continues consolidating between 7,720 pts and 7,550 pts. We maintain our bias as neutral in FTSE 100 index.


DAX 30

DAX 30 in the 2-hour chart soared above the 12,600 pts and is near to reaching the exhaustion zone at 12,695 pts. The next control level is 12,807 pts which could drive to 13,020 pts, completing an internal bullish cycle. Invalidation level of the bullish cycle is 12,104 pts.


Categories
Forex Market Analysis

Forex and Indices Daily Update 25.06.18


Fundamental Overview


Understanding the Conference Board (CB) Consumer Confidence Index (CCI).

Tomorrow, the U.S. CB Consumer Confidence Index will be released. This reflects the business conditions and likely developments for the months ahead. The report is issued monthly and is a barometer of the health of the U.S. economy from the perspective of the consumer.

The current CCI level reported in May is 128 pts, and the analysts’ consensus for June is a decrease to 127.6 points. The decreasing could be attributed to the protectionist policy which the Trump Administration is boosting. Despite this decline, consumer confidence keeps having record highs. The highest level reached in the year is 130 pts, the record high since December 2000.

CCI level -forex daily chart trading strategy

Forex Daily Chart Trading Strategy


Technical Analysis


FOREX DAILY CHART TRADING STRATEGY

EURUSD

Since June 22nd, the EURUSD has made an impulsive move reaching the short-term target area between 1.17043 and 1.17617. Our vision is that the common currency could strike the 1.1853 level before it starts a brief retracement to the area between 1.1679 and 1.15892, from there, the price should make a new rally with a target placed at 1.19467. Invalidation level is at 1.1508.


GBPUSD

GBPUSD bounced on June 21st aided by the Bank of England monetary policy decision. Now the price is consolidating the previous impulsive move. We should see a limited fall in three waves to the area between 1.3237 and 1.3165, from where we foresee fresh highs with the target at 1.3443. Invalidation level is at 1.31020.


USDCHF

The USDCHF pair is testing the long-term ascending trendline. Our forecast for USDCHF is that it could make a flag pattern reaching the 0.99277 level before we see the continuation of the previous move with a target placed on the area between 0.97225 and 0.96495. Invalidation level of this scenario is at 0.99909.


EURJPY

The EURJPY cross is moving in a corrective structure as an A-B-C Pattern, which could make a new lower low. RSI Oscillator is running supported by an ascending trendline refecting the corrective structure of the principal trend. We foresee a new bearish move to 124.94 and 126.62; this area converges with the ascending long-term trendline from where EURJPY could start a new rally. Invalidation level of the bearish cycle is 130.347.


GBPJPY

The GBPJPY cross is building a consolidation pattern as a flag pattern, which could make fresh highs to the area between 149.34 and 150.70. Our vision for the cross is that the price could reach the bearish mid-term trendline before it collapses to the lower line of the ascending channel completing a bearish flag pattern of major degree. The next key support is 143.209, invalidation level of the main bearish cycle is at 152.775.


FTSE 100

The FTSE 100 index started the week by falling for the sixth consecutive week. In this session the British index broke down the key support at 7,548, the low reached on June 18th. As we forecasted, FTSE continues their selloff approaching the Potential Reversal Zone in the 7,400 area, from where FTSE could build a new bullish connector. If the index breaks down, the Control Level is likely, that reaches from 7,182 level to 7,073 area. Invalidation level of the bearish scenario is 7,793.5.


DAX 30

DAX  30 is moving bearish in the same way that FTSE 100 is developing a Dead Cat Bounce Pattern. Today, the German index has fallen to the Potential Reversal Zone forecasted, from now we are cautious because the index could start to bounce. The price action, and RSI Oscillator and Awesome Oscillator do not show divergences or reversal signals. To summarise, the short-term bias is bearish. Invalidation level of the bearish cycle is at 13,170 pts.


Categories
Forex Market Analysis

Forex and Indices – Daily Update – Two Summits One Weekend


Forex Fundamental Analysis Signals


In this session, markets are moving expectant at the G7 summit news, mainly due to the tone between President Trump and the rest of the leaders of the seven wealthiest economies of the world. The expectation occurs in the context of the tariffs imposed by the Trump Administration as part of the “America First” agenda to the steel and aluminium imports from Canada, European Union, and Mexico. The United States and European Union have established a dialogue for this Friday, said a French official. President Macron is confident in the advancement of trade issues that have split the United States and its trade allies.

Another summit that markets are following is the meeting of the Shanghai Co operation Organization (SCO). The meeting will begin this Saturday and will include with China, Russia, India, Pakistan and other four nations from Central Asia.  The importance of this meeting lies in the fact that while G7 leaders are discussing the new protectionism, the Chinese President Xi Jinping and the Indian Prime Minister Narendra Modi will talk about an “open and inclusive world economy.”


Technical Analysis


DAX 30

The DAX 30 opened the session with a bearish gap. Still, the index is in a corrective structure. This is normal after the rally that started developing on March 26th when DAX found support at 11,726.6 up to May 22nd when it reached the 13,204.3 points. Our vision for DAX is that price could make a new lower low at 12,528.9 pts.


FTSE 100

The FTSE 100 maintained the same consolidation structure from the past week. In the same way as the DAX 30, the FTSE is consolidating after the rally showed since March 26th when it touched the 6,866.9 level and then made an extended wave soaring to 7,903.5  in May 22nd. We foresee a new lower low at 7,468.3 points.


EURUSD

The common currency is developing a retracement from the 1.1840 level; the highest level reached in four weeks. We expect the pair will make a new higher low to the area between the levels 1.1724 to 1.1667, as an A-B-C structure. From this zone, we should see new higher highs to the 1.19 area.


GBPUSD

The pound is making a corrective move shaping an A-B-C pattern, which should dip to the area between 1.33423 and 1.32880. From this area, the pair GBPUSD should continue the bullish cycle started on May 29th, when the price touched the 1.32045 support. The mid-term target is at 1.35940. Invalidation level for this sequence is 1.32544.


USDCHF

The Swiss currency is making a bearish move from the highest level reached on May 7th, when it touched the 1.00563 level. From this area, the pair started to dip in five waves, finding support at 0.97883 on June 7th. From this level, the USDCHF pair bounced above the last corrective structure touching the 0.98877 price. If 0.97883 represents the short-term bottom, we expect a new lower move to the area between 0.98313 and 0.98092, from where the USDCHF could begin to see new higher highs.


GBPJPY

The cross is making a corrective pattern as a flag structure, if the price reaches the zone between 146.234 and 145.719, we foresee a new rally which should carry the price to new highs between 148.908 to 149.645 area.


GBPCHF

GBPCHF is building an expanding ascending triangle. Our main scenario is a new low to the area between 1.31242 and 1.30806, from this area we expect a new higher target in the zone between 1.33236 and 1.33745. Invalidation level is 1.30581.


Categories
Forex Market Analysis

Dollar Index Drops, Sterling jump to its max, Wall Street is moved up by Earnings

Hot Topics.

  • Dollar Index drops despite the increase in Retail Sales (MoM) in March.
  • Sterling strikes the highest level of the year for a second time.
  • Japanese Cabinet says the economy is “recovering moderately.”
  • Watching the Copper bullish cycle.
  • US Indexes climbs are boosted, aided by the companies earnings reports.

Dollar Index drops despite the increase in Retail Sales (MoM) in March.

The US economy continues showing strength signals about its economic growth. This time it was the retail sales report shift that advanced up 0.6% from February 2018 and 4.5% (YoY). Sales from the vehicle and parts dealers boosted 2% in March. Despite this good news, the US Dollar Index fell 0.40% touching its PRZ. While the price continues above the 88.52 level, we will consider the chance of a new bullish cycle.

The Euro, which represented more than 50% of the Dollar Index, closed the session with 0.41% gain. The pair still has almost 40 pips of space to reach its PRZ, previous to the ZEW economic sentiment data release. Meanwhile, the Index still could maintain its trading range. The invalidation level of the reversal scenario is above 1.2476.


Sterling strikes the highest level of the year for a second time.

The Pound is the best performing currency of the year with an advance of 6.24% (YTD). Not even the uncertainty driven by the Brexit negotiations or the negatives consequences of the severe weather conditions that have impacted some sectorial economic indicators have been enough to slow the Pound rally. In our last Daily Update, we saw a potential top and reversal pattern; our vision is that we could witness a 2B Pattern. In this case, we will be attentive to a breakout candle before to pulling the trigger.


Japanese Cabinet says the economy is “recovering moderately”.

The Cabinet Office of Japan described Japan’s economic growth as a “recovery at a moderate pace”. The private consumption and business investment in exports are “picking up”. Concerning the tariffs tensions between the US and China, the Cabinet economists see it as a risk factor they will observe closely. The USDJPY pair fell 0.31% to our PCS (Potential Continuation Section) as a bearish wedge pattern. If the price remains above 106.61, our vision continues to be bullish.The Pound/Yen cross is testing the second monthly resistance pivot level; however, it still could make new highs before a deeper correction. Our vision is that the cross could climb to the area between 155.8 – 157. Selling positions are considered only if the price breaks below the 152.95 level.

Watching the Copper bullish cycle.

Copper is developing a bullish cycle since January 2016. It is currently in an ascending expansive triangle pattern. In the long term, the red metal has “market debt” in the 3.44 level. In the short-term, as long as the price keeps above 2.98, the trend is bullish. If the price moves down to 3.01 – 3.03, copper could find new buyers at those levels, with their targets at around 3.20 – 3.21 and its extension in the 3.25 – 3.28 area.

US Indexes climbs are boosted, aided by the companies earnings reports.

This week,  the big companies started their quarterly earnings release. The optimistic analysts’ expectations came under the assumption that results are coming mainly from activities made before the tariffs conflict between the US and China. Dow Jones 30 closed the first trading session of the week with an advance of 0.44%. The Dow is testing the key level 24,620 and we are watching from our short-term picks. The invalidation level is below 24,090.

In the same way, Nasdaq 100 closed the session advancing 0.43%. The Technological Index is moving in an ascending triangle pattern. Mid-term, we expect that the price will hit the 7,090 level. The invalidation level for the bull market scenario is below 6,398 pts.

© Forex.Academy