Description
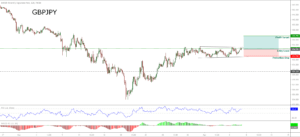
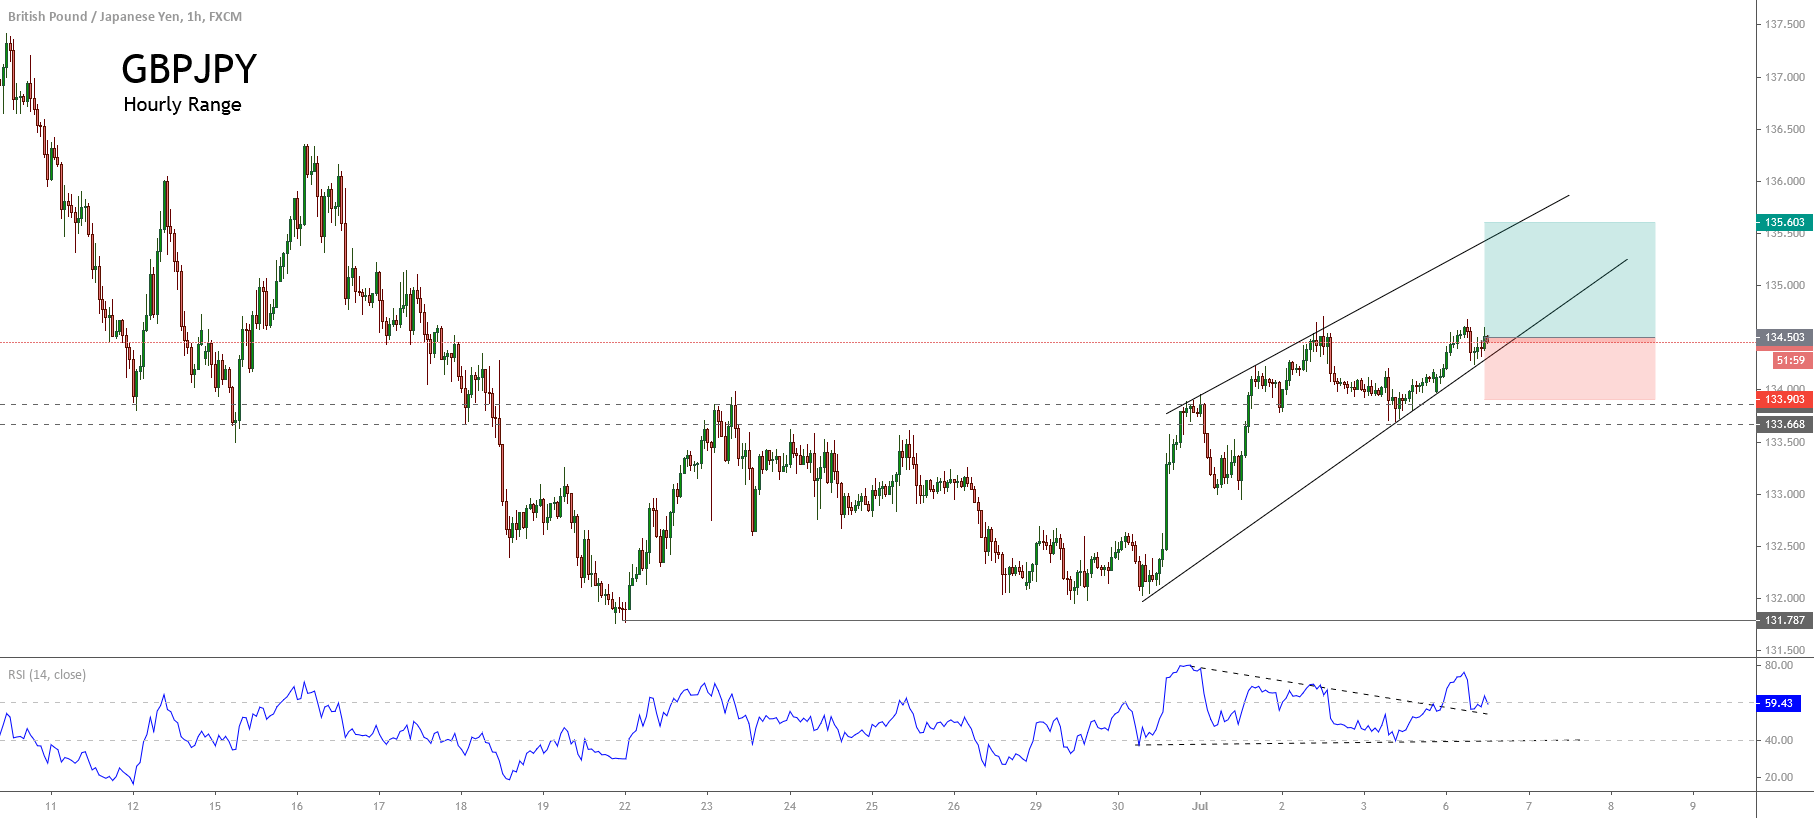
The GBPJPY cross in its hourly chart exposes a short-term upward sequence, which started on June 22nd when the price found fresh buyers at 131.78.
The price actions show a structural series that exposes a higher high and lower high sequence, which leads us to expect further upsides in the coming trading sessions.
On the other hand, the hourly chart shows the breakout developed by the price action, which consolidated over a resistance range between 133.66 and 133.86. This breakout leads us to support the possibility of a short-term bullish continuation. The RSI oscillator moving above the level-60 and the price action re-testing the previous highs of early July at 134.59, reveals the possibility of more upsides.
Our bullish outlook foresees upsides until 135.60 level, which coincides with the mid-June highs zone. The invalidation level of our scenario locates at 133.90 that corresponds to the lowest level of the current trading week.
Chart
Trading Plan Summary
- Entry Level: 134.50
- Protective Stop: 133.90.
- Profit Target: 135.60
- Risk/Reward Ratio: 1.83
- Position Size: 0.01 lot per $1,000 in trading account.

