Categories
Forex Elliott Wave Forex Market Analysis

USDJPY: Be Ready for this Flag Pattern Breakout

The USDJPY pair presents the breakout of a flag pattern corresponding to the third wave of Subminuette degree identified in green, triggered after the flag pattern breakout observed in Wednesday 26th session. Examine with us what’s next for the coming trading sessions.

Our Previous Analysis

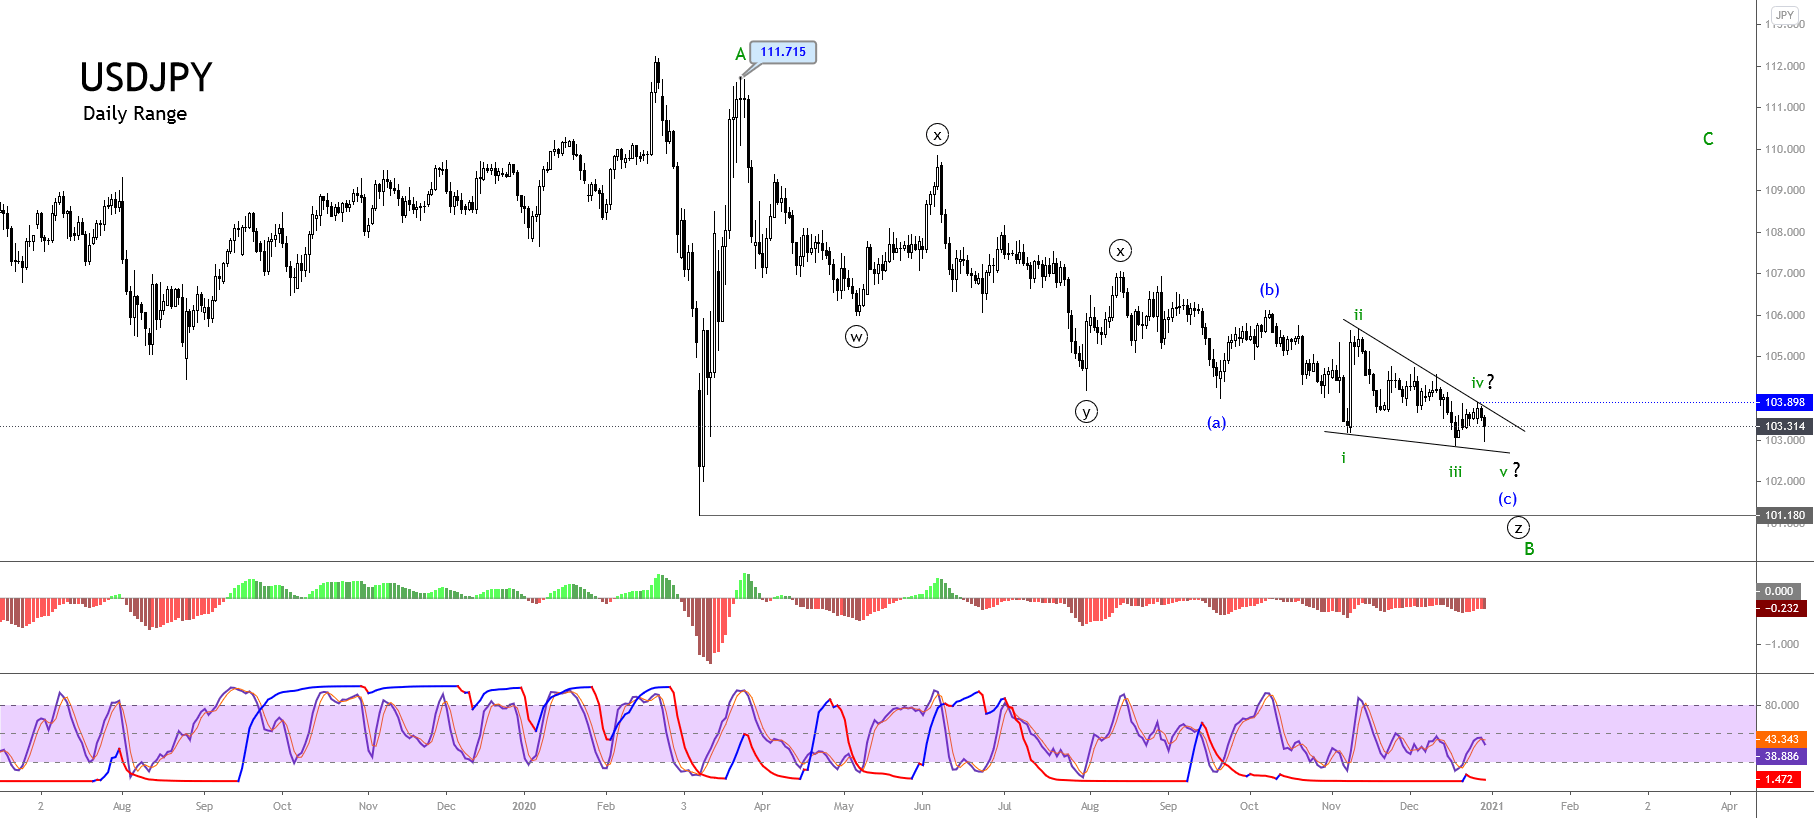
Our previous Elliott wave analysis of the USDJPY pair commented on the complex corrective formation developed by USDJPY since the price topped at 111.715 in March 2020. Also, we recognized the internal structure as an incomplete triple-three pattern. 

As illustrated in the previous daily chart released in late December 2020, the USDJPY pair moved in an incomplete wave (c) of Minuette degree labeled in blue. Likewise, the lower degree sequence revealed the progress in an ending diagonal pattern, suggesting the corrective formation’s exhaustion, which belongs to wave B of Minor degree in green.

Likewise, the breakout of the trendline that connects the end of waves ii and iv of Subminuette degree labeled in green would confirm the end of wave B of Minor degree. In this context, once the USDJPY surpassed the upper-line of the ending diagonal pattern, the pair confirmed the end of wave B and the beginning of wave C of the same degree.

What’s Next?

The USDJPY surpassing the upper guideline of the ending diagonal pattern on January 07th confirmed the completion of wave B of Minor degree and the beginning of wave C of the same degree.

In this context, the first breakout the USDJPY formed in early January corresponds to wave i in green. Likewise, the consolidation sequence recognized as a flag pattern corresponds to wave ii. Both waves belong to wave C of Minor degree labeled in green.

The last breakout developed by the USDJPY activates wave iii that belongs to wave C in green. Its potential advance could strike the psychological barrier of level 106.

Summarizing, the mid-term Elliott wave view for the USDJPY pair suggests that the price action may advance in its wave iii of Subminuette degree, which belongs to the first segment of the internal structure of wave C of Minor degree identified in green. The upward wave iii in progress could exceed the psychological barrier of 106. It even could strike the supply zone between 106.561 and 107.050. Finally, the bullish scenario’s invalidation level is at the beginning of wave i in green, at 102.591.

Categories
Forex Elliott Wave Forex Market Analysis

Why GBPJPY Plummeted in Friday’s Session?

The GBPJPY cross declined on Friday trading session dragged 0.70% after the price surpassed the psychological barrier of 142, being the highest level reached since early September 2020.

Technical Overview

The GBPJPY cross drops over 100 pips on the last trading session of the week, accumulating a modest advance of 0.02% (YTD) since the yearly opening.

On the fundamental side, the industrial production in the United Kingdom eased 4.7% (YoY) in November 2020, informed the Office for National Statistics on Friday. The reading is worse than the decline of 4.2% expected by analysts. Likewise, both coronavirus lockdown and the Brexit uncertainty contributed to the decline in the industrial output.

Source: TradingEconomics.com

On the other hand, the doubts in the fourth quarter 2020 earnings season kick-off and the elected U.S. President Biden’s stimulus plan seem not enough to keep fueling the stock market participants’ euphoric sentiment. This context looks fading the record highs in the stock market, boosting the risk-off bias pushing lower the GBPJPY cross.

The big-picture illustrated in the next daily chart shows the price action moving in the extreme bullish sentiment where the cross ended the Friday session unveiling a bearish engulfing pattern, which carries to expect further declines in the coming trading sessions.

Finally, the piercing below the yearly opening level at 140.779 suggests potential declines during the first quarter of 2021.

Technical Outlook

Our previous analysis saw the progress in a complex correction identified as a double-three pattern (3-3-3). Nevertheless, the corrective rally suggests that the GBPJPY moves in a triple-three formation (3-3-3-3-3), which looks in its terminal stage.

The following 4-hour chart shows the completion of a triple-three pattern of Minute degree labeled in black, which moves inside a wave B of Minor degree identified in green since the cross found support at 133.040 touched in last September 22nd.

The internal structure of wave ((z)) in black shows its last corrective leg corresponding to wave (c) in blue, developing an ending diagonal pattern, which seems finished its wave v of Subminuette degree labeled in green. The breakdown of the guideline that connects the end of waves ii with iv carries to support the ending diagonal pattern’s finalization.

On the other hand, the timing indicator exposes the intraday oversold (see the yellow circle), which leads to the conclusion that the GBPJPY cross should develop an upward retracement as a flag pattern before continuing with its potential further decline.

In summary, the GBPJPY cross plummeted in last Friday’s session dragged by the completion of an ending diagonal pattern, which belongs to wave ((z)) of a triple-three formation, where its upper degree sequence corresponds to wave B of Minor degree. Although the news media continue supporting hopes in the stimulus plan for the U.S. economy, the Elliott wave structure showed by the cross unveils a different story.

According to the Elliott wave theory, the price should develop a downward wave C of Minor degree. The timing oscillator also suggests an intraday upward consolidation likely as a flag pattern before continuing its drops.

If you are interested in expanding your knowledge about the Elliott wave theory from the basics to advanced, visit our Forex.Academy Educational Section.

Categories
Forex Elliott Wave Forex Market Analysis

GBPJPY Consolidates in the Bearish Sentiment Zone

The GBPJPY cross continues moving by its seventh session in a row in a sideways channel turning in the neutral zone. However, since the last Thursday trading session, the price is consolidating in the bearish sentiment zone.

Technical Overview


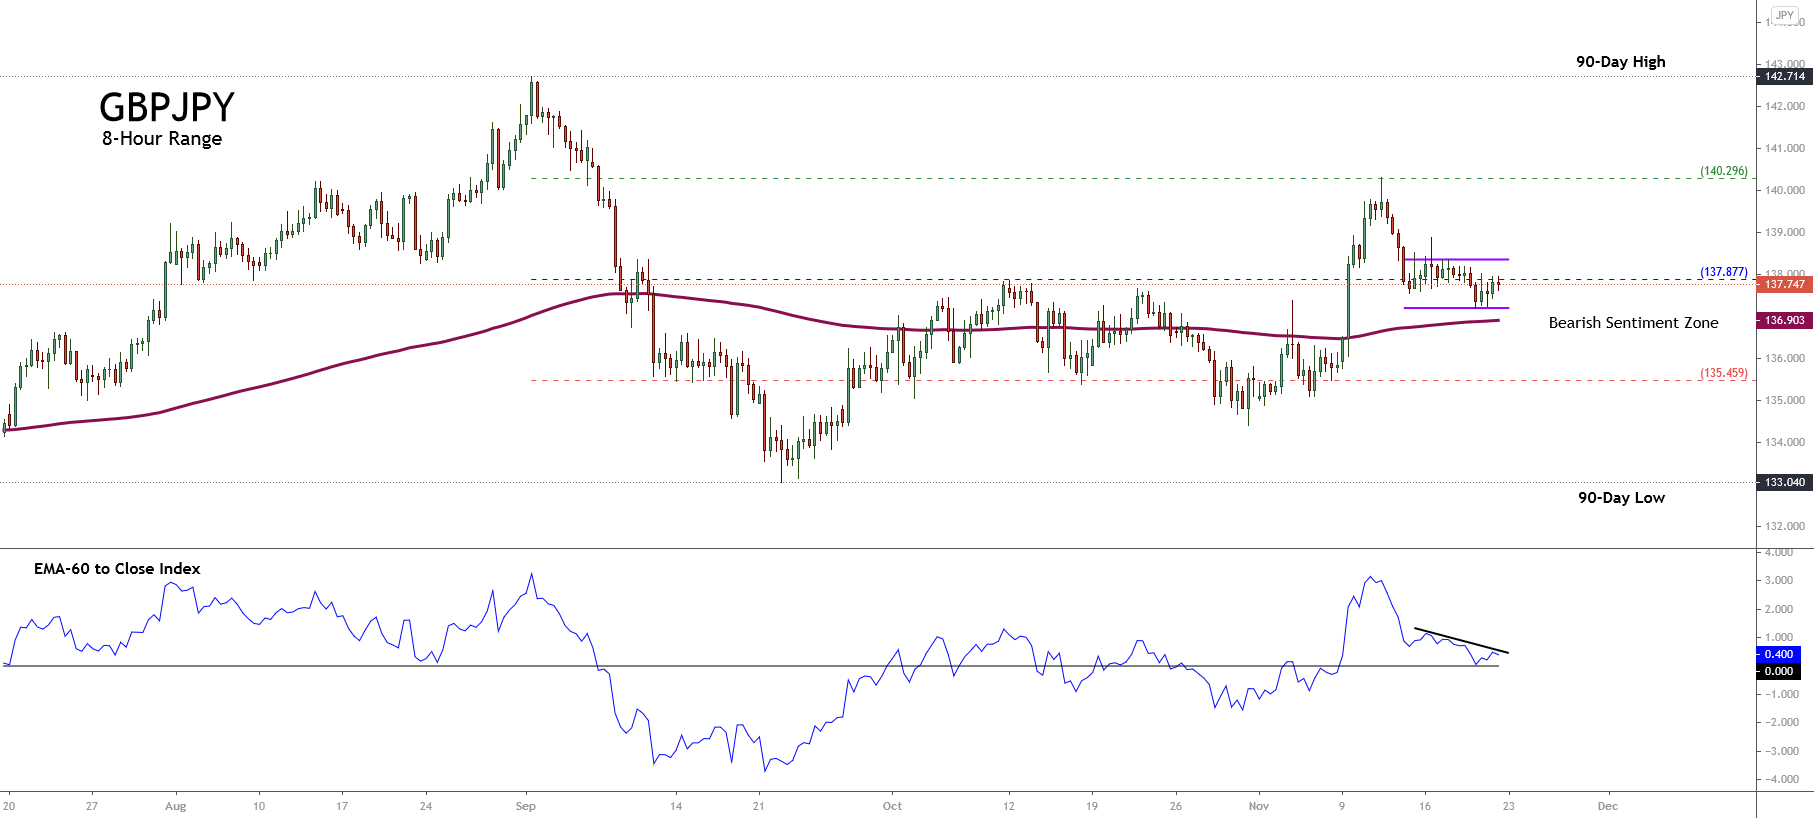
The following 8-hour chart illustrates the 90-day high and low range, which exposes the market participants’ sentiment. The figure shows the price action moving around the pivot level at 137.877. Nevertheless, the close below the pivot level pulled the price toward the bearish sentiment zone.

Additionally, the strong bearish rejection in the price action decreasing from the extreme bullish sentiment zone of 140.296 toward the pivot level leads to suspect that the intraday upward movement developed on November 09th couldn’t be as strong as it seemed.

On the other hand, both the positive EMA(60) to Price Index and the 200-period moving average moving below the price, leads to the conclusion that the mid-term sentiment remains on the bullish side. In this regard, the short-term sideways channel’s breakdown could confirm the turning bias from bullish to bearish.

Short-term Technical Outlook

The GBPJPY cross short-term view and under the Elliott Wave perspective reveals the sideways progress in an incomplete corrective sequence that corresponds to wave B of Minor degree labeled in green.

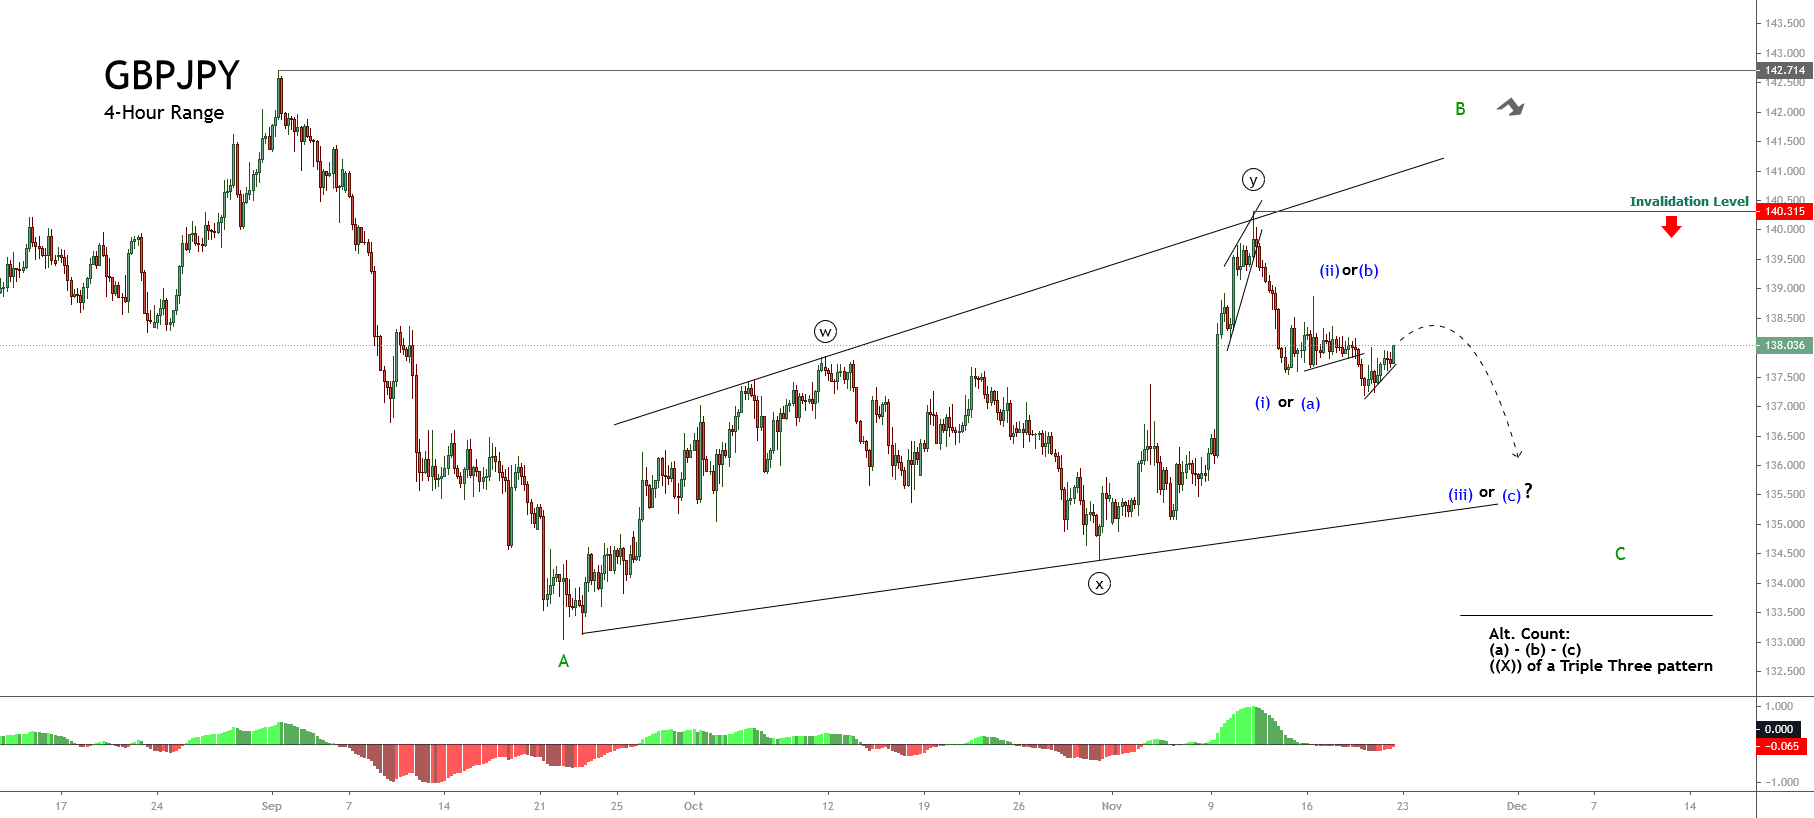
The next 4-hour chart illustrates the advance in a broadening structural series that could correspond to a possible double-three pattern that ended once the price topped at 140.315 on November 11th.

If this scenario is correct, then the pair’s action should be advancing in wave C of Minor degree labeled in green. In this context, the GBPJPY cross should confirm the end of its internal corrective wave corresponding to wave (ii) of Minuette degree identified in blue. In this scenario, the bearish pressure could drag the price toward the end of wave A zone located between levels 133.70 and 133.

The alternative count considers the possibility that wave B of Minor degree remains incomplete and the internal structural series corresponds to a triple-three pattern. In consequence, the current downward move would correspond to the second wave ((x)) of Minute degree. If this scenario is valid, the wave (c) of Minuette degree in blue should have a limited decline, likely until the previous lows located between 135 and 134.

Finally, the invalidation level for both short-term scenarios locates at 140.315, which corresponds to the end of wave ((y)) in black.