Categories
Forex Elliott Wave Forex Market Analysis

USDJPY: Be Ready for this Flag Pattern Breakout

The USDJPY pair presents the breakout of a flag pattern corresponding to the third wave of Subminuette degree identified in green, triggered after the flag pattern breakout observed in Wednesday 26th session. Examine with us what’s next for the coming trading sessions.

Our Previous Analysis

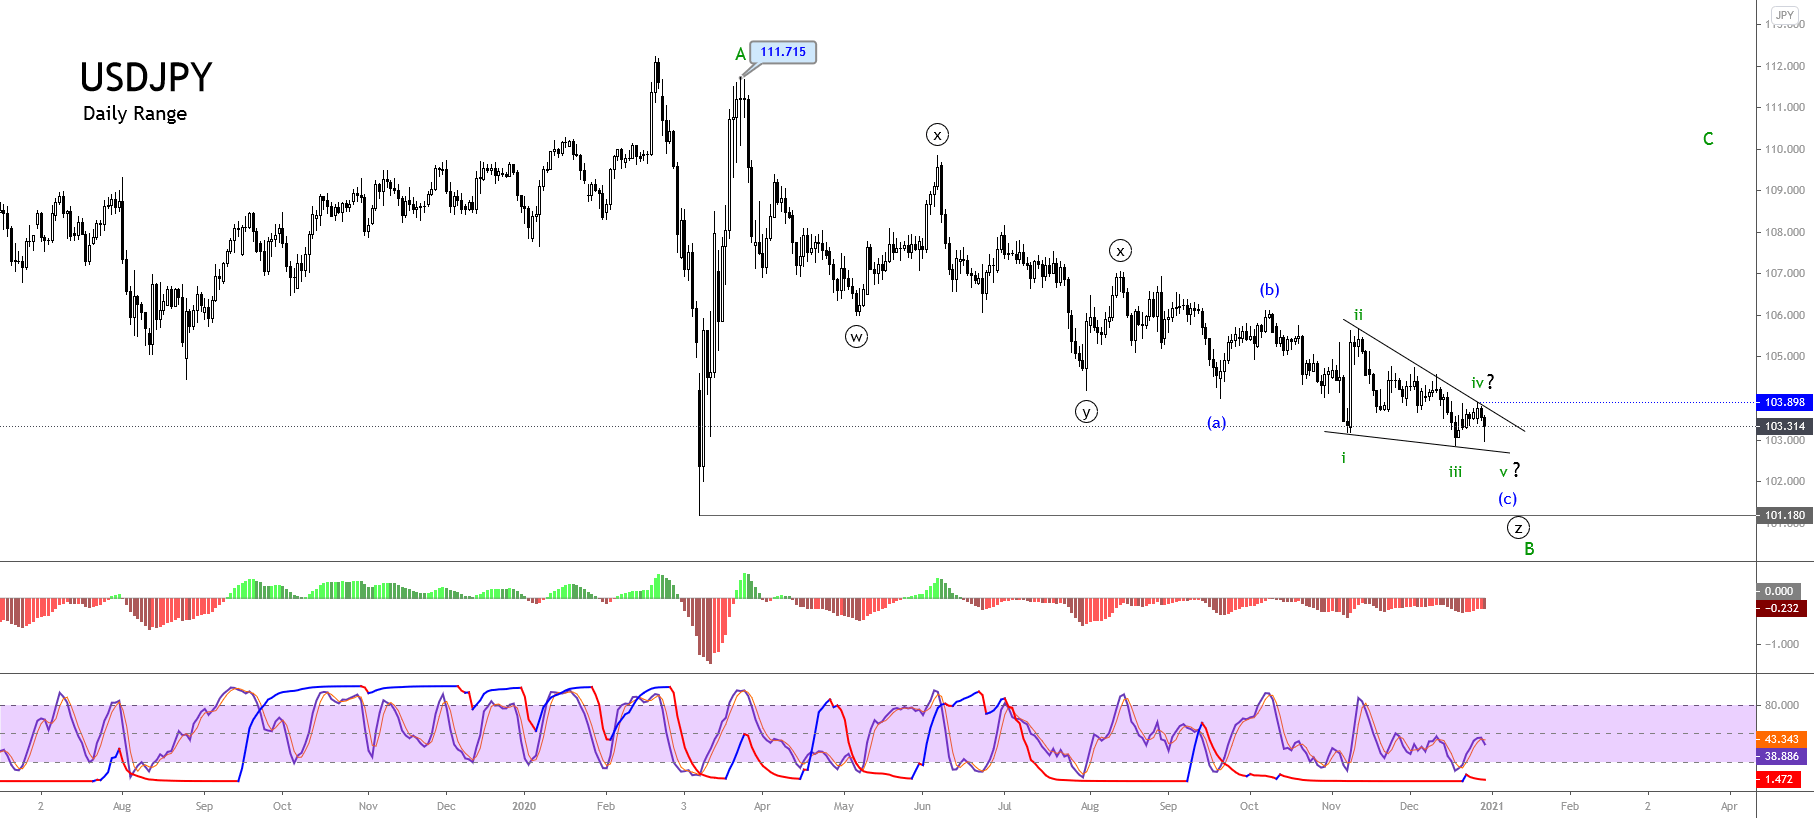
Our previous Elliott wave analysis of the USDJPY pair commented on the complex corrective formation developed by USDJPY since the price topped at 111.715 in March 2020. Also, we recognized the internal structure as an incomplete triple-three pattern. 

As illustrated in the previous daily chart released in late December 2020, the USDJPY pair moved in an incomplete wave (c) of Minuette degree labeled in blue. Likewise, the lower degree sequence revealed the progress in an ending diagonal pattern, suggesting the corrective formation’s exhaustion, which belongs to wave B of Minor degree in green.

Likewise, the breakout of the trendline that connects the end of waves ii and iv of Subminuette degree labeled in green would confirm the end of wave B of Minor degree. In this context, once the USDJPY surpassed the upper-line of the ending diagonal pattern, the pair confirmed the end of wave B and the beginning of wave C of the same degree.

What’s Next?

The USDJPY surpassing the upper guideline of the ending diagonal pattern on January 07th confirmed the completion of wave B of Minor degree and the beginning of wave C of the same degree.

In this context, the first breakout the USDJPY formed in early January corresponds to wave i in green. Likewise, the consolidation sequence recognized as a flag pattern corresponds to wave ii. Both waves belong to wave C of Minor degree labeled in green.

The last breakout developed by the USDJPY activates wave iii that belongs to wave C in green. Its potential advance could strike the psychological barrier of level 106.

Summarizing, the mid-term Elliott wave view for the USDJPY pair suggests that the price action may advance in its wave iii of Subminuette degree, which belongs to the first segment of the internal structure of wave C of Minor degree identified in green. The upward wave iii in progress could exceed the psychological barrier of 106. It even could strike the supply zone between 106.561 and 107.050. Finally, the bullish scenario’s invalidation level is at the beginning of wave i in green, at 102.591.

Categories
Forex Elliott Wave Forex Market Analysis

AUDNZD: Profiting from its Intraday Triangle Pattern

The AUDNZD cross seems to start a movement in wave 3 of Minor degree labeled in green after completing its second corrective wave of the same degree, which found its bottom at 1.04181 on December 01st.

Technical Overview

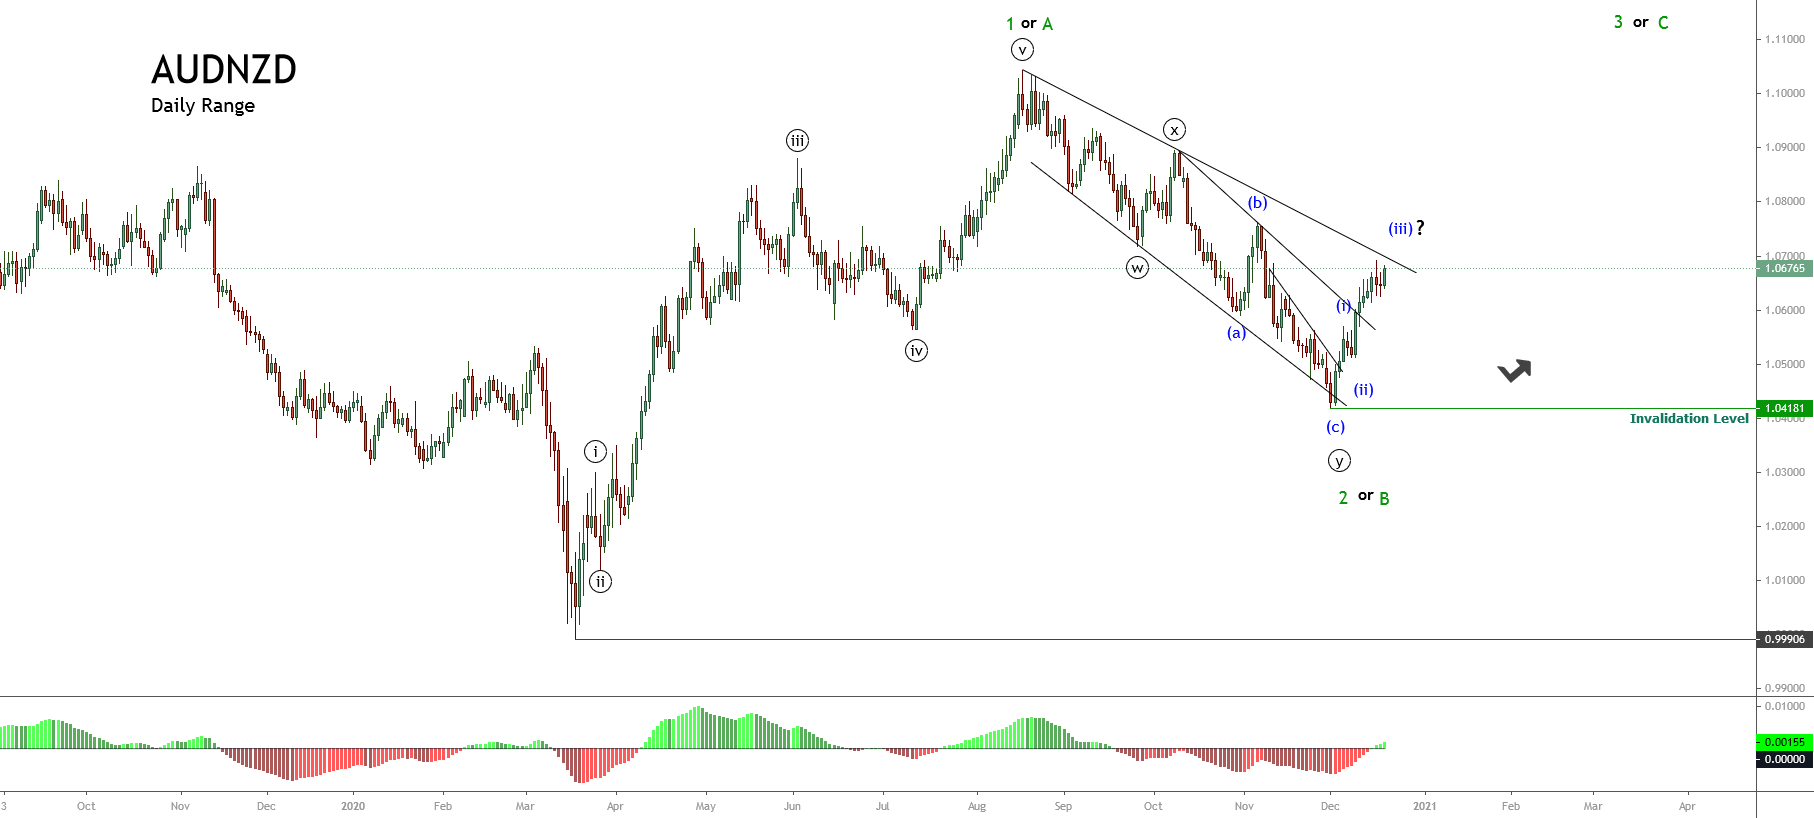
The big picture of the AUDNZD cross and under the Elliott Wave perspective and illustrated in the following daily chart reveals the bullish sequence of Minor degree that began last March 09th, when the price pierced the parity level, dropping to 0.99906.

Once the price found fresh buyers, the Oceanic cross climbed in five internal movements of Minute degree, identified in black, until 1.10438, where the cross completed its first wave in green. After this completion, AUDNZD dropped in a complex corrective formation identified as a double-three pattern, which found support at 1.04181 on December 01st. From there, it bounced up to the current levels. 

On the other hand, the breakout of the short-term descending trendline that connects the end of wave ((x)), in black, with the end of wave (b), in blue, suggests the end of the second wave of Minor degree.

Short-term Technical Outlook

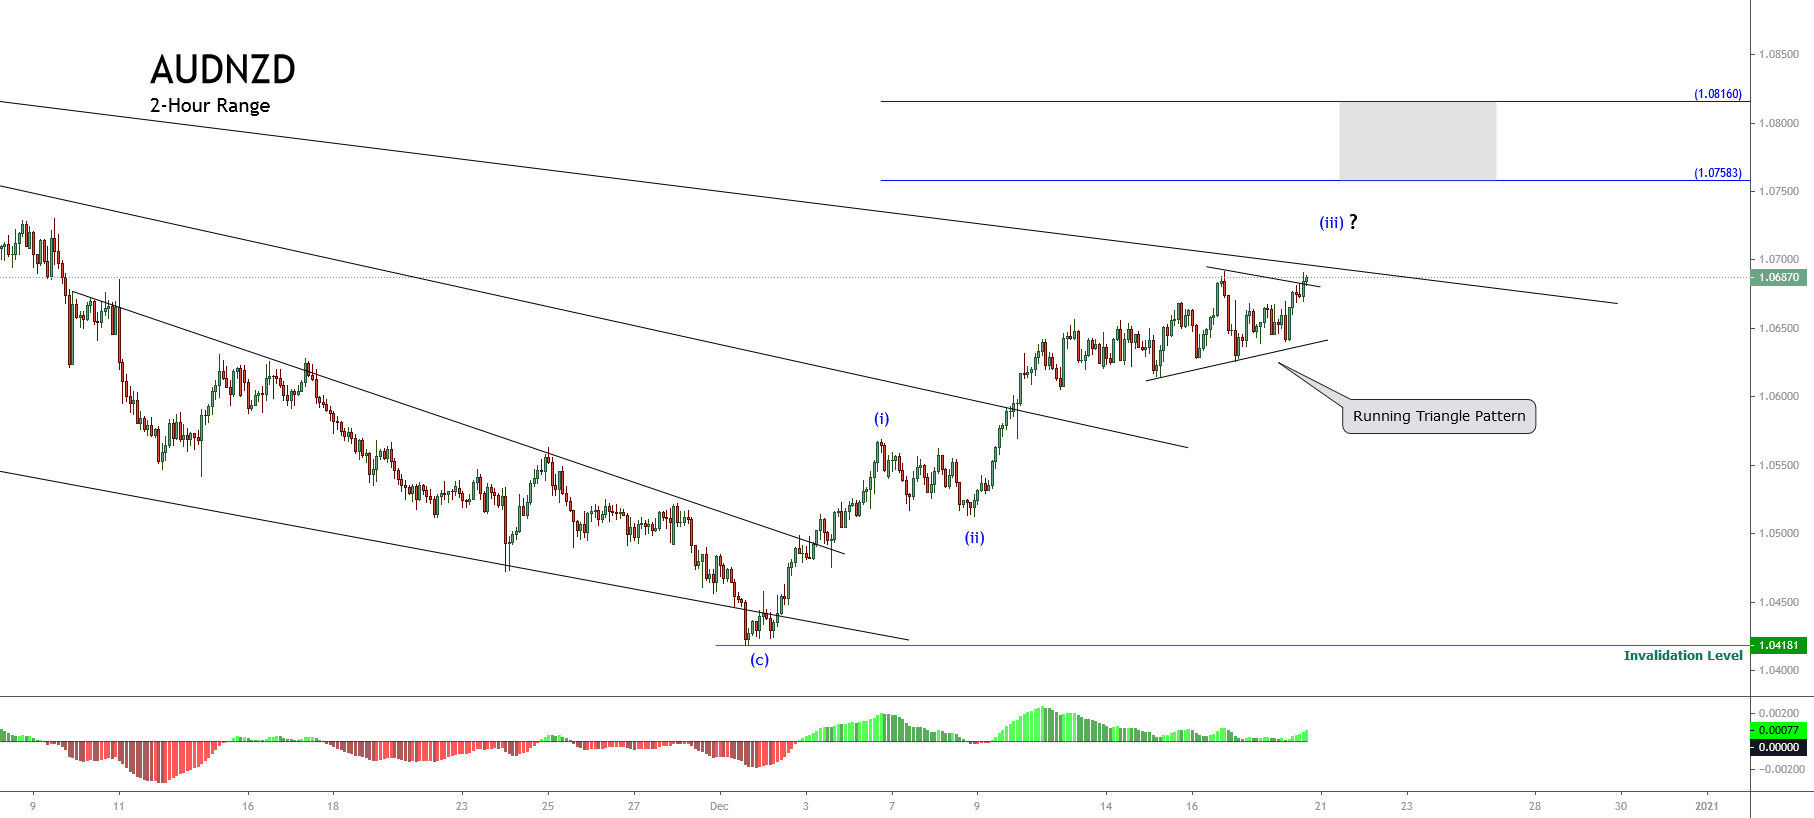
The intraday view unfolded in the next 2-hour chart shows the rally that remains in progress since December 01st when the cross found fresh buyers at 1.04181 suggesting further upsides in the following trading sessions.

The previous chart shows the wave (iii) movement of the Minuette degree labeled in blue, which currently looks consolidating its internal structure in a potential running triangle pattern. 

According to the Elliott Wave theory, practically all running triangle patterns tend to be confused with ending diagonals driving retail traders to open trades in the opposite direction to the current trend instead of considering the pattern as a continuation of the trend. Therefore under this scenario, our main bias remains on the bullish side. In this regard, this triangular pattern makes us think that the Oceanic cross might continue extending its movement until the potential target zone between 1.0758 and 1.0816, where the price could complete its third wave, in blue.

In summary, the AUDNZD cross completed its second wave of Minor degree subdivided in a descending three-wave sequence calling for a new upward movement in favor of the first rally, which should follow a five-wave sequence. In this context, the internal structure shows the progress in the third wave of an impulsive wave, which looks consolidating in a running triangle pattern. The potential target of the current rally is located between 1.0758 and 1.0816. On the other hand, the bullish scenario’s invalidation level is set at 1.04181, corresponding to the origin of the current upward sequence.