
Introduction
AUD/NZD is derived from the full-form of the currency pair, the Australian dollar, and the New Zealand dollar. It comes under the classification of cross currency pairs. In this pair, AUD is the base currency, and NZD is the quote currency.
Understanding AUD/NZD
The value of AUD/NZD depicts the value of NZD that is equivalent to AUD. It is simply quoted as 1 AUD per X NZD. For example, if the current value of this pair is 1.0405, then these many New Zealand dollars are needed to purchase one Australian dollar.
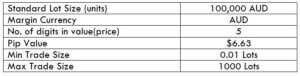
AUD/NZD Specification
Spread
Spreads are a typical way through which brokers make money. The pip difference between the bid price and the ask price is their profit margin, which is referred to as the spread. It varies from the type of account model.
ECN: 0.9 | STP: 1.8
Fees
The fee is basically the commission on a trade levied by the broker on each trade. Again, it varies from the type of account model.
Fee on STP = 0
Fee on ECN = 6 to 10 pips (starts from as low as one pip)
Slippage
The slippage is the difference between the broker’s executed price and the trader’s execution price. There is this variation as the order is executed using market execution. There are two reasons for slippage to take place.
- Broker’s execution speed
- Market’s volatility
Trading Range in AUD/NZD
Assessing the profit/risk is a great add-on to one’s trading analysis. With this, the trader can know how long he must before his trade performs. And below is the table that enables the analysis of it.
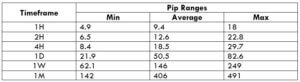
Procedure to assess Pip Ranges
- Add the ATR indicator to your chart
- Set the period to 1
- Add a 200-period SMA to this indicator
- Shrink the chart so you can assess a large time period
- Select your desired timeframe
- Measure the floor level and set this value as the min
- Measure the level of the 200-period SMA and set this as the average
- Measure the peak levels and set this as Max.
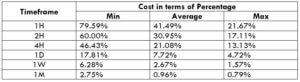
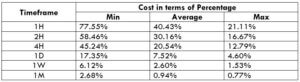
AUD/NZD Cost as a Percent of the Trading Range
This is one great application of the above table. By combining these values with the total cost of trade, one can determine variations in the costs by varying the parameters like volatility and timeframe.
ECN Model Account
Spread = 0.9 | Slippage = 2 |Trading fee = 1
Total cost = Slippage + Spread + Trading Fee = 2 + 0.9 + 1 = 3.9
STP Model Account
Spread = 1.8 | Slippage = 2 | Trading fee = 0
Total cost = Slippage + Spread + Trading Fee = 2 + 1.8 + 0 = 3.8
 The Ideal way to trade the AUD/NZD
Before getting into finding the best way to trade this pair, let us comprehend what the above table has got to say.
The higher the magnitude of the percentages, the higher is the cost on the trade for that particular volatility and timeframe. The min column represents low volatility, and the max column represents high volatility.
It can clearly be ascertained from the table that the percentages are comparatively higher on the min column and lower on the max column. This means that the costs are high when volatility is low and vice versa.
But, it is not ideal to trade in neither of the two situations mentioned below.
When the volatility is high -> because of the risk involved
When the volatility is low -> because the costs are high
Now, to maintain a balance between all the parameters, it is best to trade when the pip movement is around the average values.
Furthermore, another simple way to reduce cost is by trading using a pending/limit order instead of market orders, as it will nullify the slippage on the trade. And this, in turn, will reduce the total cost of the trade as well.