Categories
Forex Elliott Wave Forex Market Analysis

AUDNZD: Profiting from its Intraday Triangle Pattern

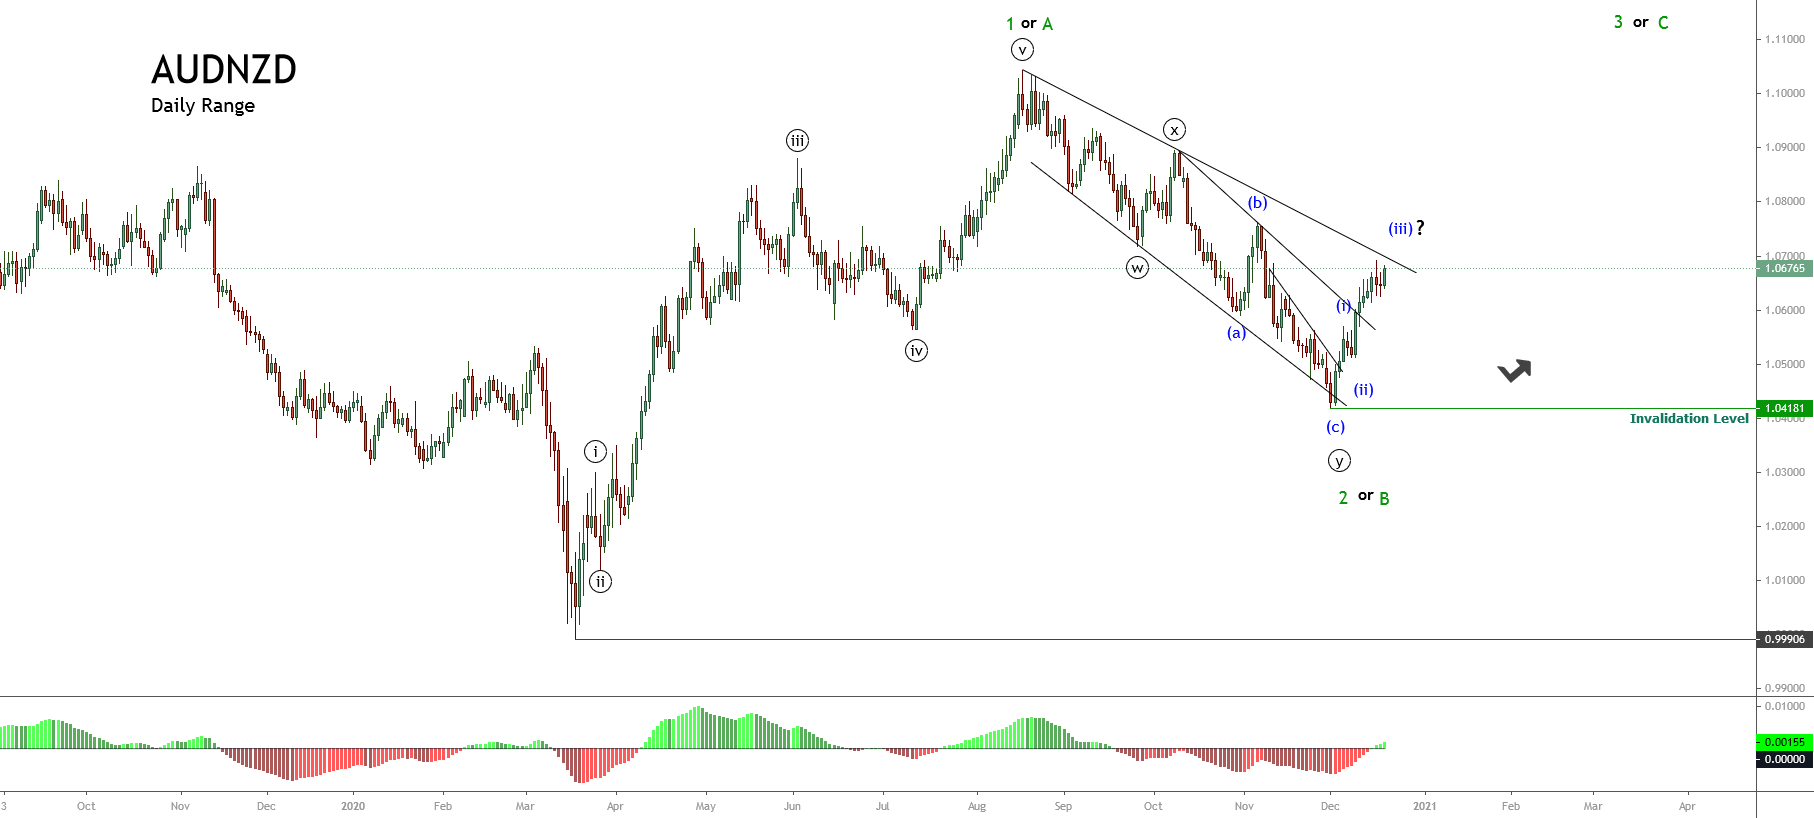
The AUDNZD cross seems to start a movement in wave 3 of Minor degree labeled in green after completing its second corrective wave of the same degree, which found its bottom at 1.04181 on December 01st.

Technical Overview

The big picture of the AUDNZD cross and under the Elliott Wave perspective and illustrated in the following daily chart reveals the bullish sequence of Minor degree that began last March 09th, when the price pierced the parity level, dropping to 0.99906.

Once the price found fresh buyers, the Oceanic cross climbed in five internal movements of Minute degree, identified in black, until 1.10438, where the cross completed its first wave in green. After this completion, AUDNZD dropped in a complex corrective formation identified as a double-three pattern, which found support at 1.04181 on December 01st. From there, it bounced up to the current levels. 

On the other hand, the breakout of the short-term descending trendline that connects the end of wave ((x)), in black, with the end of wave (b), in blue, suggests the end of the second wave of Minor degree.

Short-term Technical Outlook

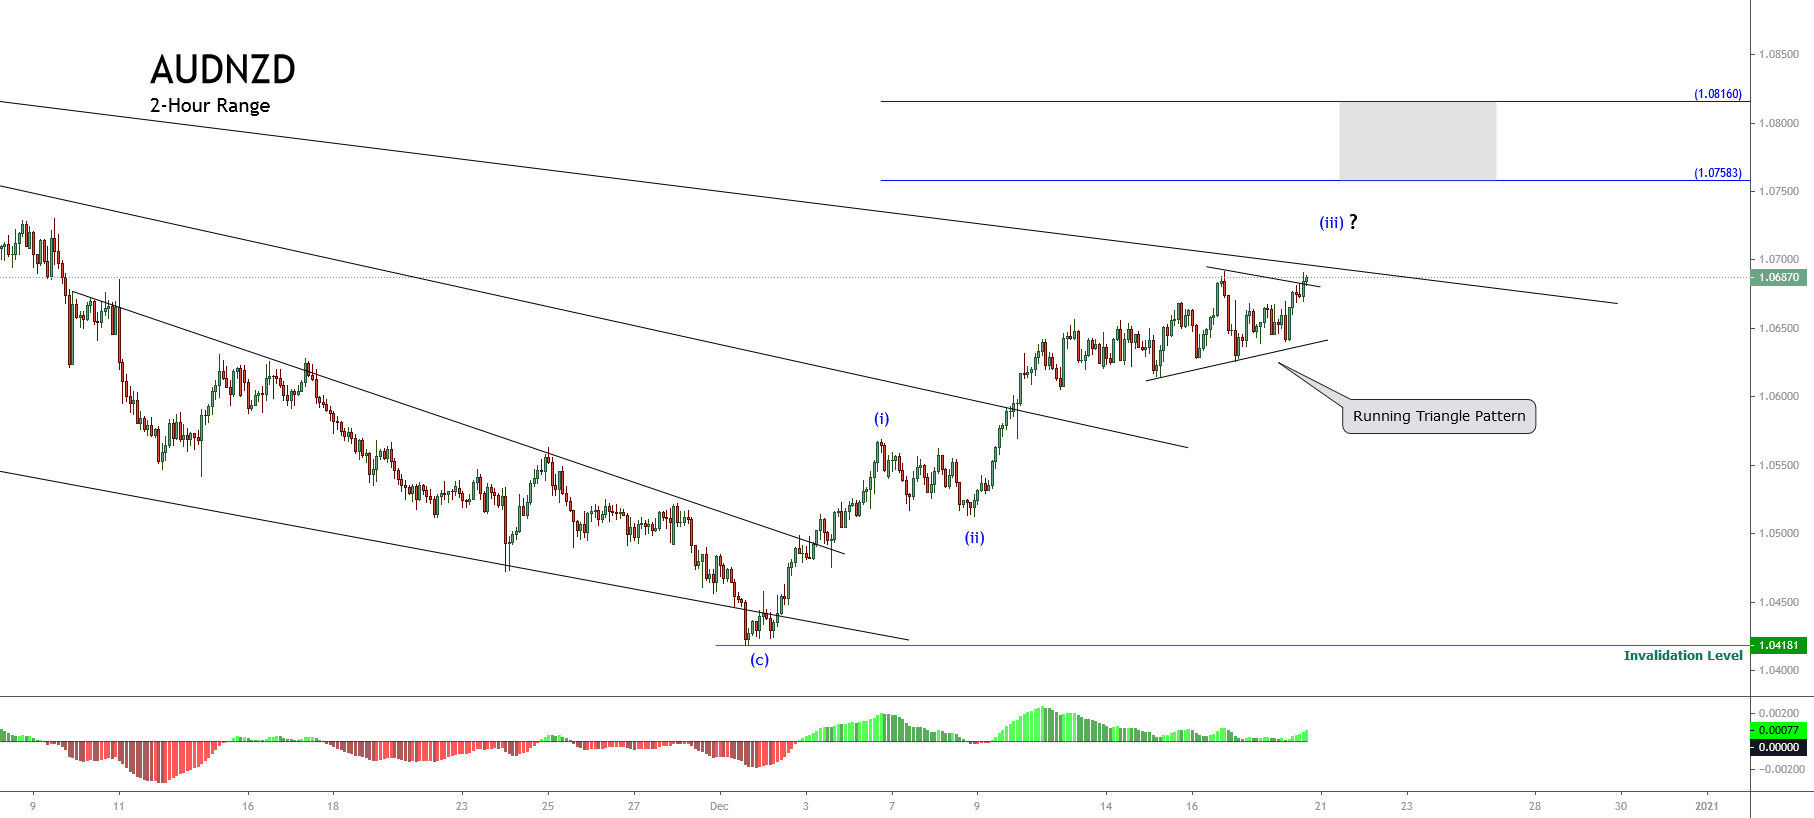
The intraday view unfolded in the next 2-hour chart shows the rally that remains in progress since December 01st when the cross found fresh buyers at 1.04181 suggesting further upsides in the following trading sessions.

The previous chart shows the wave (iii) movement of the Minuette degree labeled in blue, which currently looks consolidating its internal structure in a potential running triangle pattern. 

According to the Elliott Wave theory, practically all running triangle patterns tend to be confused with ending diagonals driving retail traders to open trades in the opposite direction to the current trend instead of considering the pattern as a continuation of the trend. Therefore under this scenario, our main bias remains on the bullish side. In this regard, this triangular pattern makes us think that the Oceanic cross might continue extending its movement until the potential target zone between 1.0758 and 1.0816, where the price could complete its third wave, in blue.

In summary, the AUDNZD cross completed its second wave of Minor degree subdivided in a descending three-wave sequence calling for a new upward movement in favor of the first rally, which should follow a five-wave sequence. In this context, the internal structure shows the progress in the third wave of an impulsive wave, which looks consolidating in a running triangle pattern. The potential target of the current rally is located between 1.0758 and 1.0816. On the other hand, the bullish scenario’s invalidation level is set at 1.04181, corresponding to the origin of the current upward sequence.

Categories
Forex Elliott Wave Forex Market Analysis Forex Technical Analysis

AUDNZD: Potential Bounce among Overall Weakness

This analysis discusses AUDUSD’s overall Elliott Structure, the likelihood of a short bounce in the AUDUSD, and its potential continuation.

Technical Overview

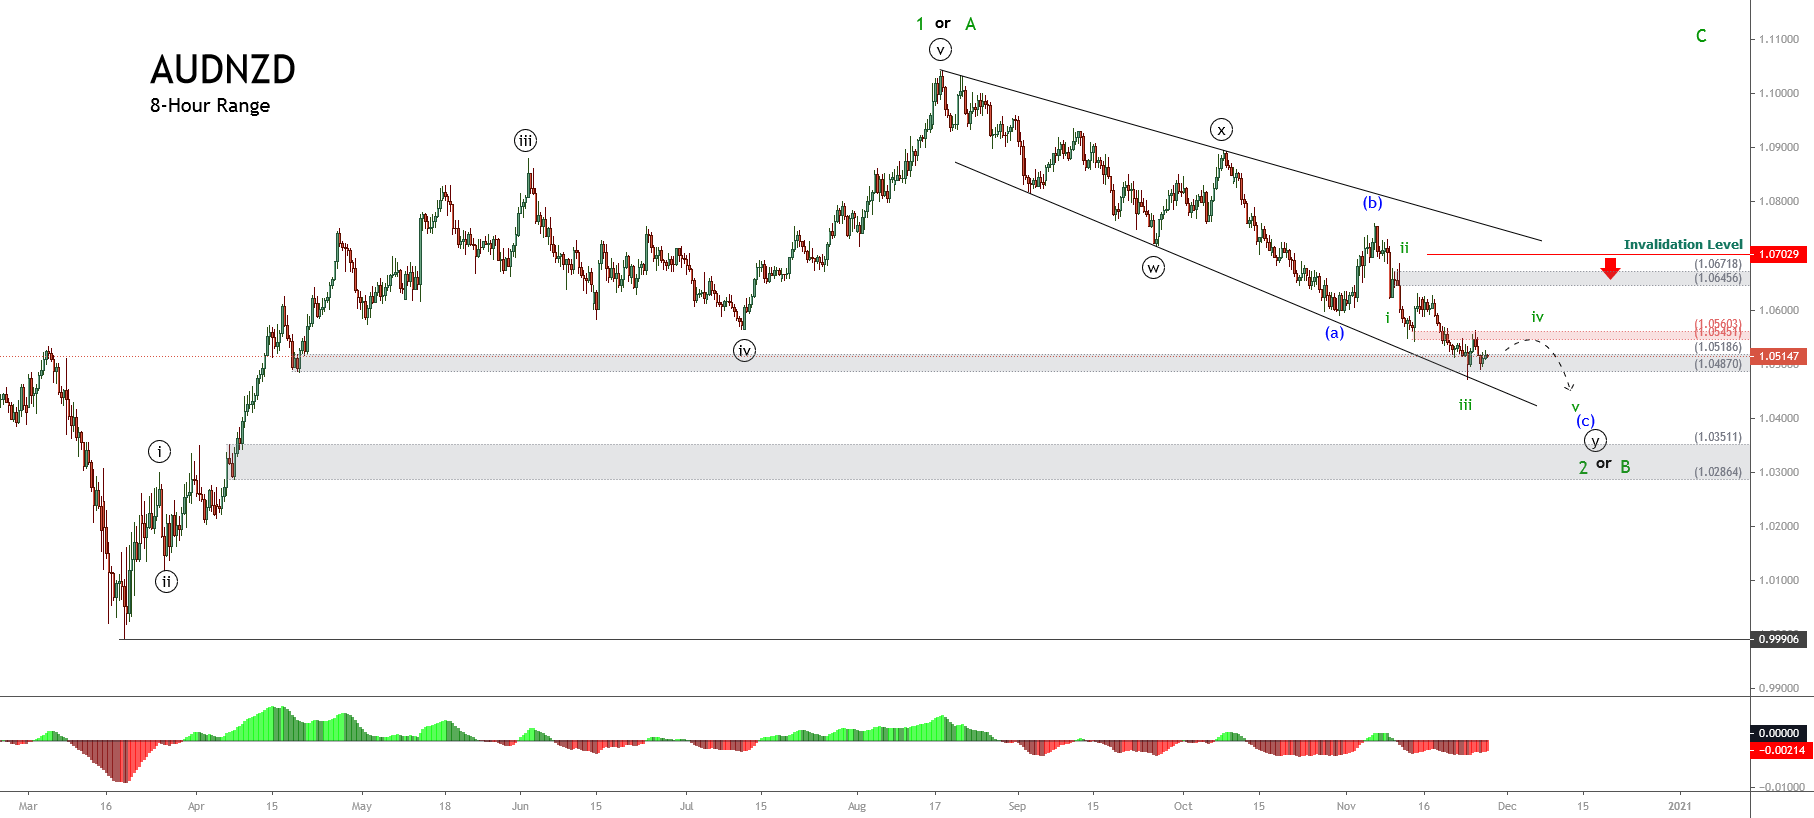
In our last AUDNZD technical analysis, the Oceanic cross was moving in an incomplete complex corrective sequence corresponding to wave (c) of Minuette degree labeled in blue, which belongs to wave ((y)) of Minute degree identified in black. 

As illustrated in the following 8-hour chart corresponding to our previous mid-November analysis, we commented on the broadening corrective formation the cross develops, which implies an acceleration of the downward sequence. Also, the move that pierced below the wave (a) in blue suggested further declines in the following trading sessions.

Likewise, we observed the potential bearish reaction areas for the decline until two potential demand zones. The first one located between 1.05186 and 1.04870, and the second one bounded between 1.03511 and 1.02864.

On the other hand, according to the Elliott wave theory, a complex corrective formation as a double-three pattern follows an internal sequence subdivided into 3-3-3, where each “three” corresponds to a single complete corrective wave.

Once completed, the current corrective structural series of wave 2 or B of Minor degree, the AUDNZD cross should give way to the start wave 3 or C, in green.

Technical Outlook

The AUDNZD cross in the next 8-hour chart exposes the price action advancing in its wave iii of Subminuette degree labeled in green, which belongs to the incomplete wave (c) of Minuette degree identified in blue. 

Considering the acceleration present in wave (c), the cross could develop an internal upward corrective movement corresponding to wave iv, in green. This move could find resistance in the adjacent supply zone between 1.0457 and 1.05603, where the cross could resume its downward movement, leading it to complete the wave ((y)) of Minute degree and, in consequence, wave 2 or B, in green. 

Once the current downward sequence finishes, the Oceanic cross will be ready for a new long-term rally corresponding to wave 3 or C, in green, which according to the Elliott wave theory, should be the largest wave of the impulsive sequence.

Finally, the invalidation level for the short-term bearish scenario is found at 1.07029, above the end of wave ii in green.


Categories
Forex Elliott Wave Forex Market Analysis

AUDNZD Continues Under Bearish Pressure

Overview

The AUDNZD cross remains moving mostly bearish in the bullish sentiment zone. It alters the price surpassing the 1.10 psychological barrier and begins a corrective sequence that remains in progress; however, this downward movement could end soon.

Market Sentiment

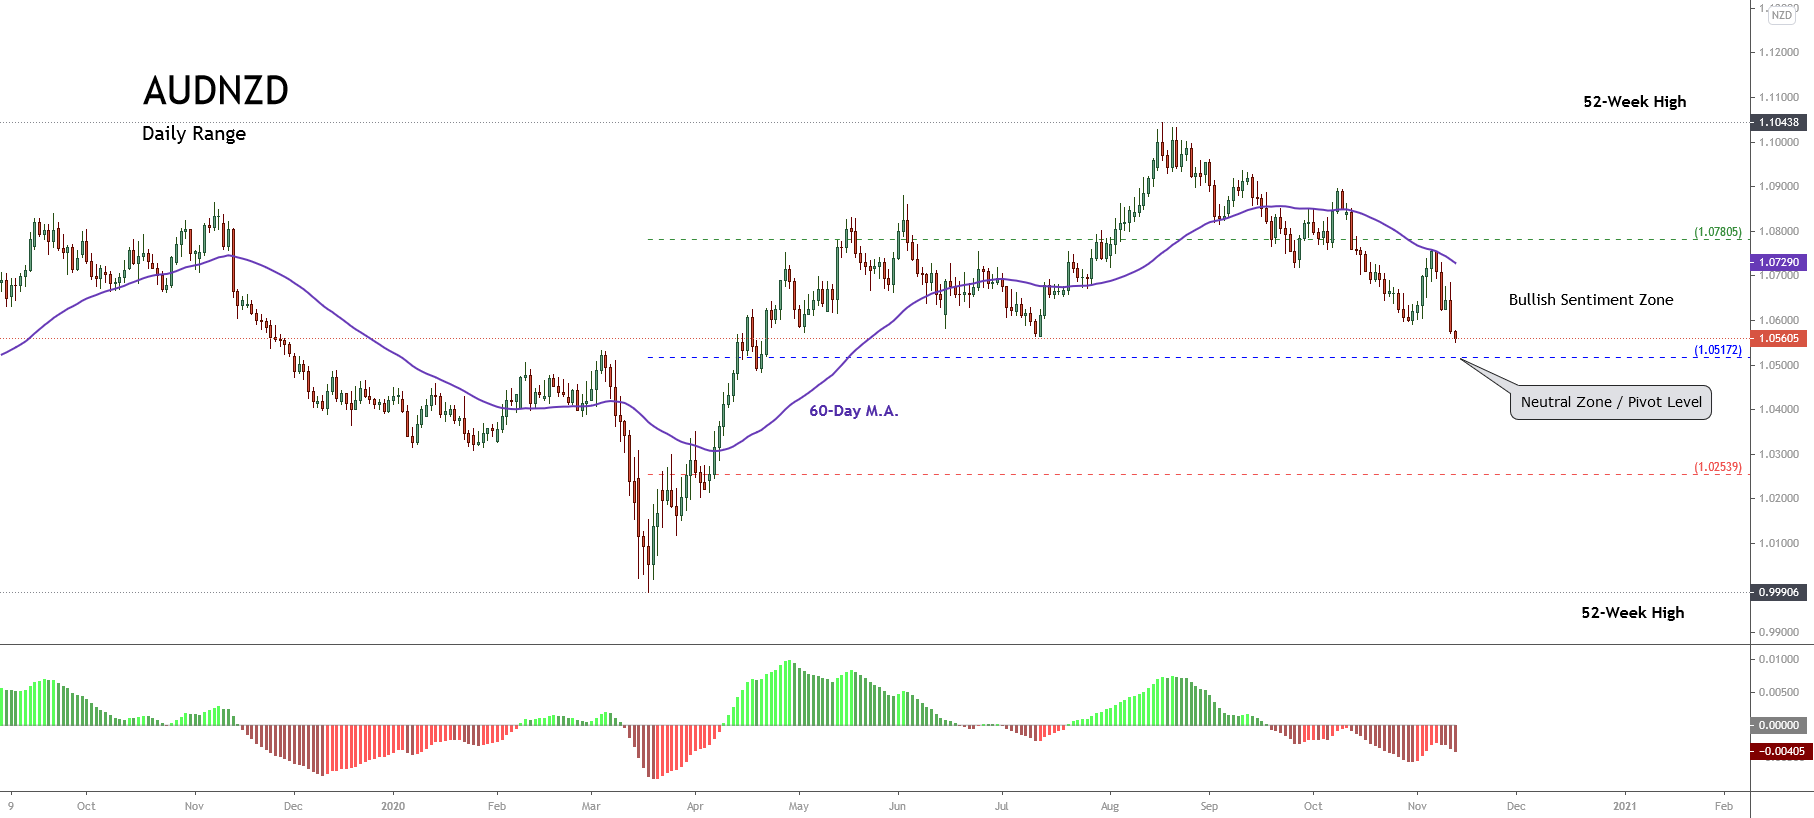
The AUDNZD moves mostly downward in the bullish sentiment zone, piercing July’s low area at 1.056. The Oceanic Cross advances over 1.5% (YTD).

The following figure exposes the AUDNZD cross in its daily timeframe. The chart reveals the long-term market participants’ sentiment bounded by its 52-week high and low range. The price action began a downward sequence; after that, the cross surpassed its last 52-week high of June 02nd, located on 1.08807 in a rally that elapsed six sessions in a row.


Moreover, the 60-day weighted moving average confirms the downward short-term bearish bias that favors the price action. Nevertheless, considering that the cross moves in the bullish sentiment zone, the AUDNZD cross’s decline could be a correction of the upward cycle that began last mid-March.

Technical Overview

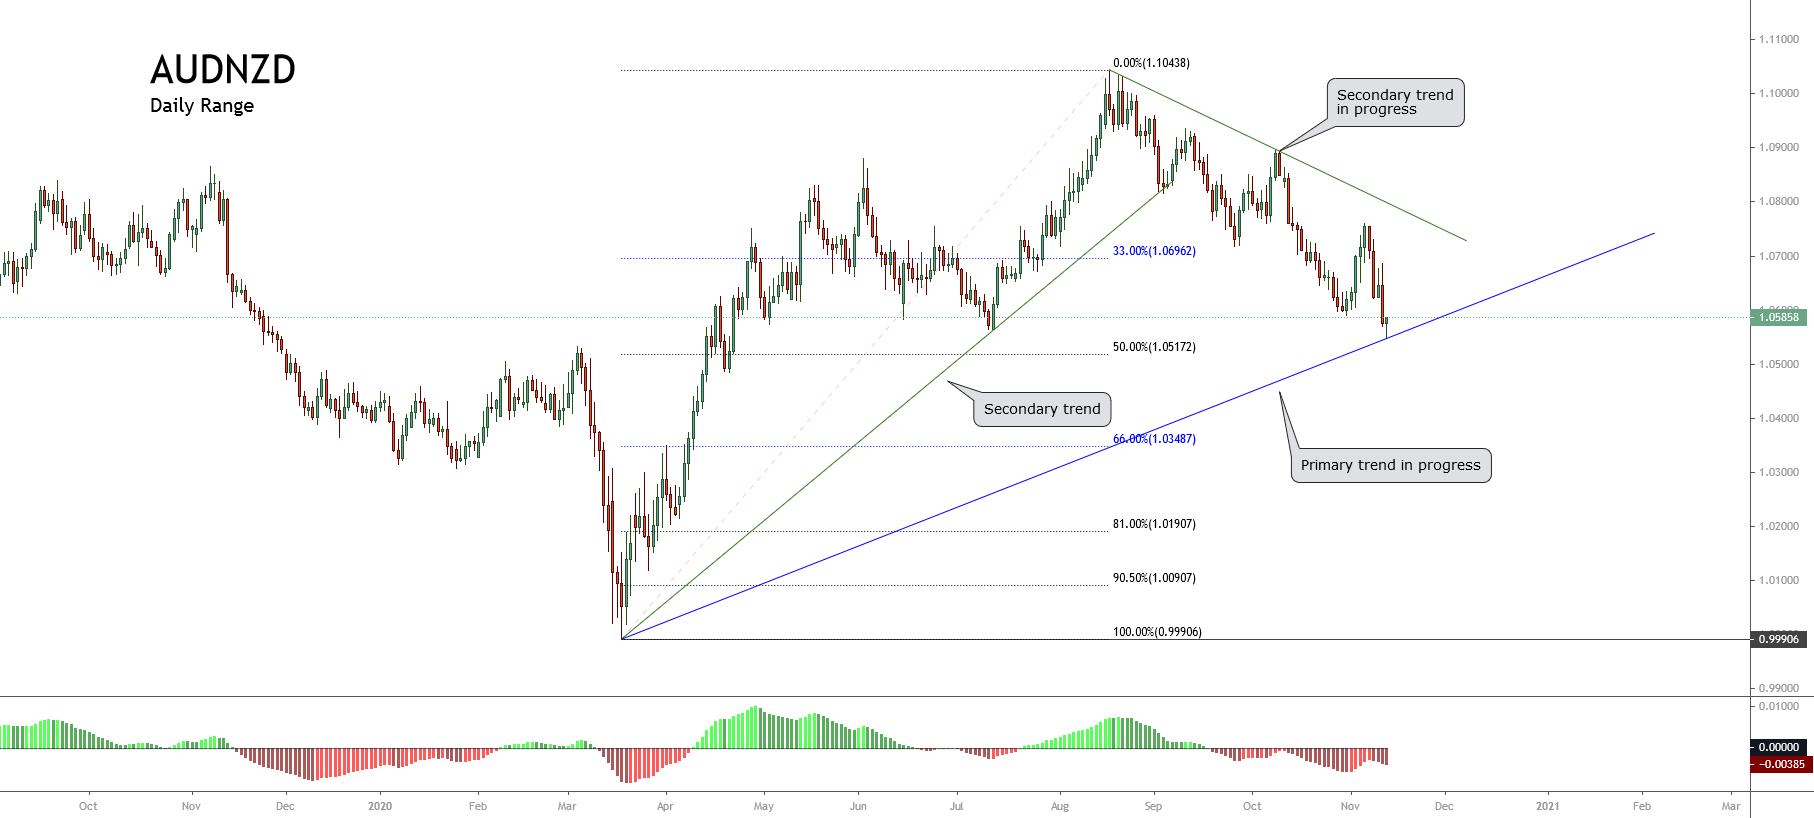
The AUDNZD cross under the Dow Theory perspective reveals that the price has started to develop a bullish primary trend that began on March 18th when the price found fresh buyers at 0.99906.

The following chart illustrates AUDNZD in its daily timeframe. The figure exposes the demand incorporation below the parity, which carried up the price until 1.10438, from where the price started to decline in a secondary trend.

The retracement developed by the Oceanic cross beyond the 33% leads us to confirm that the latest decline in progress corresponds to the rally’s corrective movement that began on March 18th.

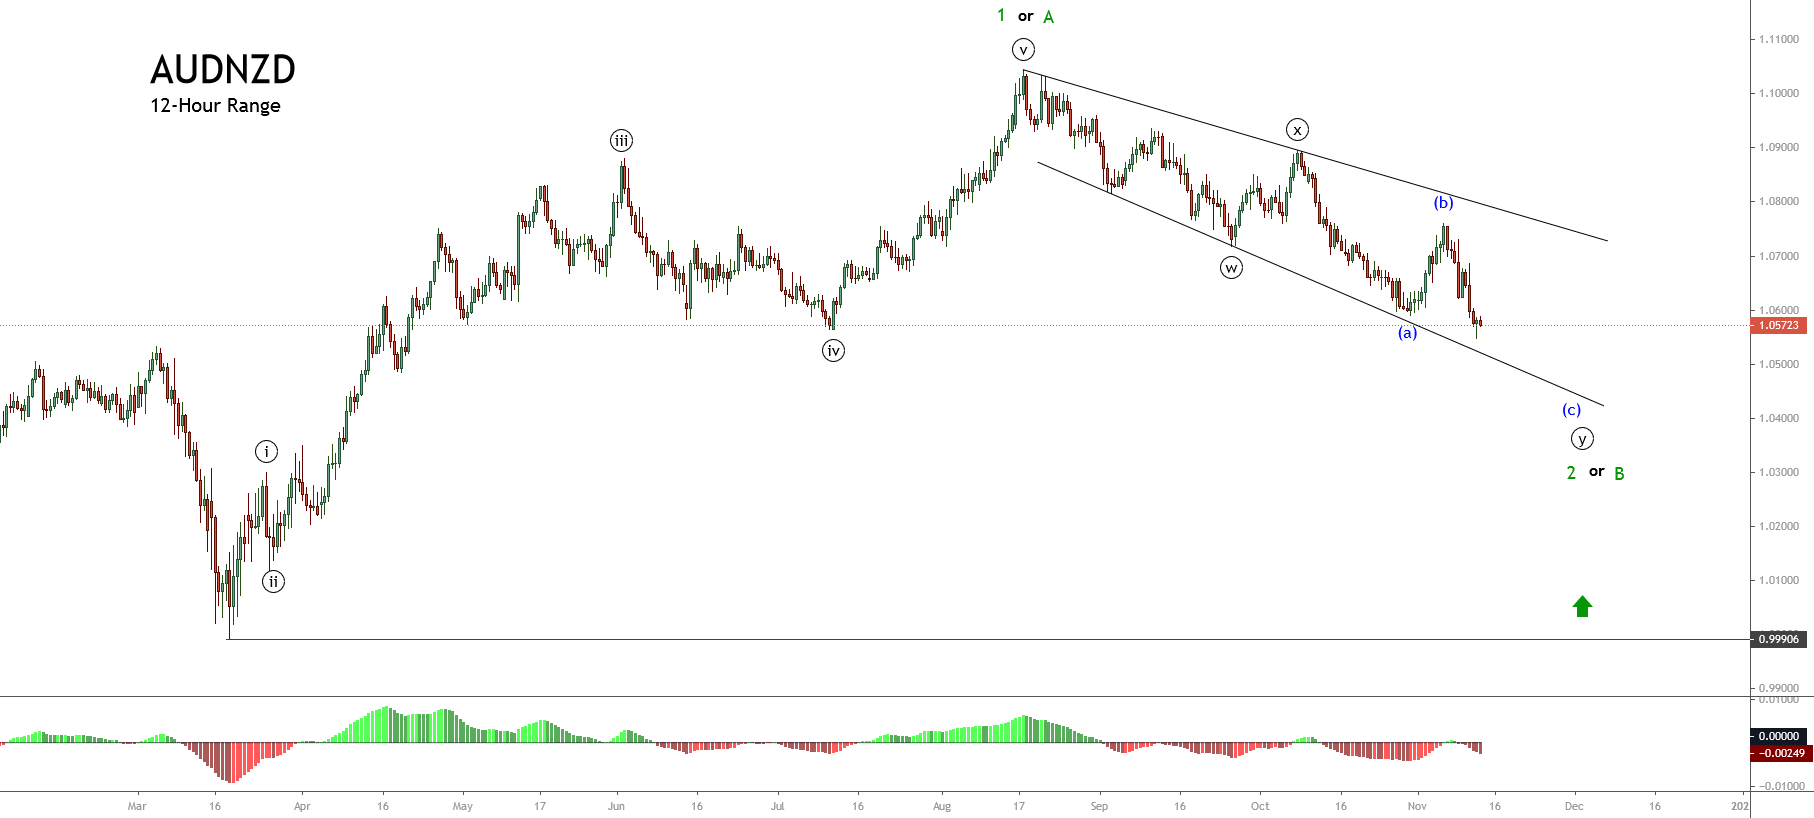
The mid-term Elliott wave view of the AUDNZD cross illustrates in its 12-hour chart the downward move in a complex corrective structure that looks like an incomplete double-three pattern (3-3-3).

The previous chart reveals the price action is moving in its wave (c) of Minuette degree labeled in blue, which belongs to wave ((y)) of Minute degree in black. Likewise, this entire move corresponds to wave 2 or B, which retraces the upward five-wave sequence that began on March 18th at 0.99906.

Technical Outlook

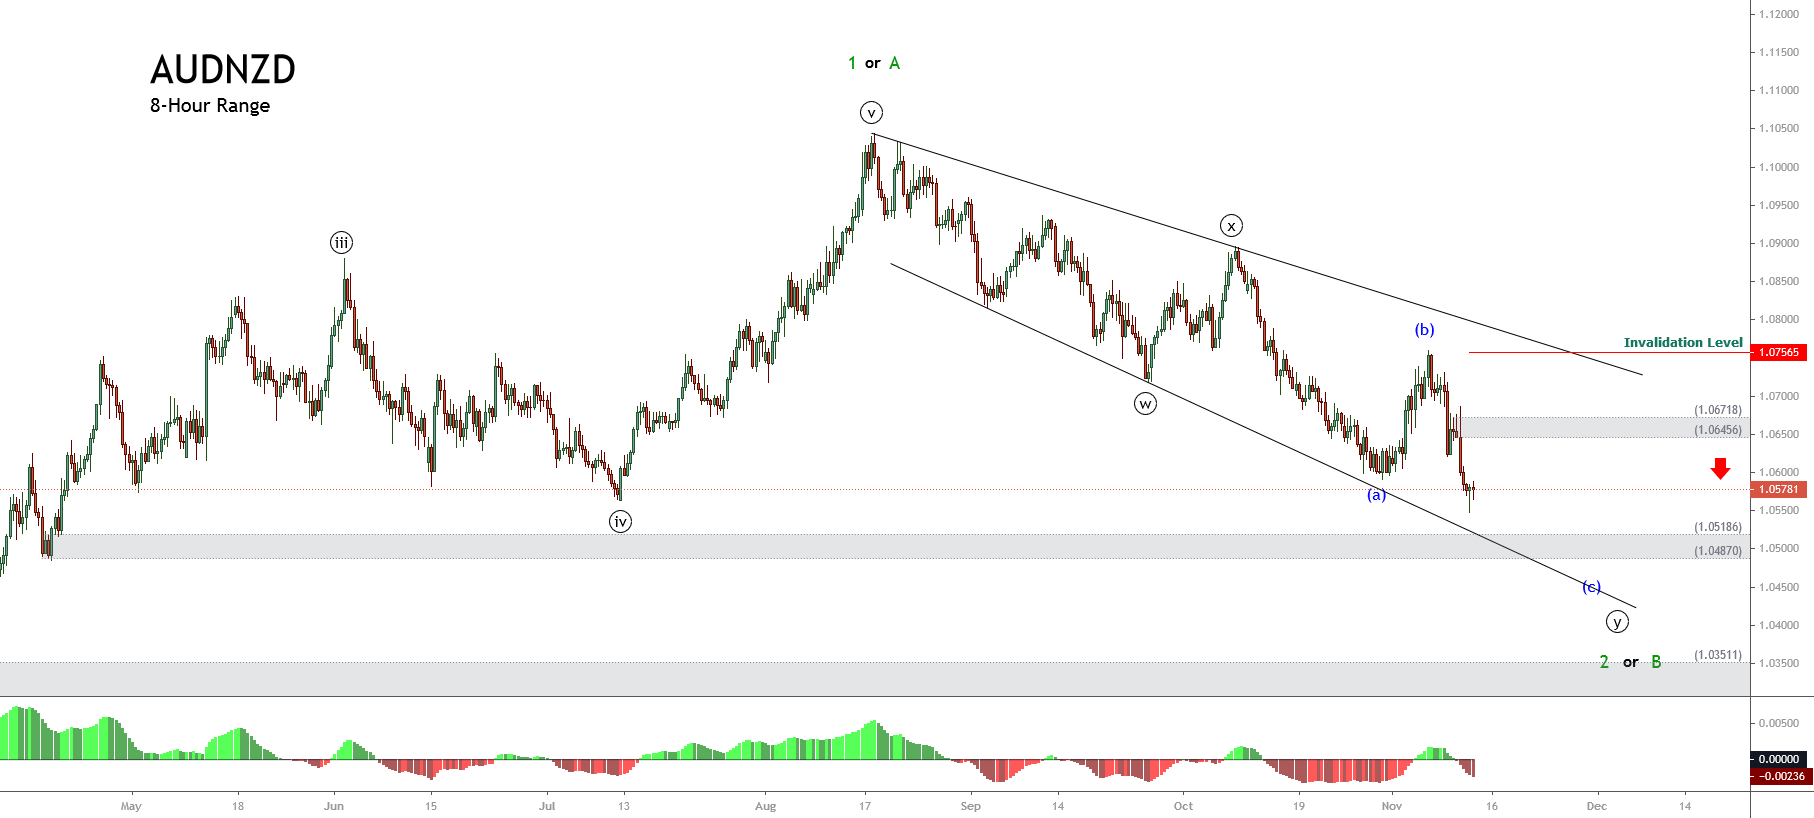
Once the AUDNZD found sellers at 1.07565, the Oceanic cross began its wave (c) of Minuette degree labeled in green that remains in progress.

As illustrated in the following 8-hour chart, the price could extend its declines to the area between 1.05186 and 1.04870, where the price could find support. Likewise, if the price extends its drops below 1.03511, the next movement’s strength could be limited to a re-test of the August 18th high located on 1.103.

On the other hand, if the price action breaks and closes above the supply zone between 1.06456 and 1.06718, there exists the possibility of a new rally. This new bullish leg could surpass the 1.103 mark.

Finally, the invalidation level for the short-term bearish scenario is located at 1.07565.

Categories
Forex Signals

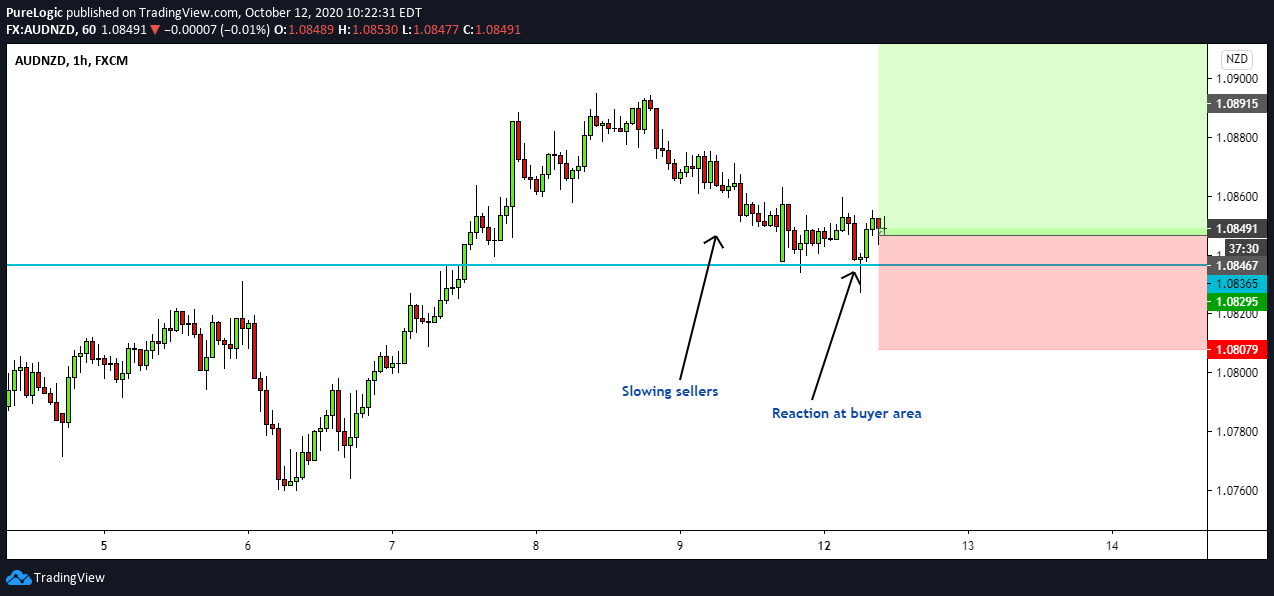
AUDNZD Breakout Retest BUY

Flow Assessment

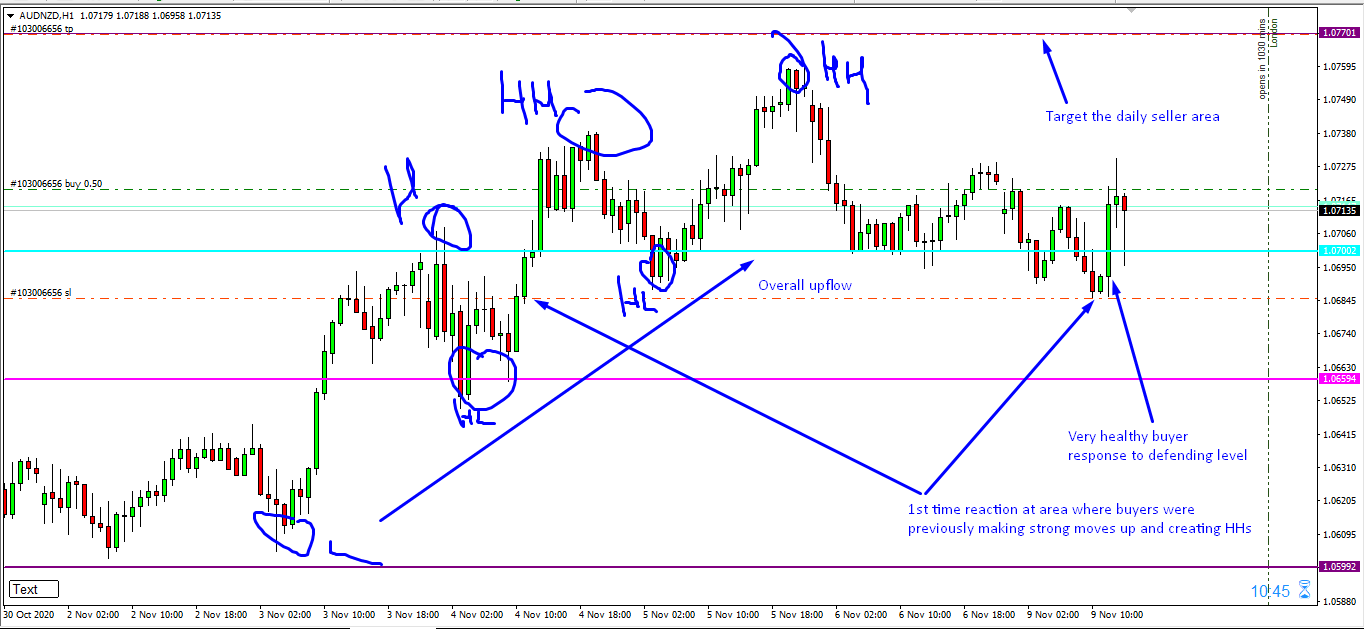
  • Price is in an overall uptrend, thus giving a buy bias. The sellers in the pullback have come in multiple pushes, suggesting profit-taking not a swing reversal

Location Assessment

  • Price has come back to the level where strong buyers pushed up to create a higher high (HH) for the first time, thus making this a good location to buy as there are likely to be more buy orders waiting at these levels

Momentum Assessment

  • We waited for evidence of strong buyers emerging from the level for our entry trigger
Categories
Forex Signals

AUDNZD Breakout Retest Buy

Categories
Forex Market Analysis

Weekly Market Update: Trade War Tensions, BoE Kept Interest Rates at Same Level, RBNZ to Announce Its Official Cash Rate

It has been a busy week for news, looking forward to seeing much volatility this week according to the consequences of the releases last week and the upcoming week’s data


News Commentary


USD

Tensions between the U.S. and China continue, as the two largest economies in the world faced a tit-for-tat over trade tariffs. Earlier this week, U.S. President Donald Trump threatened to impose tariffs on another $200 billion of Chinese goods. China could strike back at blue-chip firms including Caterpillar and Boeing who rely on China for revenue.

The dollar also eased following the release of soft U.S. manufacturing data which came in at 19.9, lower than the expected 28.9.

But demand for the dollar continued to be boosted after Federal Reserve Chairman Jerome Powell reiterated on Wednesday that the case for gradual rate hikes remains strong.

All eyes will be on Tuesday’s CB consumer confidence which is expected to reach 127.6, and Core Durable Goods Orders on Wednesday which is expected to reach 0.5%, and most importantly, the final GDP on Thursday with a forecast of 2.2%, same as the last one.


EUR

The European Union imposed tariffs on about $3.4 billion of U.S. imports on Friday, including motorcycles, orange juice and cranberry sauce. The tariffs have added to tensions as investors fear an outright global trade war between the U.S.and other major countries.

On the other hand, French and German business activity in June came in higher than expected, easing concerns of a slowdown in the Eurozone.
Good news for Greece is that the Eurozone creditors finally agreed a debt relief deal that will help Greece exit its bailout program.
Following late-night talks in Luxembourg, the Eurogroup agreed to hand Greece a final loan tranche of €15 billion.


GBP

The Pound strengthened after the Bank of England left interest rates steady, but the vote for a rate hike by the bank’s chief economist came with a surprise that supported the probability for the next hike in the August meeting.

The MPC voted 6-3 to hold rates flat, but the fact that there were three dissenting votes cast in favour of a rate hike today was a bit more hawkish than what was expected

All eyes will be on the current account on Friday with an expectation of -18.2B


NZD

New Zealand GDP growth dropped by 0.1% compared to the previous two quarters, coming in at just 0.5%, lower than the previous reading of 0.6%.

It’s a busy week for the New Zealand dollar with ANZ business confidence, which measures economic health with the last reading of -27.2.

The big event will be the official cash rate on Wednesday with the expectation to be left steady at 1.75%.


CAD

Disappointing inflation and retail sales from Canada damaged the loonie lower across the board, sending the odds of a July BoC rate hike to 55% from 68% earlier in the week. Meanwhile the odds of an August BoE hike rise to 70%.

All eyes will be on GDP on Friday with the last reading of 0.3%.


Chart Analysis


USD INDEX

As we expected on the daily chart, the price had reached the key resistance at 95.5 and bounced back from it, powered by divergence on RSI & B wave (Elliot waves).

So, the index is supposed to get back down again to the support zone 93.2-92.6, then start its journey to the C wave.


AUD/USD

On the daily chart, the price has reached the support of 0.7325, with a pin bar candle followed by engulfing one.

The pair is supposed to find some breath powered by divergence on RSI to reach the key resistance of 0.7515, where the descending trend from the high of February is located.


USD/JPY

On the daily chart, as we expected, the pair had broken the ascending channel followed by bouncing from the descending trend from the high of 2017 and the key resistance of 111.1.

The price also broke the support of 110.05 to reach the next support 108.15, to then get back up again from this level to retest the level at 110.05.

As you can see on the chart, the price is moving according to Elliot waves. By forming the A & B waves, we are waiting for the next move down to hit the C level which is located at the support of 106 and also to meet the ascending trend from the low of 2016.

So, a bounce has started and on its way.


AUD/NZD

On the daily chart, as we expected before, the price had made its way up to targets at the resistance zone of 1.0815-1.0865, boosted by a BAT harmonic pattern.

The price has already made its retracement as we expected it to.

Reaching the support zone and shaping the Gartley harmonic pattern, the price is supposed to continue its bullish movement up to the 1.1045 level after forming hammer & engulfing candles respectively.


USD/CAD

As we expected before, the price has reached the key resistance level of 1.334

As we can see the price is located at very strong selling area according to many factors, including key resistance level, 78.6% Fibonacci, the upper level of the reversal wedge, forming the Gartley harmonic pattern, and overbought in RSI.

So, any bounce there will lead the price down to the support zone at 1.309-1.299.


NZD/USD

On the daily chart, the price has reached a combination of support levels, with a support zone of 0.682-0.6785, an ascending trend line from the low of 2007, and finally with Bat harmonic pattern.

The price is expected to get back up again to retest the resistance zone at 0.698-0.703.


AUD/JPY

As we expected before, the price has reached the support zone 81.2-80.5 as the price is moving sideways.

So, with this engulfing candle, we expect the price to retest the head of the pattern to again reach the levels 84-84.4.


Categories
Forex Market Analysis

Daily Market Update: Trade Tensions Continue, OPEC Meeting


News Commentary


Tensions between the U.S. and its allies continue, as India joined China and the European Union in retaliation against steel and aluminium tariffs. As the biggest buyer of almonds, India raised its tariff on U.S. almonds by 20%

The European Union imposed tariffs on about $3.4 billion of U.S. imports on Friday, including motorcycles, orange juice and cranberry sauce. The tariffs have added to tensions as investors fear an outright global trade war between the U.S.and other major countries.

On the other hand, French and German business activity in June came in higher than expected, easing concerns of a slowdown in the Eurozone.
Good news for Greece is that the Eurozone creditors finally agreed a debt relief deal that will help Greece exit its bailout program.
Following late-night talks in Luxembourg, the Eurogroup agreed to hand Greece a final loan tranche of €15 billion.

The Organisation of the Petroleum Exporting Countries (OPEC) is gathering in Vienna amid calls from the United States, China and India to cool down the price of crude and prevent an oil deficit that would hurt the global economy.

Saudi Arabia and non-OPEC Russia have said a production increase of about 1 million barrels per day (bpd) or around 1 per cent of global supply had become a near-consensus proposal for the group and its allies.

Although a final decision may not arrive until Saturday when OPEC officials are scheduled to meet with their non-member allies who formed part of the 18-month accord to curb production by 1.8 million barrels per day.


Chart Analysis


NZD/USD

On the daily chart, the price has reached a combination of support levels, with a support zone of 0.682-0.6785, an ascending trend line from the low of 2007, and finally with a BAT harmonic pattern.

The price is expected to get back up again to retest the resistance zone at 0.698-0.703.


AUD/JPY

As we expected before, the price has reached the support zone 81.2-80.5 as it is moving sideways now.

So, with this engulfing candle, we expect the price to retest the head of the pattern to reach the levels of 84-84.4 again.


USD/JPY

On the daily chart, as we expected the pair had broken the ascending channel followed by bouncing from the descending trend from the high of 2017 and the key resistance of 111.1.

The price also broke the support of 110.05 to reach the next support 108.15, to then get back up again from this level to retest the level at 110.05.

As you can see on the chart, the price is moving according to Elliot waves. By forming the A & B waves, we are waiting for the next move down to hit the C level which is located at the support of 106 and also to meet the ascending trend from the low of 2016.

So, a bounce has started and on its way.


AUD/NZD

On the daily chart, as we expected before, the price had made its way up to targets at the resistance zone 1.0815-1.0865, boosted by a BAT harmonic pattern.

The price has already made its retracement as we expected it to.

Reaching the support zone and shaping the Gartley harmonic pattern, the price is supposed to continue its bullish movement up to the 1.1045 level after forming hammer & engulfing candles respectively.


USD/CAD

As we expected before, the price has reached the key resistance level 1.334.

As we can see the price is located at very strong selling area according to;- key resistance level, 78.6% Fibonacci, the upper level of the reversal wedge, forming the “Gartley” harmonic pattern, and overbought in RSI.

So, any bounce there will lead the price down to the support zone at 1.309-1.299.


Categories
Forex Market Analysis

Daily Market Update: Great Britain to Vote About Brexit, Market Reaction to Trade Tensions


News Commentary


Trade tensions between the U.S. and China still remain on investors minds as the two largest economies in the world faced over trade tariffs.

Stocks stumbled on Tuesday after U.S. President Donald Trump threatened to impose tariffs on another $200 billion of Chinese goods if China refused “to change its practices,” he said.

But currency markets had breathed a sigh of relief after Beijing signalled its tolerance of a stronger currency by fixing a stronger daily midpoint than expected. Safe-haven currencies such as the Swiss franc and the Japanese yen were still well-supported, though.

“Market volatility remains very low and the headline risks from trade concerns should push that higher,” said Hans Redeker, global head of currency strategy at Morgan Stanley.

Economists don’t expect the BoE to raise rates on Thursday, and some not optimistic about their forecasts for a rate rise in August, which would be only the central bank’s second increase since the 2008 financial crisis.

The House of Commons was to vote on the EU withdrawal bill, the government’s flagship piece of Brexit legislation, later in the day.

The government is seeking to defeat an attempt to give MPs a “meaningful vote” before Britain could leave the EU without a deal.

The vote is coming at a time of growing investor nervousness that Brexit negotiations could fail to reach an agreement.


Chart Analysis


US INDEX

As expected, after breaking the wedge reversal pattern, the price met the broken ascending trend from the high of 2017, meeting the broken ascending channel, heading the B level of the ABC Elliot waves. Divergence on RSI followed by breaking the upper line as shown.

According to Elliot, we can see a spike from that level to 97.9.


USD/JPY

On the daily chart, as we expected the pair had broken the ascending channel followed by bouncing from the descending trend from the high of 2017 and the key resistance of 111.1.

The price also broke the support of 110.05 to reach the next support 108.15, to then get back up again from this level to retest the level at 110.05.

As you can see on the chart, the price is moving according to Elliot waves. By forming the A & B waves, we are waiting for the next move down to hit the C level which is located at the support of 106 and also to meet the ascending trend from the low of 2016.

So, a bounce has started and on its way.


USD/CAD

On the daily chart, the price eventually broke the resistance zone of 1.309-1.299, followed by a break of the ascending trend line from the high of 2016, with an engulfing candle.

As we expected that, we need another confirmation bullish candle to assure the long bias, the price is expected to reach 1.34.


AUD/NZD

On the daily chart, as we expected before, the price had made its way up to targets at the resistance zone 1.0815-1.0865, boosted by a BAT harmonic pattern.

The price has already made its retracement as we expected it to.

Reaching the support zone and shaping the Gartley harmonic pattern, the price is supposed to continue its bullish movement up to the 1.1045 level after forming hammer & engulfing candles respectively.


Categories
Forex Market Analysis

Weekly Market Update: ECB Left Interest Rate, US-China Trade War, Great Britain Official Bank Rate

We had a busy last week with announcements from central banks (FED & ECB), also there was the conflict at the G7 summit, the consequences of Singapore summit.

So, we will discuss the upcoming results from all this data, along with the most important releases of the next week.


News Commentary


USD

The FED delivered the widely expected rate hike overnight, with a hawkish statement and economic projections. FOMC raised the Fed funds to 2.00%.

The Trump administration has slapped a 25% tariff on 818 Chinese goods, with a total value of up to $50B.

This action comes on top of the recent decision to impose steel and aluminium tariffs on many US allies, including Canada, Mexico and the European Union. Predictably, those countries countered with $20B in tariffs on US goods.

U.S. President Donald Trump and North Korean leader Kim Jong Un signed a ‘comprehensive’ deal at a historic summit aimed at the denuclearisation of the Korean peninsula.

Trump said the meeting in Singapore had gone “better than anybody could have expected” and he anticipated that the denuclearisation process would start “very, very quickly”, adding he had formed a “special bond” with Kim and the relationship with North Korea would be very different.


EUR

The regulator plans to complete the quantitative easing program in December 2018. The Central Bank left interest rates unchanged and said that it is not going to raise them until mid-2019. The speech by Mario Draghi, President of the European Central Bank, also hit the euro. The official said that the slowdown in the economic recovery in the Eurozone was not temporary, but also reached a global level. The ECB lowered the forecast for economic growth in the Eurozone from 2.4% to 2.1% this year.


GBP

Positive data came from Great Britain to enhance the sterling, with the retail sales reading 1.3%, higher than the expected 0.5%.

On Thursday the Bank of England is expected to leave all monetary policy levers untouched and the market will then look for clues on future moves from the MPC voting pattern and the subsequent press release. Governor Carney may also give his thoughts on UK Q2 GDP after this week’s data looks likely to weigh on second-quarter growth.


AUD

The Australian Dollar was trading as the weakest currency last week as it is pressured by its own data miss as well as weaker than expected China data. Australia employment rose 12k seasonally adjusted in May, below the consensus of 19.2k. The unemployment rate dropped to 5.4%, as participation rate also dropped to 65.5%.

All eyes will on the monetary policy meeting on Tuesday 1:30 GMT


Chart Analysis


US INDEX

After breaking the reversal pattern “wedge”, the price met the broken ascending trend from the high of 2017, meeting the broken ascending channel, heading the B level of the ABC Elliot waves, divergence on RSI followed by breaking the upper line as shown.

According to Elliot, we can see a spike from that level to 97.9.


USD/JPY

On the daily chart, the pair had broken the ascending channel followed by bouncing from the descending trend from the high of 2017 and the key resistance of 111.1.

The price also broke the support 110.05 to reach the next support 108.15 to get back up again from this level to retest the level at 110.05.

As you can see on the chart, the price is moving according to Elliot waves. By forming the A & B waves, we are waiting for the next move down to hit the C level which is located at the support of 106 and also to meet the ascending trend from the low of 2016.

So, a bounce is expected to be on its way.


USD/CAD

On the daily chart, the price eventually broke the resistance zone 1.309-1.299 followed by break the ascending tend line from the high of 2016, with an engulfing candle.

But also we can see that it touches the top of the “horn” & “wedge” patterns.

So, we only need another confirmation bullish candle to assure the long bias to reach 1.334.


AUD/USD

As we expected, the price will have a strong bearish rally to the support 0.7155. This has been prepared according to five causes;-

The descending trend line from the high of February, breaking of the flag, the resistance zone, and eventually the B level of the ABC Elliott waves

so, the C wave is on its way


 AUD/JPY

As we expected, the pair had formed a wedge which had been broken to reach the support zone 81.2-80.5, to make the price ranges sideways between 80.5 & 84.4.

The price is about to have a bearish bias according to:

bouncing from the resistance zone 84.4-93.9, forming continuous ‘flag’ patterns, bouncing from the moving average 200, and ABC Elliot waves

So, the price is expected to head for 76.25.


AUD/NZD

On the daily chart, as we expected before, the price had made its way up to targets at the resistance zone 1.0815-1.0865, boosted by a BAT harmonic pattern.

The price has already made its retracement as we expected it to.

Reaching the support zone and forming the Gartley harmonic pattern, the price is supposed to continue its bullish movement up to the 1.1045 level after any possible price action from these levels.


Categories
Forex Market Analysis

Daily Market Update: Market Is Waiting For FOMC and ECB Meeting


News Commentary


Trading is hesitant early on Wednesday as investors awaited further guidance from the Federal Reserve on future U.S. rate rises to shed some light on how many times interest rates may go up this year.

Investors have shifted their focus to the two-day Federal Open Market Committee (FOMC) meeting that starts Wednesday. With a rate hike almost fully priced in, markets are focusing on whether the Fed will signal hiking rates four times this year, rather than the three times as indicated earlier in the year.


The Euro rose to three-week highs against the dollar last week after hawkish ECB comments fueled speculation that the bank could signal its intention to start unwinding its bond purchasing program.

Tomorrow’s meeting will hold some extra news about when the ECB cuts its quantitative easing program.


The Bank of Japan will also review its monetary policy at a two-day meeting that ends on Friday, but will likely keep its policy intact.


Chart Analysis


AUD/JPY

On the daily chart, we can see that the price is moving sideways between the resistance zone 84.4-84.15 and the support zone 81.2-80.5.

The price has now entered the red resistance area with a possible bounce.

Also, watch the ascending channel which has formed to be considered as a flag pattern. The pattern boosts the original trend which is a down one.

So, any bounce now with price action will push the price to fall.


AUD/NZD

On the daily chart, as we expected before, the price had made its way up to targets at the resistance zone 1.0815-1.0865, boosted by a BAT harmonic pattern.

The price has already made its retracement as we expected it to.

Bouncing from the support zone and the broken descending trend from the high of 2017, the price is supposed to continue its bullish movement up to the 1.1045 level.

But the price may correct to the level 1.0755 to find support by the Gartley harmonic pattern.


USD/CAD

On the daily chart, as expected, the price made its way into the resistance zone of 1.289-1.298, almost reaching the key resistance at 1.309, with an approach from the descending trend line starting from the high of 2015, and the upper edge of the horn pattern.

The price is near the key resistance level 1.309, any bounce back from there would take the price firstly to the support level at 1.274.


AUD/USD

On the daily chart, the pair had a correction to the 0.758 level supported by the resistance level 0.766 and the descending line from the high of 2018.

The price has bounced from the 0.758 level near the edge of the ascending channel.

So if the price could break the resistance 0.766 and the descending line, it may reach 0.774 which is a level with a combination of the upper edge of the channel and the broken uptrend.


Categories
Forex Market Analysis

Daily Market Update: Market’s Reaction to US-North Korea Summit and Central Banks Meetings


News Commentary


U.S. President Donald Trump and North Korean leader Kim Jong Un signed a ‘comprehensive’ deal at a historic summit aimed at the denuclearisation of the Korean peninsula.

Trump said the meeting in Singapore had gone “better than anybody could have expected” and he anticipated that the denuclearisation process would start “very, very quickly”, adding he had formed a “special bond” with Kim and the relationship with North Korea would be very different.


On the other hand, Trump upset the Group of Seven’s efforts to show a united front, choosing to back out of a previous joint communique. The action drew criticism from Germany and France, and Trump called Canadian Prime Minister Justin Trudeau “very dishonest and weak.”

However, “markets are generally shrugging off the G7 trainwreck,” said Ray Attrill, head of Forex strategy at the National Australia Bank.

Instead, markets are looking ahead to a busy week.

Policy meetings of the U.S. Federal Reserve and the European Central Bank, as well as a Brexit bill vote in the British parliament, have the whole show.

The U.S. Federal Reserve is widely expected to raise interest rates this week while investors are focused on whether the central bank will hint at raising rates a total of four times in 2018.

All eyes will be also on the U.S. CPI at 12:30 GMT with expectations to remain steady at 0.2%.


The European Central Bank also meets to decide whether it could signal intentions to start unwinding its massive bond purchasing program.

Helping calm markets were comments from Italy’s new coalition government that it had no intention of leaving the Eurozone and planned to cut debt.


Chart Analysis


US INDEX

On the daily chart, the price had successfully broken the ascending trend from the high of 2017, along with the resistance level to eventually reach the key resistance of 95.15 to bounce back from there. The price shaped a reversal pattern (wedge) which closed with a break beneath it.

With divergence in RSI, the price is expected to have a correction to the key support at 92.6 which is located at the broken trend too, only if it breaks the support of 93.4.


USD/JPY

On the daily chart, the pair had broken the ascending channel followed by bouncing from the descending trend from the high of 2017 and the key resistance of 111.1.

The price also broke the support 110.05 to reach the next support 108.15 to get back up again from this level to retest the level at 110.05.

As you can see on the chart, the price is moving according to Elliot waves. By forming the A & B waves, we are waiting for the next move down to hit the C level which is located at the support 106.9.

So, any bounce now with price action will enhance the down run.


AUD/JPY

On the daily chart, we can see that the price is moving sideways between the resistance zone 84.4-84.15 and the support zone 81.2-80.5.

The price now has entered the red resistance area with a possible bounce.

Also, watch the ascending channel which has formed to be considered as a flag pattern. The pattern boosts the original trend which is a down one.

So, any bounce now with price action will push the price to fall.


AUD/NZD

On the daily chart, as we expected before, the price had made its way up to targets at the resistance zone 1.0815-1.0865, boosted by a BAT harmonic pattern.

The price has already made its retracement as we expected it to.

Bouncing from the support zone and the broken descending trend from the high of 2017, the price is supposed to continue its bullish movement up to the 1.1045 level.

But the price may correct to the level 1.0755 to find support by the Gartley harmonic pattern.


USD/CAD

On the daily chart, as expected, the price made its way into the resistance zone of 1.289-1.298, almost reaching the key resistance at 1.309, with an approach from the descending trend line starting from the high of 2015, and the upper edge of the horn pattern.

The price has already bounced beneath the key resistance and the resistance zone and got back above it again, but it couldn’t go much further to form a pinbar, to take the price firstly to the support level at 1.274.


AUD/USD

On the daily chart, the pair had a correction to the 0.758 level supported by the resistance level 0.766 and the descending line from the high of 2018.

The price has bounced from the 0.758 level near the edge of the ascending channel.

So if the price could break the resistance 0.766 and the descending line, it may reach 0.774 which is a level with a combination of the upper edge of the channel and the broken uptrend.


NZD/USD

On the daily chart, as we expected before, the pair had bounced from the ascending trend, along with breaking a descending trend, to reach our target at the resistance zone at 0.697-0.702.

According to the BAT-shaped harmonic pattern we expected, the price has already reached our first target and is expected to reach the B point at the next resistance zone of 0.7155-0.7185.

The price may have a little retracement before hitting this target.


Categories
Forex Market Analysis

Weekly Market Update: G7 & US-North Korea Summit, Central Banks Meetings


News Commentary


We have a busy week coming up. What will follow the consequences of the G7 summit, and what news will be released regarding the US-North Korea summit. We also have the Federal Central Bank meeting (FOMC), the European Central Bank meeting, and the Bank of Japan meeting who all have to decide their rates and give hints about the economic polices.


US

U.S. President Donald Trump threatened to stop trading with countries that do not reduce barriers to American exports.

Trump said on Saturday that he had instructed his representatives not to endorse the G7 communique and that his administration was considering imposing tariffs on automobiles, further raising the spectre of a trade war that has unnerved Washington’s top allies.

U.S. President Donald Trump and North Korean leader Kim Jong Un are expected to land in Singapore on Sunday within hours of each other in advance of a historic summit over the reclusive country’s arsenal of nuclear weapons.

The unprecedented meeting comes after weeks of sometimes-contentious discussions and was briefly cancelled amid North Korean outrage over messaging from some U.S. advisers.

The Federal Reserve is almost certain to raise interest rates by a quarter point for a second time this year at the conclusion of its two-day policy meeting at 18:00 GMT on Wednesday.


EUR

The Euro strengthened on rising bets that the European Central Bank (ECB) may soon announce it will start shooting off its massive bond purchase program.

The central bank’s chief economist Peter Praet, a close ally of President Mario Draghi, said the ECB would discuss next week whether to end bond purchases later this year.

Some reports said that at its next policy meeting this week, the ECB could declare on when its quantitative easing program would end.

“The market will start to focus on the ECB from now on. Politics in Italy and Spain will play second fiddle as we now have new governments in both countries,” said Kazushige Kaida, head of foreign exchange at State Street Bank.


AUD

The RBA Board decided to leave the cash rate unchanged at 1.50%.

“The recent data on the Australian economy has been consistent with the Bank’s central forecast for GDP growth to pick up, to average a bit above 3% in 2018 and 2019. Business conditions are positive and non-mining business investment is increasing. Higher levels of public infrastructure investment are also supporting the economy. Stronger growth in exports is expected. One continuing source of uncertainty is the outlook for household consumption. Household income has been growing slowly, and debt levels are high” declared media section of the RBA.

The Australian dollar was supported by GDP growth numbers, which rose 1% in the first quarter of 2018, beating the estimated 0.8%. On an annualised basis, growth was 3.1%, above both the expected 2.8% and the previous quarter’s 2.4% gain.


JPY

The Bank of Japan (BoJ) is seen keeping policy on hold at the conclusion of its two-day rate review on Friday, including a pledge to keep short-term interest rates at minus 0.1%.

BoJ Governor Haruhiko Kuroda will hold a press conference afterwards to discuss the decision.

Kuroda has previously said the central bank will telegraph to markets how it plans to exit from ultra-easy policy when conditions for hitting its price goal become robust.


Chart Analysis


US INDEX

On the daily chart, the price had successfully broken the ascending trend from the high of 2017, along with the resistance level to eventually reach the key resistance 95.15 to bounce back from there. The price shaped a reversal pattern (wedge) which closed with a break beneath it.

With divergence in RSI, the price is expected to have a correction to the key support at 92.6 which is located at the broken trend too.


USD/JPY

On the daily chart, the pair had broken the ascending channel followed by bouncing from the descending trend from the high of 2017 and the key resistance of 111.1.

The price also broke the support 110.05 to reach the next support 108.15 to get back up again from this level to retest the level at 110.05.

As you can see on the chart, the price is moving according to Elliot waves. By forming the A & B waves, we are waiting for the next move down to hit the C level which is located at the support 106.9.

So, any bounce now with price action will enhance the down run.


AUD/JPY

On the daily chart, we can see that the price is moving sideways between the resistance zone 84.4-84.15 and the support zone 81.2-80.5.

The price has now entered the red resistance area with a possible bounce.

Also, watch the ascending channel which has formed to be considered as a flag pattern. The pattern boosts the original trend which is a down one

So, any bounce now with price action will push the price to fall.


AUD/NZD

On the daily chart, as we expected before, the price had made its way up to targets at the resistance zone 1.0815-1.0865, boosted by a BAT harmonic pattern.

The price has already made its retracement as we expected it too.

Bouncing from the support zone and the uptrend from the low of April, and the broken descending trend from the high of 2017, the price is supposed to continue its bullish movement up to the 1.1045 level.


USD/CAD

On the daily chart, as expected, the price made its way into the resistance zone of 1.289-1.298, almost reaching the key resistance at 1.309, with an approach from the descending trend line starting from the high of 2015, and the upper edge of the horn pattern.

The price has already bounced beneath the key resistance and the resistance zone and got back above it again, but it couldn’t go much further to form a pinbar, to take the price firstly to the support level at 1.274.


AUD/USD

On the daily chart, the price had a false break beneath the support zone 0.75-0.7535 with a pin bar. That enhances the AB=CD harmonic pattern, with breaking a descending channel. The pair rose with an engulfing candle above the support zone.

Along with divergence in RSI, the price is ready for the next move up to 0.774 which is a level with a combination of the lower trend line from the high of 2018 and the broken uptrend.

The price may have a little retracement before heading this target.


NZD/USD

On the daily chart, as we expected before, the pair had bounced from the ascending trend with an engulfing candle, along with breaking a descending trend, to reach our target at the resistance zone at 0.697-0.702.

According to the BAT-shaped harmonic pattern we expected, the price has already reached our first target and is expected to reach the B point at the next resistance zone of 0.7155-0.7185.

The price may have a little retracement before heading this target.


Categories
Forex Market Analysis

Daily Market Update: G7 Summit


News Commentary


All eyes will be on the upcoming G-7 meeting in Quebec as the summit comes at a time of escalating trade tensions between the U.S and some of its major trading partners. Last week, all finance ministers from six members of the G-7 criticised the US Treasury Secretary Steve Mnuchin. The trouble started last week, when the Trump administration imposed tariffs on Canada, Mexico and the European Union. Mexico and Canada are hugely dependent on American demand for their products, which is why over the last few months they’ve shown willingness to grant the US more favourable conditions within the North America Free Trade Area (Nafta). The trade tension is sure to dominate the summit, if these leaders cannot reach an equivalent point, investors could dump their risks to head for safe-haven assets.


On the other hand, there’s a release of big date for Canada, at 12:30 GMT. There’s  Employment Change with a forecast of 19.1K, and Unemployment Rate with a forecast of 5.8%. These figures could give the Canadian some fresh air.


Chart Analysis


US INDEX

On the daily chart, the price had successfully broken the ascending trend from the high of 2017, along with the resistance level to eventually reach the key resistance 95.15 to bounce back from there. The price shaped a reversal pattern (wedge) which closed with a break beneath it.

With divergence in RSI, the price is expected to have a correction to the key support at 92.6 which is located at the broken trend too.


USD/JPY

On the daily chart, the pair had broken the ascending channel followed by bouncing from the descending trend from the high of 2017 and the key resistance of 111.1.

The price also broke the support 110.05 to reach the next support 108.15 to get back up again from this level to retest the level at 110.05.

As you can see on the chart, the price is moving according to Elliot waves. By forming the A & B waves, we are waiting for the next move down to hit the C level which is located at the support 106.9.

So, any bounce now with price action will enhance the down run.


AUD/JPY

On the daily chart, we can see that the price is moving sideways between the resistance zone 84.4-84.15 and the support zone 81.2-80.5.

The price now has entered the red resistance area with a possible bounce.

Also, watch the ascending channel which has formed to be considered as a flag pattern. The pattern boosts the original trend which is a down one

So, any bounce now with price action will push the price to fall


AUD/NZD

On the daily chart, as we expected before, the price had made its way up to targets at the resistance zone 1.0815-1.0865, boosted by a BAT harmonic pattern.

The price has already made its retracement as we expected it too.

Bouncing from the support zone and the uptrend from the low of April, and the broken descending trend from the high of 2017, the price is supposed to continue its bullish movement up to the 1.1045 level.


USD/CAD

On the daily chart, as expected, the price made its way into the resistance zone of 1.289-1.298, almost reaching the key resistance at 1.309, with an approach from the descending trend line starting from the high of 2015, and the upper edge of the horn pattern.

The price has already bounced beneath the key resistance and the resistance zone and got back above it again, but it couldn’t go much further to form a pinbar, to take the price firstly to the support level at 1.274.


AUD/USD

On the daily chart, the price had a false break beneath the support zone 0.75-0.7535 with a pin bar. That enhances the AB=CD harmonic pattern, with breaking a descending channel. The pair rose with an engulfing candle above the support zone.

Along with divergence in RSI, the price is ready for the next move up to 0.774 which is a level with a combination of the lower trend line from the high of 2018 and the broken uptrend.

The price may have a little retracement before hitting this target


NZD/USD

On the daily chart, as we expected before, the pair had bounced from the ascending trend with an engulfing candle, along with breaking a descending trend, to reach our target at the resistance zone at 0.697-0.702.

According to the BAT-shaped harmonic pattern we expected, the price has already reached our first target and is expected to reach the B point at the next resistance zone of 0.7155-0.7185.

The price may have a little retracement before hitting this target


Categories
Forex Market Analysis

Daily Market Update: Raised GDP in Australia, NAFTA Pressures the Canadian, ECB Next Move


News Commentary


The Australian dollar was supported by GDP growth numbers, which rose 1% in the first quarter of 2018, beating the estimated 0.8%. On an annualised basis, growth was 3.1%, above both the expected 2.8% and the previous quarter’s 2.4% gain.

Trade talks between the U.S. and China are ongoing. China offered to increase the buying of U.S. goods by $25 billion this year which grabbed some attention. The reports said China would step up purchases of crude oil, coal and farm products.

The Canadian dollar came under renewed pressure after White House economic adviser, Larry Kudlow, said on Tuesday that President Donald Trump is considering holding separate talks with Canada and Mexico.

That added fuel to the speculation that the United States could dispose of the North American Free Trade Agreement (NAFTA).

All eyes will be on the Canadian trade balance at 12:30 GMT with a forecast of -3.4B.

Some reports said that at its next policy meeting this month, the ECB could declare on when its quantitative easing program would end.

“The market will start to focus on the ECB from now on. Politics in Italy and Spain will play second fiddle as we now have new governments in both countries,” said Kazushige Kaida, head of foreign exchange at State Street Bank.


Chart Analysis


USD/JPY

On the daily chart, the pair had broken the ascending channel followed by bouncing from the descending trend from the high of 2017 and the key resistance of 111.1.

The price also broke the support 110.05 to reach the next support 108.15 to get back up again from this level to retest the level at 110.05.

As you can see on the chart, the price is moving according to Elliot waves. By forming the A & B waves, we are waiting for the next move down to hit the C level which is located at the support 106.9.

So, any bounce now with price action will enhance the down run.


AUD/JPY

On the daily chart, we can see that the price is moving sideways between the resistance zone 84.4-84.15 and the support zone 81.2-80.5.

The price now has entered the red resistance area with a possible bounce.

Also, watch the ascending channel which has formed to be considered as a flag pattern. The pattern boosts the original trend which is a down one

So, any bounce now with price action will push the price to fall.


AUD/NZD

On the daily chart, as we expected before, the price had made its way up to targets at the resistance zone 1.0815-1.0865, boosted by a BAT harmonic pattern.

The price has already made its retracement as we expected it too.

Bouncing from the support zone and the uptrend from the low of April, and the broken descending trend from the high of 2017, the price is supposed to continue its bullish movement up to the 1.1045 level.


Categories
Forex Market Analysis

Weekly Market Update: RBA Rate Statement, EU Politics, US-China Conflict


News Commentary


US

Investors have been watching the May jobs report closely on Friday for any clues on future monetary policy as maximum employment is one of the Federal Reserve’s key objectives.

All data came positive as Non-Farm Employment Change released with 223K, higher than the expected 189K, and Unemployment Rate decreased by 3.8%. ISM Manufacturing PMI came in at 58.7, better than the forecasted 58.3.

The news has featured that the U.S.-North Korea summit is back on track. North Korea and the US are starting the preparations for the June 12 summit between Kim Jong-un and Donald Trump.

Separately, Trump contacted the Japanese prime minister, Shinzo Abe. He “affirmed the shared imperative of achieving the complete and permanent dismantlement of North Korea’s nuclear, chemical, and biological weapons and ballistic missile programs,” The White House claimed. And they would meet before the Kim-Trump summit.

China warned the United States on Sunday that any agreements reached on trade and business between the two countries will be void if Washington implements tariffs and other trade measures, as the two ended their latest round of talks in Beijing.

That came after U.S. Commerce Secretary Wilbur Ross met Chinese Vice Premier Liu He in Beijing over the weekend.

The world’s two largest economies have threatened each other with tens of billions of dollars’ worth of tariffs in recent months, leading to worries that Washington and Beijing may engage in a full-scale trade war that could damage global growth and oil markets.


EUR

The Euro gained on Thursday as Italian parties renewed attempts to form a government, to calm down the concerns about the wider impact of a political crisis in Europe’s third-largest economy.

The two anti-establishment parties have made many efforts to form a coalition government, rather than force Italy into holding elections for the second time this year in September.

The CPI flash estimate enhanced the regains of the Euro after a reading of 1.9%, which was more than the forecast of 1.6%, along with the core reading of 1.1 %, which was more than the forecast of 1.0%.

Besides, economists have concluded that the ECB will begin hiking rates in the middle of next year.

All eyes will be on the Draghi speech on Tuesday to note any views for the economy and the growth.


CAD

The Bank of Canada Governor, Stephen Poloz, left rates on hold for a third straight decision on Wednesday at 1.25%, but gave a hawkish statement for the economy and removed some cautious language.

The central bank also clarified that recent economic data bolsters its April outlook for a 2% growth in the first half of 2018.

GDP rose to 0.3%, which was higher than the expected 0.2%. That would reinforce the optimism bias for the BOC.

Canada is waiting for some big data this week. Firstly with the trade balance on Wednesday, the last reading was -4.1B, and the unemployment rate on Friday, the last release was 5.8%.


AUD

Australia reported worse than expected Capex data. Private capital expenditures rose only 0.4% in the first quarter against 1.0% estimated and 0.2% from the fourth quarter of last year.

The Australian dollar is also waiting for many events this week. Retail sales on Monday, GDP on Wednesday, and trade balance on Thursday to give an outlook to the economic growth.

All eyes will be on the RBA statement rate on Tuesday, which the RBA is expected to keep rates stable at 1.5%


Chart Analysis


US INDEX

On the daily chart, the price had successfully broken the ascending trend from the high of 2017, along with the resistance level to eventually reach the key resistance 95.15 to bounce back from there.

The price shaped a reversal pattern (wedge) which closed with a break beneath it.

With forming divergence in RSI, the price is expected to have a correction to the key support at 92.6 which is located the broken trend too.


NZD/USD

On the daily chart, as we expected before, the pair had bounced from the ascending trend with an engulfing candle, along with breaking a descending one, to reach our target at the resistance zone at 0.697-0.702.

According to the Bat-shaped harmonic pattern, the price is expected to reach the B point at the next resistance zone 0.7155-0.7185.

The price may face a little retracement before going up to the mentioned targets.


USD/CAD

On the daily chart, as we expected the price had made its way into the resistance zone of 1.289-1.298, almost reaching the key resistance at 1.309, with an approach from the descending trend line starting from the high of 2015, and the upper edge of the horn pattern.

The price has already bounced beneath the key resistance and the resistance zone and got back again above it, but it couldn’t go much further to form a pinbar, to take the price firstly to the support level at 1.274.


AUD/USD

On the daily chart, the price had a false break beneath the support zone 0.75-0.7535 with a pin bar.

That enhances the AB=CD harmonic pattern, with breaking a descending channel.

The pair rose with an engulfing candle from the support zone.

Along with divergence in RSI, the price is ready for the next move up to 0.774 which is a level with a combination of the lower trend line from the high of 2018 and the broken uptrend.


AUD/JPY

On the daily chart, as we expected, the price reached the resistance zone at 84-84.35.

The price couldn’t break through this area to bounce back.

It reached the support levels at 81.25-80.5 (as we expected) to pull back up again boosted by the ascending trend from the low of March.

As the pair is currently moving sideways. The price is expected to retest the resistance zone again.


AUD/NZD

On the daily chart, as we expected before, the price had made its way up to targets at the resistance zone 1.0815-1.0865, boosted by a BAT harmonic pattern.

The price is going to have a little retracement at these levels to continue its bullish movement up to the 1.1045 level.


Categories
Forex Market Analysis

Daily Market Update: Release of US Prelim GDP, and Big Day for the Canadian Dollar


News Commentary


Italian President Sergio Mattarella assigned a former-IMF economist as a temporary Prime Minister.

Now the eurozone’s third-largest economy, Italy will hold new elections in September 2018. Investors may consider whether these elections will strengthen or weaken Italian populist forces.

Besides, economists have concluded that the ECB will begin hiking rates in the middle of next year.

German retail sales & preliminary CPI will be released today with a forecast of 0.5% & 0.3% respectively, followed by Spanish flash CPI with an expectation of 1.7%.

Two big releases for the US are the ADP Non-Farm Employment Change with a forecast of 191K after a previous reading of 204K, and preliminary GDP of 2.3%.

The big announcement today goes for the Bank of Canada with their overnight rate to be stable at the last level of 1.25%, followed by the rate statement which may catch any notes about rate hikes.


Chart Analysis


AUD/NZD

On the daily chart, as we expected before, the price had made its way up to targets at the resistance zone 1.0815-1.0865, boosted by a BAT  harmonic pattern.

The price is going to have a little retracement at these levels to continue its bullish movement up to the 1.1045 level.


CHF/JPY

On the daily chart, the price reversed from the support zone of 107.6-108.4, then broke the descending channel up to reach the key resistance at 112.1.

The price had made a pullback from this level to retest the channel & the zone.

So, the price is expected to revisit these level before approaching the 38.2% Fibonacci at 112.1-112.6.


 NZD/USD

On the daily chart, the pair is still being traded above the ascending trend and the support of 0.6875, with oversold on RSI.

We can also notice that there’s a descending channel that the price has already broken, along with a BAT harmonic pattern which is already shaped. So, we can conclude that the last break beneath the upward trend line was a false break and the pair is about to restart its bullish momentum towards the resistance zone of 0.697-0.702.


Categories
Forex Market Analysis

LONG-TERM PICKS – Watching the PRZ in AUD-NZD


Instrument: AUD-NZD

Main Outlook: Bullish.

Forecast Timeframe: 2 to 3 weeks.


Summary.

The cross is developing a bearish structure that has reached the level of Fibonacci retracement F(61.8) 1.07181, from where we turn on alerts of the possible formation of a reversal pattern that could lead to new highs. Our objective level is 1.1363 and in the longer term the levels 1.17 and finally 1.21. The invalidation level is 1.0222.


Chart