Harmonic Pattern Example: Bearish Shark
The Shark Pattern
The Shark Pattern is the newest harmonic pattern from Carney’s work (2016). He revealed this pattern in his third book in his Harmonic Trading series, Harmonic Trading: Volume Three.
To gain a further understanding of the terminology used in this article, I would strongly encourage everyone to pick up all three of Carney’s books.
The Shark Pattern shares some of the more peculiar conditions that exist on some of the most extreme patterns. For example, both the 5-0 and the Shark Pattern are not typical M-shaped or W-shaped patterns. The Shark Pattern shows up before the 5-0 Pattern. It also shares a specific and precise Fibonacci level that the Deep Crab shares: The 88.6% retracement.
One behavior that might sound abnormal to all other harmonic patterns is that the reaction to the completion of this pattern is very short-lived. I think this is one of the most potent harmonic setups in Carney’s entire work because I am an intraday trader, and this pattern is very much for active traders.
Shark Pattern Elements
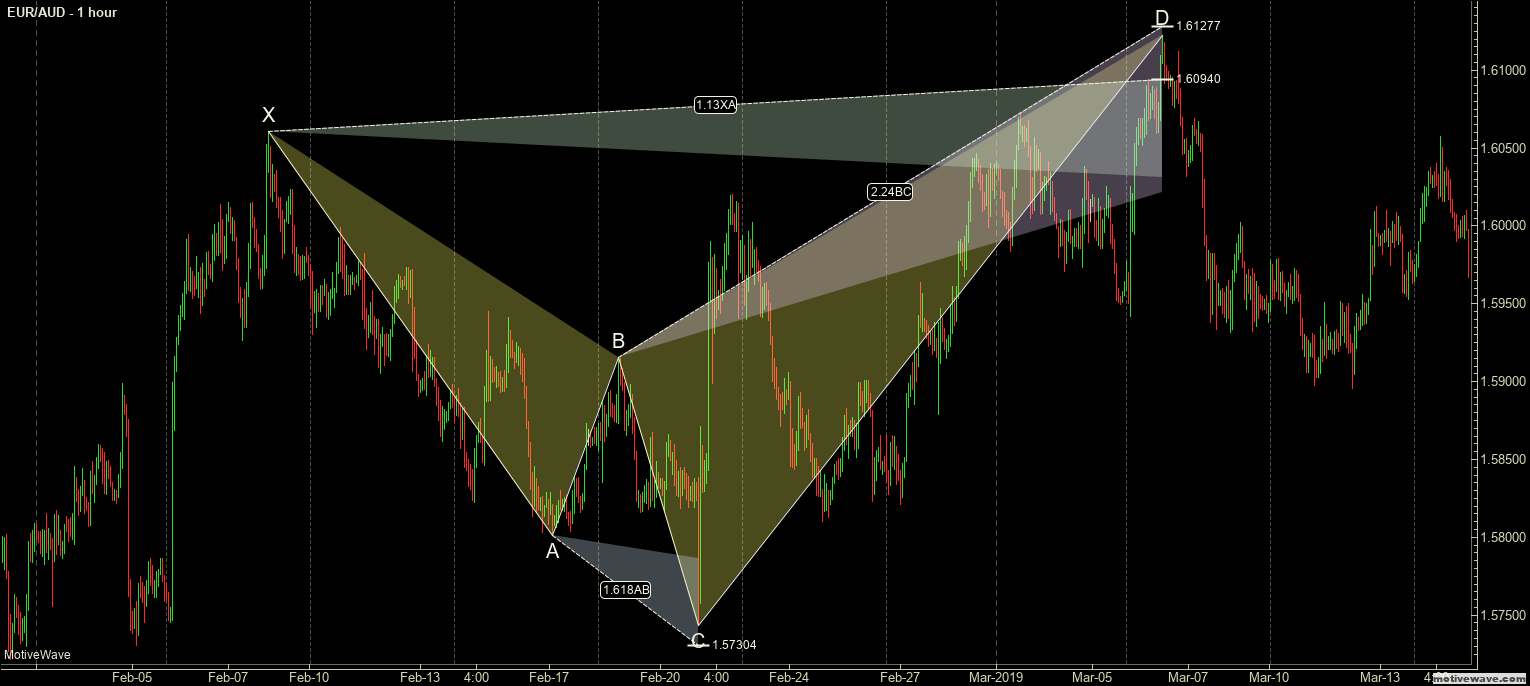
- AB extension of 0X must be at least 113% but not exceed 161.8%.
- BC extends beyond 0 by 113% of X0.
- BC extension of AX must be at least 161.8% but not exceed 224%.
- Because the Shark precedes the 5-0 Pattern, the profit target should be limited to the critical 5-0 Fibonacci level of 50%.
Sources: Carney, S. M. (2010). Harmonic trading. Upper Saddle River, NJ: Financial Times/Prentice Hall. Gilmore, B. T. (2000). Geometry of markets. Greenville, SC: Traders Press. Pesavento, L., & Jouflas, L. (2008). Trade what you see: how to profit from pattern recognition. Hoboken: Wiley.


