Categories
Forex Fundamental Analysis

AUD/JPY Global Macro Analysis: Ranking Impact Factors

The global macro analysis of the AUD/JPY pair focuses on endogenous factors that impact GDP growth in Australia and Japan. We’ll also analyze exogenous factors that determine the exchange rate fluctuation of the AUD/JPY pair.

Ranking Scale

We will rank these factors on a scale from -10 to +10 depending on the severity of their impact.

To determine the rank for endogenous factors, we will conduct a correlation analysis with the GDP growth rate. If the ranking is positive, the endogenous factors have led to an increase in either the AUD or JPY. If the ranking is negative, they have resulted in domestic currencies shedding some of their value.

For exogenous factors, ranking is derived from correlation analysis with the exchange rate of AUD/JPY. If the ranking is negative, the exogenous factor has resulted in a bearish trend for the pair. Conversely, a positive ranking implies the factor resulted in a bullish trend.

AUD Endogenous Analysis

  • Australia Unemployed Persons

As an economic indicator, unemployed persons show the number of the working-age population actively looking for employment. This number is used to show the health of the labor market. It also estimates how well the economy is performing; an expanding economy creates more job opportunities, hence decreasing the number of unemployed persons. Conversely, a deteriorating economy results in job losses, increasing the number of unemployed persons.

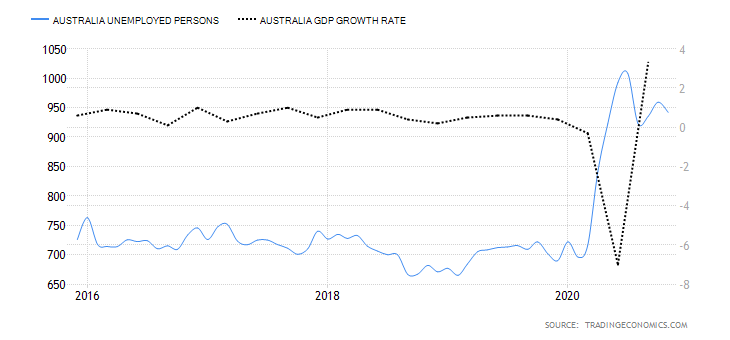
In November 2020, the number of unemployed persons in Australia dropped to 942,100 from 959,400 in October. This number is still higher than the historic average of 639,530 and higher than 722,060 recorded in January. It has a score of -6.

  • Australia Producer Prices Change

This indicator measures the changes in the price of goods that manufacturers sell directly to wholesalers over a particular period. It is a leading indicator of overall inflation since the prices of goods and services from the manufacturers will be passed to the final consumer. Typically, an increase in demand in the market leads to higher prices while a drop in aggregate demand results in lower prices. Thus, changes in producer prices correspond to changes in GDP.

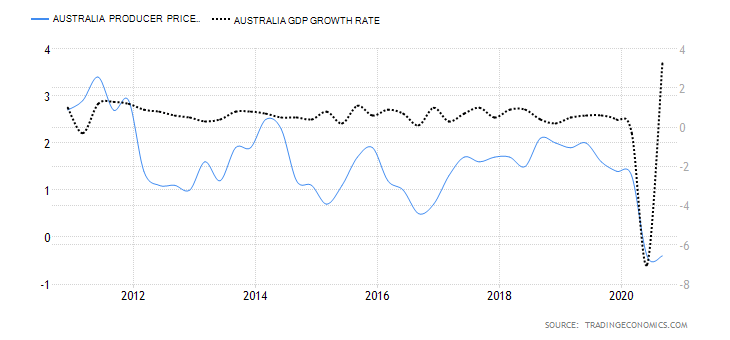
In the third quarter of 2020, the YoY Australia producer price changes dropped by 0.4% same as Q2. In Q1, the index was higher by 1.3%. Thus, we assign a score of -4.

  • Australia Capacity Utilisation

Capacity utilization measures the degree to which a country’s manufacturing and production capabilities are being put to use. It shows the total output being produced vs the maximum potential output produced using the same resources. In Australia, capacity utilization includes companies operating in the industrial sector; which include manufacturing, mining, and utility firms. It is a leading indicator of overall economic growth.

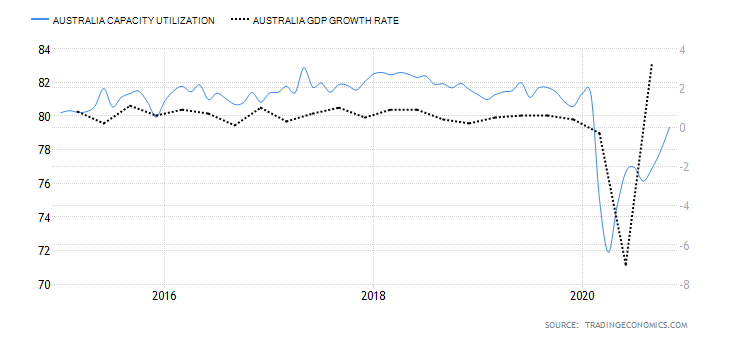
In November 2020, Australian capacity utilization rose to 79.32% from 77.93% in October. This shows that the industrial sector is expanding from the lows of the pandemic. However, the current utilization is still below 81.34% recorded in January. It has a score of -5.

  • Australia Household Saving Ratio

This represents the portion of the disposable income that households do not use to purchase goods and services and transfer payments. Typically, what is not consumed is considered savings. Therefore, when the household saving ratio increases, Australian households are spending less on domestic consumption. Since GDP heavily relies on domestic expenditure, an increase in household savings ratio is a leading indicator of economic contraction.

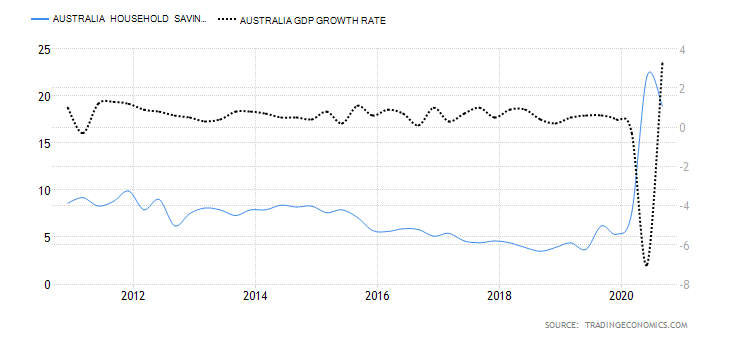
In the third quarter of 2020, Australia’s household saving ratio dropped to 18.9% from historic highs of 22.1% in Q2. Q3 reading is the fourth-highest since 1960. It has a score of -7.

  • Australia House Price Index

In Australia,  the HPI measures the quarterly change in the price of residential property in eight cities. Canberra, Sydney, Brisbane, Hobart, Melbourne, Perth, Adelaide, and Darwin. When the HPI increases, it shows that demand in the real estate market is growing, which corresponds to economic expansion.

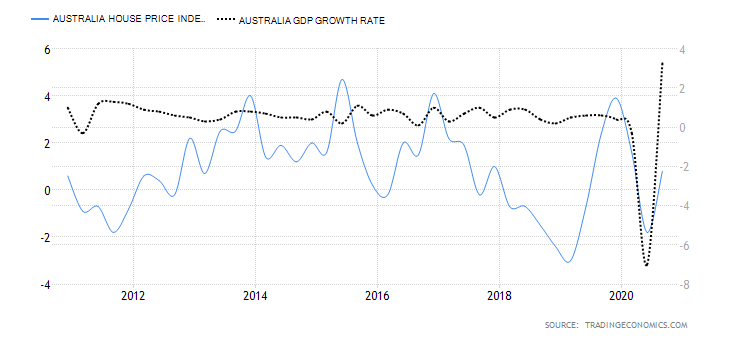
In the third quarter of 2020, HPI in Australia increased by 0.8% from a drop of 1.8% in Q2. The Q3 increase is attributed to the easing of COVID-19 restrictions that stifled the economy in Q2. It has a score of 2.

  • Australia Fiscal Expenditure

This includes the totality of government expenditure on the purchase of goods and services, transfer payments in social security, and investments. It is used in the computation of the total government budget value. Fiscal policy is used to stimulate economic growth. Usually, in times of economic crises, the government increases its fiscal expenditure – mostly on transfer payments. This is meant to cushion households from adverse economic conditions. More so, it increases domestic demand which spurs economic growth.

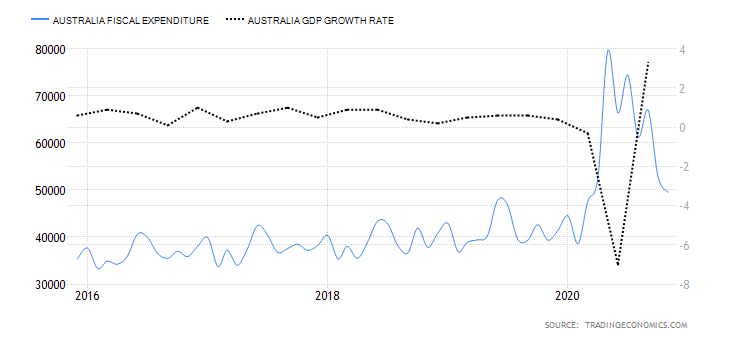
In November 2020, Australia’s fiscal expenditure dropped to 49.504 billion AUD from 50.801 billion AUD in October. In May, Australia’s fiscal expenditure hit historic highs of 79.545 billion AUD. It has a score of 5.

  • Australia Bankruptcies

This shows the number of companies operating in Australia unable to continue with their operations due to the inability to repay their debts. It corresponds to changes in economic conditions and demand for goods and services by households.

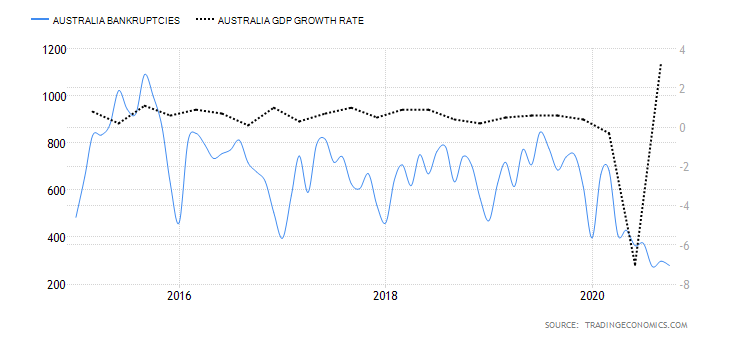
In October 2020, the number of companies that declared bankruptcy in Australia dropped to 279 from 298 in September. There has been a steady decline in Australian bankruptcies since March when it reached yearly highs of 683. It has a score of 3.

Conclusion

Indicator Score Total State Comment
Australia Unemployed Persons -6 10 942100 in November 2020 Above the historic average of 696530. The increase in unemployed persons in 2020 is attributed to economic shocks of COVID-19
Australia Producer Prices Change -4 10 Dropped by 0.4% in Q3 2020 The PPI has dropped in 2020 primarily because of the depressed domestic demand
Australia Capacity Utilisation -5 10 79.32% in November 2020 The industrial sector in Australia is resuming full operations from the pandemic lockdown. The capacity utilisation is still below pre-pandemic levels
Australia Household Saving Ratio -7 10 18.9% in Q3 2020 Q2 reading was the highest in Australian history. Q3 ratio is the fourth highest. This shows that domestic demand was depressed in 2020
Australia House Price Index 2 10 Increased by 0.8% in Q3 2020 An improvement from a drop of 1.8% in Q2. Demand in real estate is picking up after easing of COVID-19 restrictions
Australia Fiscal Expenditure 5 10 49.504 billion AUD in November 2020 2020 was characterised by the unprecedented increase in fiscal expenditure as the government attempted to avert an irreversible recession
Australia Bankruptcies 3 10 279 companies in October 2020 A steady decline in the number of bankruptcy filings since May
TOTAL SCORE -12


JPY Endogenous Analysis

  • Japan Unemployed Persons

This indicator shows the Japanese labour market’s state by analysing the changes in the number of people who are actively seeking employment. It shows the rate at which the domestic economy is creating and shedding jobs. When the number of unemployed increases, it means that the economy is losing more jobs than creating, showing that the economy is contracting; and vice versa.

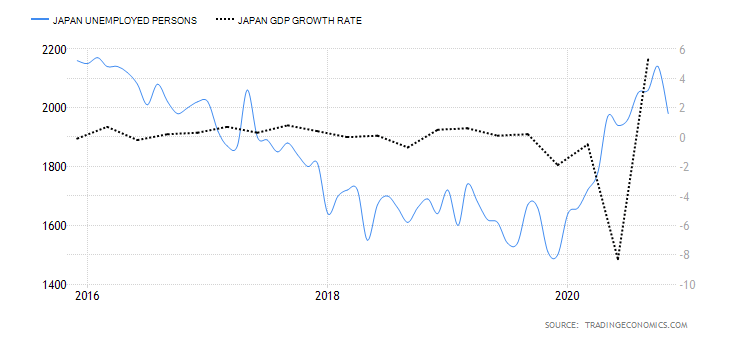
In November 2020, the number of unemployed persons in Japan dropped to 1.98 million from 2.14 million in October. Since January, it has increased by 340,000 is higher than the historic average of 1.67 million. It has a score of -7.

  • Japan Producer Prices Change

The producer price change measures the YoY change in the prices of goods and services sold to the wholesalers directly from the producers. The index covers all sectors in the Japanese economy. Hence it is a leading indicator of the overall inflation in the economy.

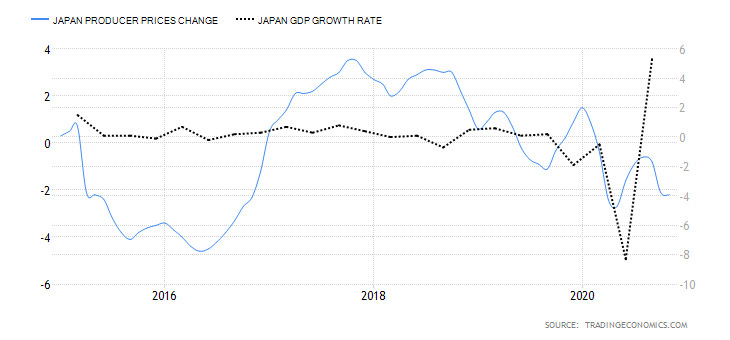
In November 2020, the YoY Japan producer price change dropped by 2.2% down from the 2.1% drop recorded in October. The November drop is attributed to petroleum & coal products. The historic average for the japan producer price change is 1.36%. It has a score of -3.

  • Japan Capacity Utilization

Japan’s economy is heavily dependent on industrial activity. Capacity utilisation shows the percentage of actual output from the industrial sector compared to the maximum capacity. Note that this indicator only measures the relative capacity utilisation based on a benchmark year. When it increases, the industrial sector is expanding with the available resources being put to the most use possible.

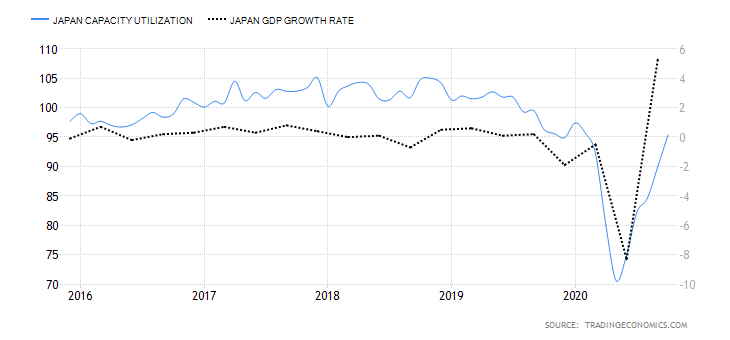
In October 2020, Japan industrial capacity utilisation increased to 95.4% from 90% in September. This is the highest recorded since March. Throughout the year, the capacity utilisation in Japan has been below the historic average of 110.32 points. It has a score of -2.

  • Japan Workers’ Households Ratio of Net Savings and Insurance

This measures the amount of income that households in Japan save in relation to their total disposable income. When the ratio increases, Japanese households are postponing consumption. This is interpreted as expectations that future economic conditions might worsen; hence, households save for a rainy day. In such a case, domestic demand for goods and services is depressed, which means that the GDP drops. Conversely, when the savings ratio decreases, expenditure increases; hence, rise in the GDP.

In October 2020, household saving rate in Japan rose to 29.7% from 19% in September. Due to the economic uncertainties of COVID-19, June 2020 recorded the highest ever personal saving ratio in Japan of 62.1% it has a score of -5.

  • Japan Residential Property Price Index

This tracks the price changes in the Japanese real estate market for residential property, including condominium, land, and detached houses. Note that price in real estate corresponds to changes in the demand. Thus, when demand is high, the residential property index increases, and drops when demand is low.

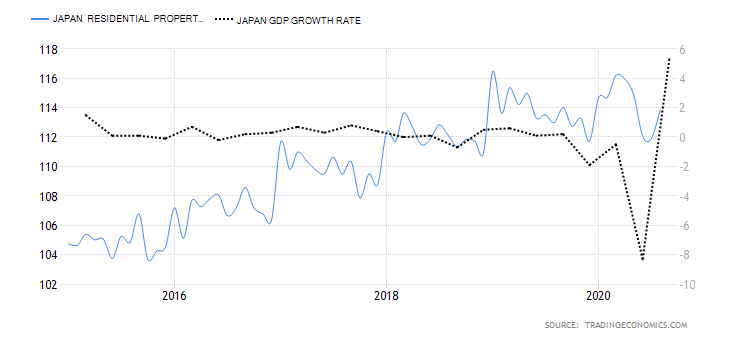
In August 2020, the Housing Index in Japan was 113.86 points up from 111.9 points in July. The August index is higher than the historic average of 104.99 points but lower than January’s 114.66 points. It has a score of -1.

  • Japan Government Spending

Japan government spending shows the amount of money that the Japanese government uses to purchase national goods and services, repayment of government debt, and transfer payments. Whenever the government intends on influencing economic growth, it adjusts the government spending as part of its fiscal policy measure. This involves adjusting budgetary targets, levels of taxes, and expenditure plans. During the coronavirus pandemic, for example, the government increased its national spending, especially in transfer payments. That was meant to shield households from the economic shocks and to stimulate economic growth.

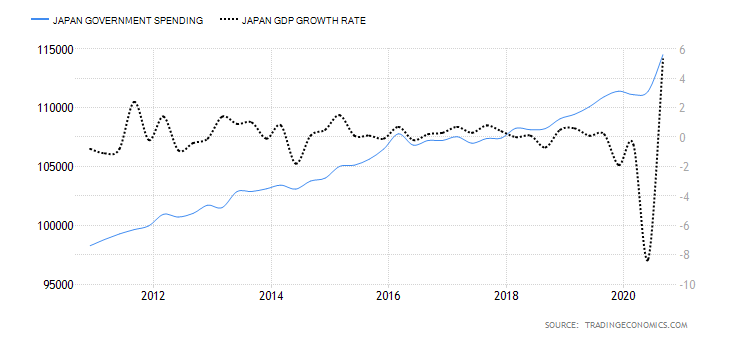
In the third quarter of 2020, Japan government spending rose to 114.509 trillion JPY from 114.404 trillion JPY in Q2. This is the highest government spending in the history of Japan. It has a score of 4.

  • Japan Bankruptcies

Bankruptcies show the monthly change in the number of Japanese businesses unable to service their debt obligations and thus forced to cease operations. As an indicator of the domestic economy, bankruptcies show how well the economy supports businesses in terms of creating and shedding jobs. Naturally, when bankruptcies increase, it correlates with increases in job losses and contraction of the economy.

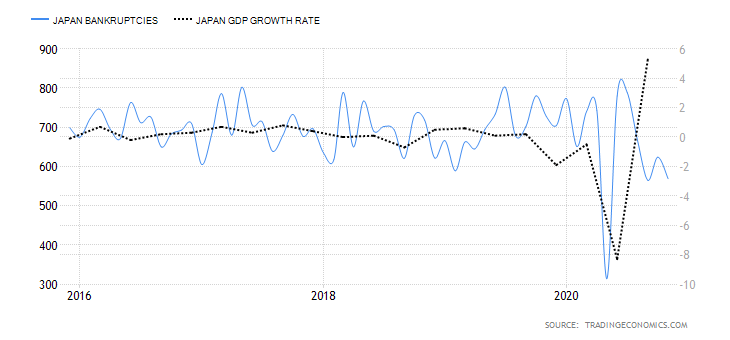
In November 2020, the number of bankruptcies in Japan was 569 down from 624 in October. It has a score of 1.

Conclusion

Indicator Score Total State Comment
Japan Unemployed Persons -7 10 1.98 million in November 2020 Above the historic average of 1.68 million. The Japanese labour market has lost about 340,000 jobs since January
Japan Producer Prices Change -3 10 Down by 2.2% in November 2020 The decrease in PPI mainly attributed to a drop in the price of petroleum and coal products
Japan Capacity Utilisation -2 10 95.4% in October The highest recorded since March. The economy is gradually returning to full operations
Japan Household Saving Ratio -5 10 29.7% in October 2020 The ratio is dropping from historic highs of 62.1% in June. Shows domestic demand is picking up
Japan House Price Index -1 10 113.86 points in August 2020 The HPI is higher than the historic average of 104.99 points; but lower than pre-pandemic levels
Japan Fiscal Expenditure 4 10 114.509 billion JPY in Q3 2020 The highest in Japan’s history
Japan Bankruptcies 1 10 569 companies in November 2020 Bankruptcy filings drop as COVID-19 restrictions ease
TOTAL SCORE -13


AUD/JPY Exogenous Analysis

  • Australia and Japan Terms of Trade Differential

A country’s TOT shows the ratio between the value of exports and the value of its imports. It represents the units of exports that can purchase a unit of imports. Therefore, when a country has a current account deficit, its terms of trade is less than 100%. If it has a current account surplus, its TOT is more than 100%.

In this case, the differential between Australia and Japan’s terms of trade is the difference between Australia’s terms of trade and Japan’s. When this differential is positive, it means that Australia has a higher current account balance than Japan. Consequently, implying that the AUD is in higher demand in the international market than the JPY, hence a bullish AUD/JPY. Conversely, the differential is negative when Japan has higher TOT than Australia, resulting in a bearish AUD/JPY.

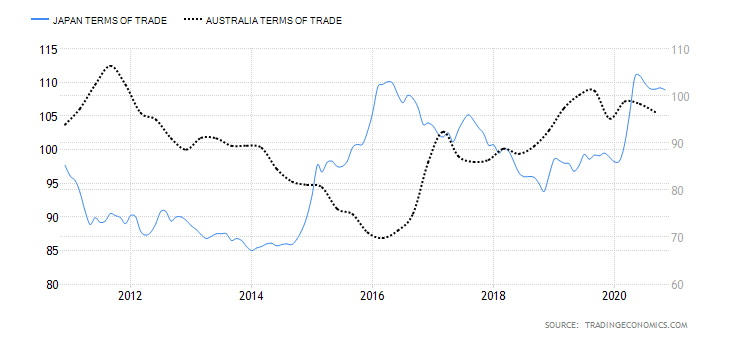
Between January and October 2020, Australia TOT averaged at 97.9% while that of Japan at 106.43%. The terms of trade differential between Australia and Japan is -8.53%. It has a score of -3.

  • Annual GDP Growth Rate Differential between Australia and Japan

Annual GDP growth rate measures if a country’s economy is expanding, contracting, or stagnating. It tracks the change in GDP growth at a particular period over the preceding year. By measuring the annual GDP growth rate differential, we can effectively compare economic growth in Australia and Japan since both economies have different compositions, making absolute comparison ineffective. The differential is positive when the Australian economy is expanding faster or contracting slower than the Japanese economy. In this case, the AUD/JPY pair will be bullish, and vice versa.

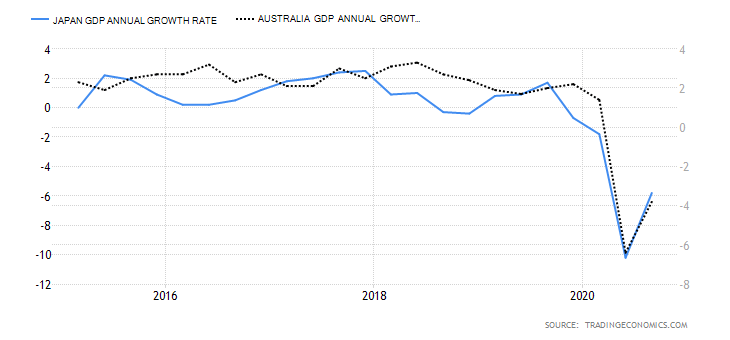
In the first three quarters of 2020, Australia’s annual GDP growth rate was -8.8%, and that in Japan is -17.8%. The differential is 9%, and thus, has a score of 6.

The AUD/JPY pair’s interest rate differential shows whether the pair is bound to be bullish or bearish in the long term. If positive, then Australia has a higher interest rate than Japan which means that traders and investors would earn higher returns by selling the JPY and buying the AUD’ hence, a bullish AUD/JPY. When Japan has a higher interest rate, traders will earn higher returns by selling AUD and buying JPY; hence, a bearish AUD/JPY.

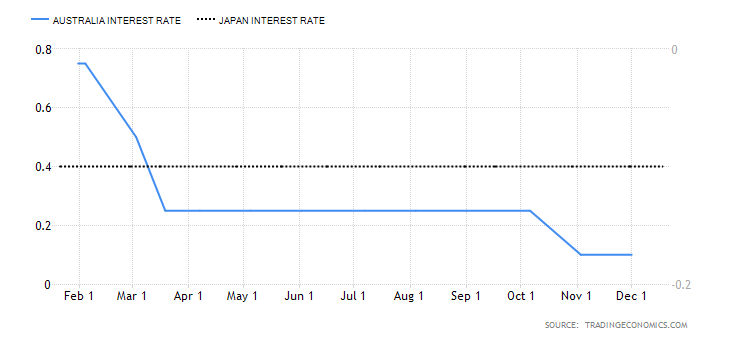
In 2020, the RBA cut interest rates from 0.75% to 0.1% while the BOJ maintained interest rate at -0.1%. Thus, the AUD/JPY interest rate differential is 0.2% and has a score of 3.

Conclusion

Indicator Score Total State Comment
Australia and Japan Terms of Trade Differential -3 10 A differential of -8.53% Japan has better terms of trade than Australia
Annual GDP Growth Rate Differential between Australia and Japan 6 10 9.00% Japanese economy contracted faster than that of Australia. This might change as economies open up
The AUD/JPY interest rate differential 3 10 0.20% The BOJ has no prospects pf changing the -0.1% interest rate. The differential is expected to change with changes in RBA’s interest rate policies
TOTAL SCORE 6


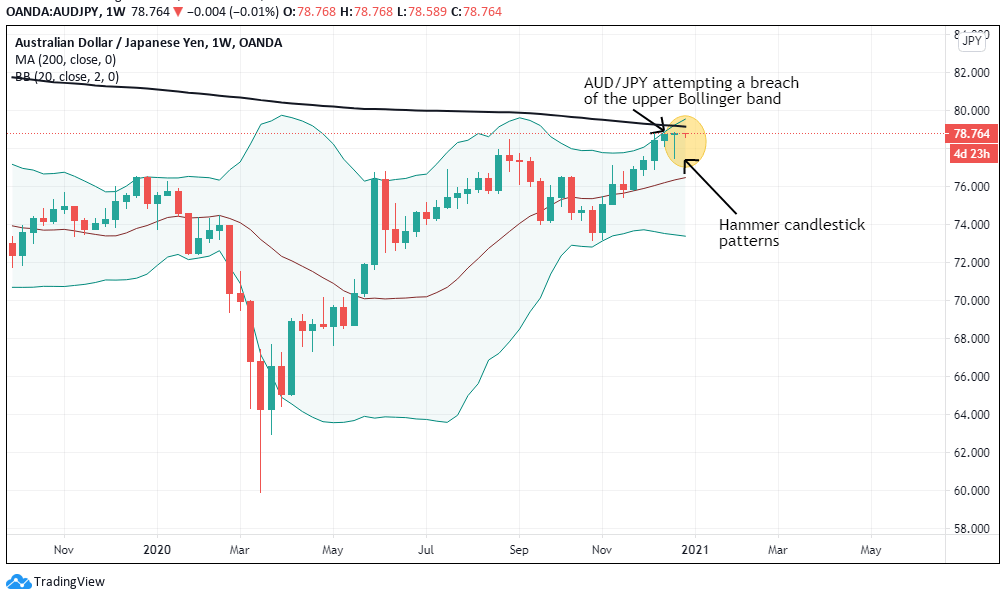
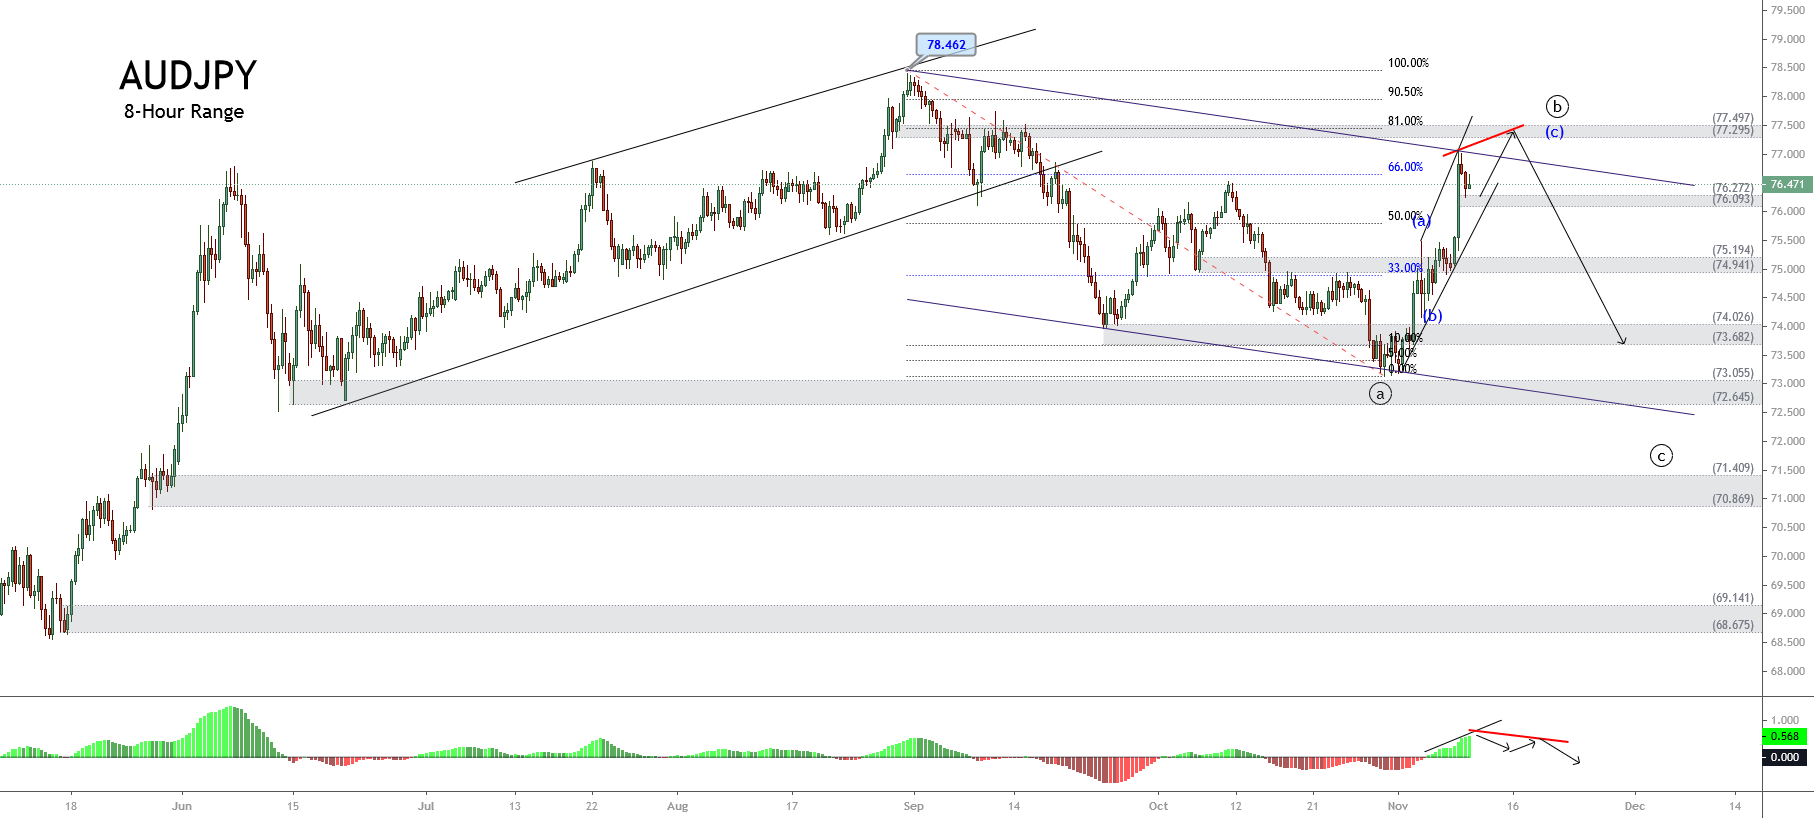
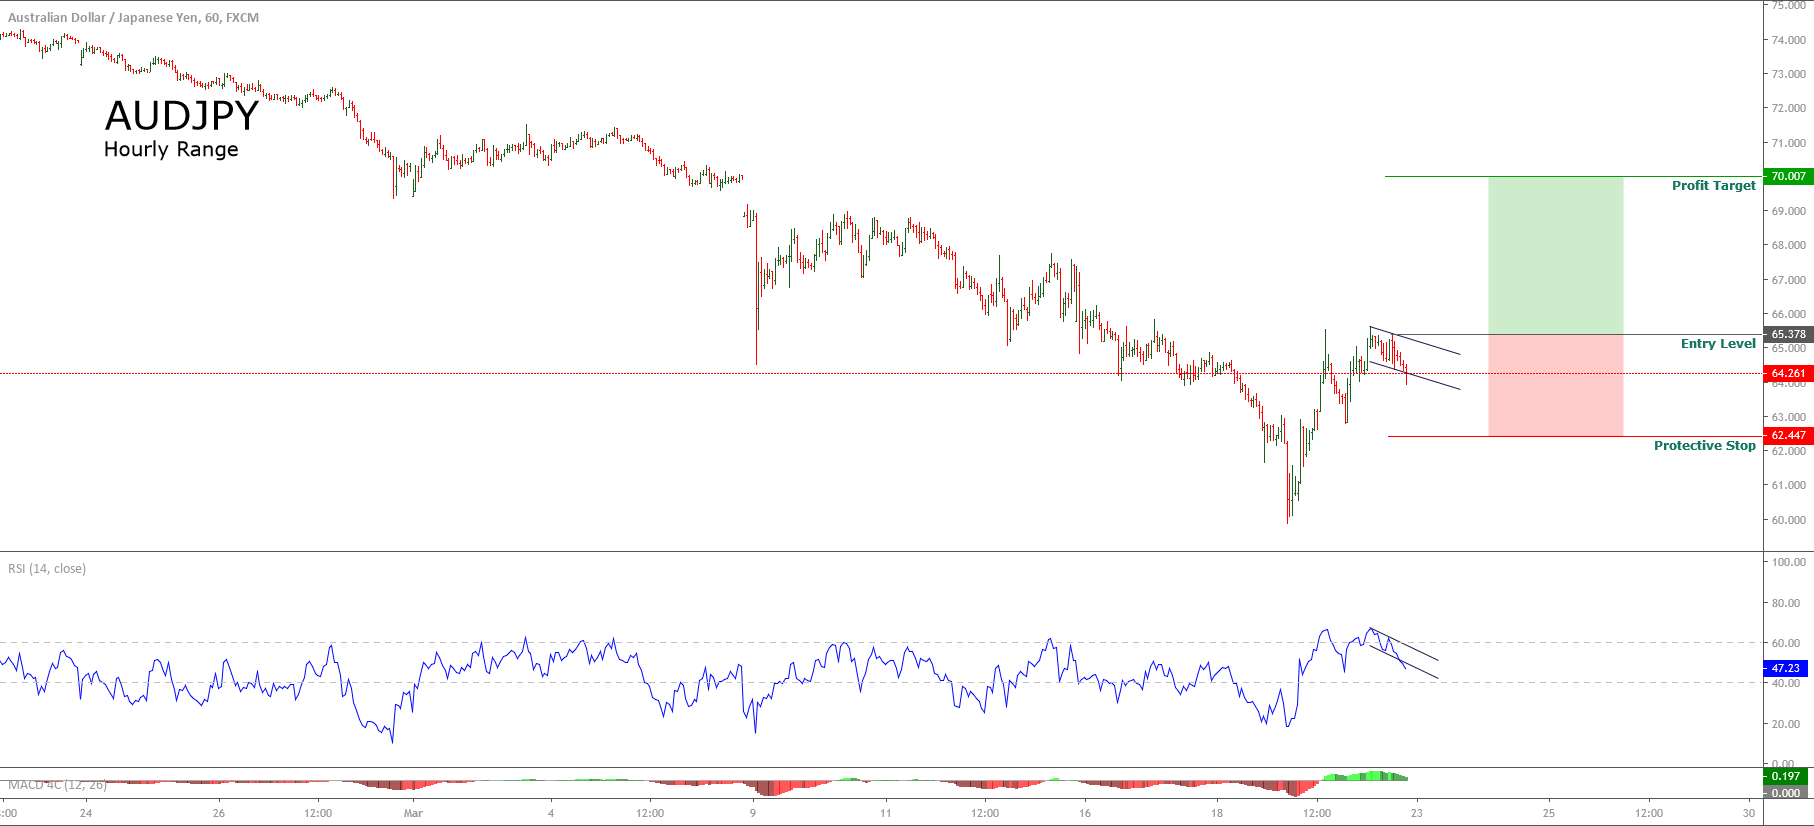
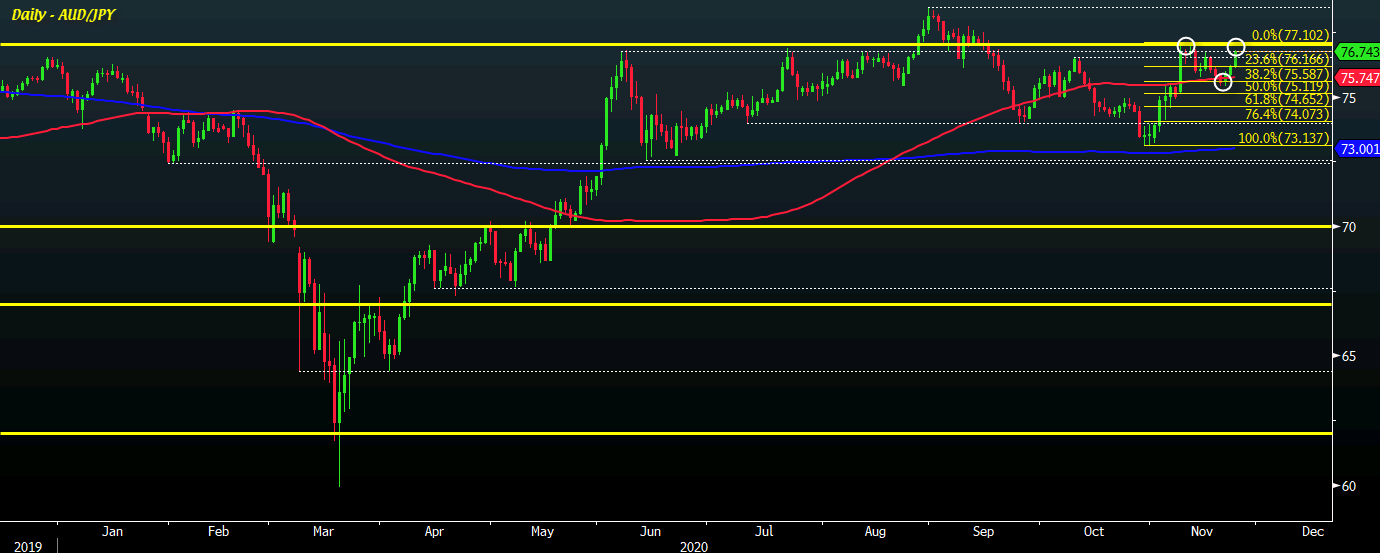
The exogenous factors have a score of 6 which means the AUD/JPY pair can be expected to continue trading in a bullish trend. Technical analysis of the pair’s weekly price chart shows it is attempting to breach the upper Bollinger band. More so, the pair has formed ‘hammer’ candlesticks showing that bears have failed to push the price lower.

Categories
Forex Signals

AUDJPY: Breakout after Consolidation

The AUDJPY pair has moved in a bullish sequence that started in the end week of October and ended with a sharp and large 4H candle on Nov 09. There it began a consolidation cycle that started as a sideways move and finally retraced pushed by the selling pressure to near the begging of the last bullish 4H Candle. From there, it is making an upward movement that is supported by its 50-period SMA.

Chart 1 – AUDJPY 4H Chart.

We see that the primary trend is still bullish. The 1H chart also shows the recent leg of upward movements with higher highs and lows (which define a bullish trend). We also observe that following the last bullish candlestick, there are several consolidation candles that retrace, but the closes are not trespassing the 50-hour SMA. Now, we see the strength is coming again, and the Voss Predictor indicator also shows a trend shift that could forecast a visit to the highs made in the recent past.

Chart 2 – AUDJPY 1H Chart.

The setup

Although we suspect that a new upward phase is just beginning, the setup also considers a confirmation in the form of a breakout of the recent range; thus, the entry signal is a buy-stop order at 76.324, with a 31 pip stop-loss that would trigger if the price goes below the low of the last 1H bullish candle (76.014). The take-profit level is set at 76.774, which is in the region of the last highs. The reward/risk ratio is a decent 1.45.

Trade Summary

Entry: Buy-Stop: 76.324

Stop-Loss: 76.014

Take-Profit: 76.774

Risk and Reward

This trade’s risk is 31 pips, which is 296 USD per traded lot, 29.6 USD per mini-lot, and 2.96 USD per lot. A trader willing to risk 1 percent on each trade should trade about 3 micro-lots every $1,000 on his trading account.


Categories
Forex Elliott Wave Forex Market Analysis

AUDJPY Could Develop a Limited Upside

Overview 

The AUDJPY cross advances in an incomplete upward sequence that belongs to a corrective structural series backed by Monday’s trading session’s euphoric sentiment. The Elliott Wave view unveils the likelihood of a limited upside before resuming its declines.

Market Sentiment

The AUDJPY cross retraces on the overnight Tuesday trading session after the surprising weekly kick-off, which jumped the price over 2.2%, climbing until 77.037, its highest level since September 18th.

The AUDJPY 8-hour chart illustrates the 30-day high and low range, which exposes the participants’ intraday market sentiment. The figure distinguishes the price action consolidating in the extreme bullish sentiment zone, backed by the stock market’s euphoric rally on Monday’s trading session.

The breakout of the last 30-day high of 76.274 during Monday’s trading session raised the participants’ extreme bullish sentiment, expecting further upsides on the cross. Moreover, we see that the price action remains above its 60-period linear weighted moving average, which confirms the bullish bias on the AUDJPY.

Nevertheless, the AUDJPY found resistance below mid-September’s consolidation zone. This market context expects a significative retracement or a consolidation movement before continuing the rally experienced in Monday’s session. Finally, a retracement below the 75.087 level would turn the market sentiment from bullish to bearish.

Technical Overview

The AUDJPY cross advances in an incomplete upward bullish sequence of a lower degree, which belongs to a descending structure that began on August 31st when the price topped on 78.462.

The below 8-hour chart exposes the price action running in an upward wave ((b)) of Minute degree labeled in black, which currently advances its fourth wave of Minuette degree identified in blue. Likewise, according to the Dow Theory, considering that the AUDJPY cross advanced over 66% of the bearish decline, the price should develop a bearish connector corresponding to wave ((b)).

In this context, following the Elliott Wave theory and considering the third internal segment of the intraday rally, the price could produce a limited upside toward the supply zone bounded between 77.295 and 77.497. Finally, the bearish divergence on the MACD oscillator may mean a confirmation of the upward movement’s exhaustion corresponding to wave ((b)).

Short-Term Technical Outlook 

The incomplete bullish sequence of the AUDJPY cross unfolded in its 4-hour chart exposes the progress in its fourth wave of Subminuette degree labeled in green. Likewise, considering that the third wave is the extended wave of wave (c), the fifth wave in green should not be extended.

On the other hand, considering that the second wave in green is a simple correction, the fourth wave should elapse more time than the second wave. Additionally, the fifth wave in green could extend itself between 77.140 and 77.654. The price could find fresh sellers expecting to open their shorts on the bearish side of wave ((c)) of Minute degree labeled in black. The invalidation level of the bearish scenario locates at 78.462. 


Categories
Forex Signals

AUDJPY Breakout Retest BUY

Categories
Forex Signals

AUDJPY Advances in an Ascending Wedge

Description

The AUDJPY cross, in its 8-hour chart, shows the price action advancing in an ascending wedge pattern, which suggests the bearish continuation of the previous bearish trend.

Until now, the Oceanic cross completed four waves of Subminuette degree identified in green. For the following trading sessions, we expect a limited upside, which could develop a thrust as a false breakout completing the ascending wedge pattern.

Our conservative scenario considers a sell-side position if the price breaks and closes below the last low at 69.941. The potential bearish target locates at the end of wave iv in green at 67.680.

The bearish scenario will be invalid if the price soars and closes above 71.460.

Chart

Trading Plan Summary

Categories
Forex Market Analysis Forex Signals

AUDJPY Bounces from the Lowest Level Since 2009

The AUDJPY cross, in its hourly chart, shows the bounce reaction that the price made once the cross touched level 59.869 being the lowest level since early March 2009.

The bearish momentum accelerated aided by the plummetting of the global stock markets, worried by the COVID-19 impact, which pulled down the Australian Dollar and pushed up to the Japanese Yen.

The measure that was taken by the RBA at its last monetary policy meeting, in which it reduced the interest rate to 0.5%, prompted the Australian currency to rise and bounce off from the lows reached.

The pierce of the psychological support at level 60, drove the pair to jump more than 400 pips. At the same time, the RSI oscillator began to move above level 60, which makes us suspect that traders’ market sentiment is changing its bearish bias to bullish.

A bullish position will activate if AUDJPY rises and closes above 65.378. If this movement occurs, the cross could advance until level 70. Our protective stop locates at 62.44.

Finally, if the price action doesn’t confirm the bullish breakout, the bearish bias will continue driving the market sentiment.

Chart

Trading Plan Summary

  • Entry Level: 65.378
  • Protective Stop: 62.447
  • Profit Target: 70.007
Categories
Forex Market Analysis

Daily Market Update: EU Data Remains Stable, PBoC Efforts to Support Yuan


 News Commentary


European data was still steady even after sentiment remained cautious with flash services PMI data easing slightly with 54.4, less than expected of 55.0. Meanwhile flash manufacturing PMI came positive with 55.1, more than expected of 54.7.


The Japanese yen cut most of its gains frustrating expectations about the Bank of Japan starting a fresh round of stimulus at its scheduled policy meeting next week.

Japan’s central bank is discussing changes to its interest-rate targets and stock-buying techniques, sending bond yields and the yen rocketing higher on Monday.


Risk appetite was mostly stable across markets after Beijing vowed to pursue a more ‘vigorous’ financial policy, stepping up efforts to support growth among growing economic struggle conditions.


 Chart Analysis


US INDEX

On the daily chart, the price has bounced from the red resistance zone for the third time to shape the reversal triple top.

Price has recently formed another reversal pattern to assure the bearish bias with the wedge.

Followed by a break beneath an ascending trend on RSI, the index is settled down at the ascending trend line, if it’s broken, the price will move its way back to the support zone 93.2-92.6.


USD/JPY

The pair had broken before the key level at 111.3 along with a descending trend line from the high of 2015, to reach the resistance of 113.15 to then bounce from there as a retracement.

Now, the price is located at a good long-buy position according to;- the support of 111.3, the retest of the broken descending trend, 23.6% Fibonacci level and the ascending channel.

All these factors may boost the price further to go back to the level 113.15 and more if the price witnesses a suitable price action from these levels.


AUD/USD

On the daily chart, the pair reached back the green support zone again to shape a double top pattern.

Followed by divergence on RSI, our bullish view is still the same: if the price manages to stay above the support area and the key level 0.7455, it will be heading towards the combination of levels of descending trend, ascending channel and resistance zone at 0.7655-0.774.


NZD/USD

On the daily chart, the price retested the green support zone 0.675-0.6695, followed by divergence in RSI.

An AB=CD harmonic pattern has been shaped to reinforce the bounce.

If the price could break above the key level at 0.6845, the price will be supposed to head back to the top of the descending channel with the resistance zone at 0.697-0.703 only if it manages to hold above the green zone.


AUD/JPY

On the daily chart, as we expected, the price has bounced from the red resistance zone at 83.9-85.95 with an engulfing bar.

The price is expected to continue its reversal to keep going in its sideways movement to the support zone 81.2-80.5.


CHF/JPY

On the daily chart, as we expected, the price has bounced according to the key levels that the price has recently reached the resistance zone at 112.85-113.05, reversal wedge, moving average 200 and 50% Fibonacci.

Followed by AB=CD harmonic pattern, if the price could break beneath the key level 111.9, the price is expected to go down to 111.9 then 110.3.


Categories
Forex Market Analysis

Daily Market Update: Trump Comments on Rate Hikes, Japan & Canada CPI


News Commentary


The dollar reversed against the currency basket on Thursday after U.S. President Trump said he was “not happy” about the Federal Reserve rate hikes but the downside was limited amid optimism over the U.S. economy.

“I’m not happy about it,” President Donald Trump said about interest-rate increases during an interview with CNBC Thursday, claiming that “higher rates put the United States at a disadvantage.” Trump insisted, but, he also sees that “Fed do what they feel is best.”

However, Powell earlier this week said gradual interest rate hikes would be “the best way forward” for the economy, citing stronger labour markets, and inflation that had met the Fed’s 2% objective.


The US and China are continuing a full-blown trade war. The People’s Bank of China (PBOC) is increasingly favouring a weaker Yuan after setting the Yuan reference rate at 6.7671 versus previous day’s fix of 6.7066.


The Japanese Yen started Friday’s trading session slightly affected by the release of local inflation data. June’s national CPI was 0.7%, lower than forecasts of 0.8% and in line with May’s result. However, the Yen may rise as trade war tensions may increase risk aversion.


All eyes will be on Canadian CPI at 12:30 GMT with a forecast of 0.1% such as with June’s reading. Traders will follow the result to get any conclusion about soon rates hike.


 Chart Analysis


US INDEX

On the daily chart, the price has bounced from the red resistance zone for the third time to shape the reversal triple top.

The price has recently formed another reversal pattern to assure the bearish bias with the wedge.

Followed by a break beneath an ascending trend on RSI, the index is supposed to move its way back to the support zone of 93.2-92.6.


AUD/USD

On the daily chart, the pair went back to the green support zone again to shape a double top pattern.

Followed by divergence in RSI, our bullish view is still the same: if the price manages to still be above the support area, it will be heading towards the combination of levels of the descending trend, ascending channel and resistance zone at 0.7655-0.774.


NZD/USD

On the daily chart, the price retested the green support zone 0.675-0.6695, followed by divergence in RSI.

An AB=CD harmonic pattern has been shaped to reinforce the bounce.

The price is supposed to head back to the top of the descending channel with the resistance zone at 0.697-0.703, but only if it manages to hold above the green zone.


AUD/JPY

On the daily chart, as we expected, the price has bounced from the red resistance zone at 83.9-85.95 with engulfing bar.

The price is expected to continue its reverse to keep going in its sideways movement to the support zone 81.2-80.5.


CHF/JPY

On the daily chart, it’s obvious to recognise by the key levels that the price has recently reached the resistance zone at 112.85-113.05, reversal wedge, moving average 200 and 50% Fibonacci.

Followed by AB=CD harmonic pattern, the price is expected to go down to 111.9 then 110.3


Categories
Forex Market Analysis

Daily Market Update: Upbeat Data From Australia, UK CPI, Powell Set To Be Hawkish Again


 News Commentary


Fed Chairman Jerome Powell supported the Dollar by bullish comments, which affirmed expectations about the central bank’s possible interest rate moves this year.

In Congressional testimony on Tuesday and Wednesday, Powell said he believed the United States was in steady growth for years, and carefully played down the risks to the U.S. economy of an escalating trade conflict.

U.S. President Donald Trump’s top economic advisor, Larry Kudlow, said that he believed Chinese President Xi Jinping has blocked any progress on a deal to end the duelling in U.S. and Chinese tariffs.

“China could end U.S. tariffs by providing a more satisfactory approach” and “taking steps that other countries are also calling for”, Kudlow said.


The U.K. was pulled down yesterday on weak inflation data, with the CPI reading 2.4%, less than the expectation of 2.6%, causing market expectations for a BoE August rate hike to ease slightly from 77% to 68%


Earlier, the Australian economy added 50.9K jobs in June, better than the estimated forecast of 16.7K
More importantly, the full-time jobs rose by 41.2 K following a 20.6K drop registered in May. Meanwhile, the jobless rate came in at a seasonally adjusted rate of 5.4% as expected.


 Chart Analysis


US INDEX

On the daily chart, the price has returned to the red resistance zone with shaping before the reversal double top.

The price has formed another reversal pattern to assure the bearish bias with the wedge.

Followed by a break beneath an ascending trend on RSI, the index is supposed to make its way back to the support zone 93.2-92.6


AUD/USD

On the daily chart, the pair bounced back from the resistance 0.7455 to retest the green support zone again.

Followed by divergence on RSI, our bullish view is still the same: Heading towards the combination of levels of descending trend, ascending channel and resistance zone at 0.7655-0.774.


NZD/USD

On the daily chart, the price retested the green support zone 0.682-0.6775, followed by divergence in RSI.

An AB=CD harmonic pattern has been shaped to reinforce the bounce.

The price is supposed to head back to the top of the descending channel with the resistance zone at 0.697-0.703.


USD/CAD

On the daily chart, the price reached the support of 1.3085 with the ascending trend line from the low of April.

On the other hand, the price has shaped a GARTLEY harmonic pattern with a reversal wedge, bouncing from the 78.6% Fibonacci level, followed by a divergence in RSI.

So, If the price breaks above the resistance 1.3225, it would head back to 1.34.

If it breaks beneath the wedge and the support of 1.3085, it would head back to 1.289.


AUD/JPY

On the daily chart, as we expected before, the price has reached the red resistance zone at 83.9-85.95.

It’s a crucial area that if the price bounces back from, it will continue its sideways movement to the support zone 81.2-80.5.

If the price breaks above it, it will head new levels to the next resistance zone 85.5-85.95.


Categories
Forex Market Analysis

Daily Market Update: Fed Chair Powel To Testify, New Zealand CPI


 News Commentary


The dollar eased on Tuesday due to congressional testimony by Federal Reserve Chairman Jerome Powell which traders will examine for clues on the pace of U.S. interest rate rises and risks emanating from trade conflicts.

Powell will testify on the economy and monetary policy before the U.S. Senate Banking Committee at 14:00 GMT

He is expected to deliver an optimistic message on the outlook for growth and reassure the FED’s gradual monetary tightening policy but could face tough questions on how the FED would deal with an escalation in the global trade war.

Powell is supposed to begin two days of testimony on the economy and monetary policy later Tuesday when he appears before the U.S. Senate Banking Committee in Washington.


The NZ Q2 CPI data arrived at 0.4%, slightly lower than the 0.5% expected. The year on year data arrived as 1.5 % vs the expected 1.6%

Also, the UK average earning index came in as expected at 2.5%, the unemployment rate was stable with previous reading at 4.2%


 Chart Analysis


US INDEX

On the daily chart, the price has returned to the red resistance zone with shaping before the reversal double top.

The price has formed another reversal pattern to assure the bearish bias with the wedge.

Followed by a break beneath an ascending trend on RSI, the index is supposed to have its way back to the support zone 93.2-92.6.


AUD/USD

On the daily chart, the pair bounced back from the resistance 0.7455, to retest the green support zone again.

Followed by divergence on RSI, our bullish view is still the same: Heading towards the combination of levels of descending trend, ascending channel and resistance zone at 0.7655-0.774.


NZD/USD

On the daily chart, the price retested the green support zone 0.682-0.6775, followed by divergence in RSI.

An AB=CD harmonic pattern has been shaped to reinforce the bounce.

The price is supposed to head back to the top of the descending channel with the resistance zone at 0.697-0.703.


AUD/JPY

On the daily chart, as we expected before, the price has reached the red resistance zone at 83.9-85.95.

It’s a crucial area that if the price bounces back from, it will continue its sideways movement to the support zone 81.2-80.5.

If the price breaks above it, it will head new levels to the next resistance zone 85.5-85.95.


Categories
Forex Market Analysis

Daily Market Update: NFP Report, Brexit View


News Commentary


The dollar was heading up three-week lows against a currency basket after the latest U.S. jobs report on Friday showed wages grew less than expectation in June with 0.2% (forecast was 0.3%), even as the economy created more jobs than expected with 213K (forecast was 195K).

The average hourly earnings pointed to sustain inflation pressures that hold expectations back for a fourth rate hike by the Federal Reserve this year.


Brexit secretary David Davis resigned unexpectedly last night, to send a blow to Prime Minister Theresa May, as she struggles to end conflicts among her ministers who felt her plan to press for the closest possible trading ties with the European Union had betrayed their desire for a clean break with the bloc.

The pound had fallen responding to the following the reports, before having another turnaround amid indications that May would not face major trouble against her Brexit policy and hopes that a softer Brexit may be on the cards moving forward.


The Euro was boosted after data showing that German exports rose by more than imports in May, indicating that the euro area’s largest economy remains solid despite global trade tensions.


Chart Analysis


USD INDEX

As we expected on the daily chart, the price had bounced from the key resistance at 95.5, powered by divergence on RSI and a break beneath an ascending trend line.

The price also had shaped a reversal double top pattern.

So, the index is supposed to get back down to the support zone again of 93.2-92.6.


USD/JPY

On the daily chart, the pair retested the key resistance of 111.1 again and the descending trend from the high of 2017 to shape a double top reversal pattern.
So, the price is expected to assure the next bearish move that leads the price to the support zone of 108.65-108.15.


AUD/USD

On the daily chart, as we expected, the price has reversed from the support zone of 0.7325-0.7365.

The pair is supposed to go on in its bullish momentum powered by divergence on RSI to reach the key resistance of 0.758, where the descending trend from the high of February is located.


AUD/JPY

As we expected before, the price has reached and bounced from the support zone 81.2-80.5 as the price is moving sideways.

So, the price is expected to retest the head of the pattern to again reach the levels of 84-84.4.


CAD/JPY

On the 4 hour chart, we can see a break above the descending wedge along with shaping a head & shoulders pattern.

A GARTLEY harmonic pattern has enhanced the bullish bias before 84.35.

Watch the neckline of the H&S which is located at the mentioned resistance (84.35) with moving average 200 too.

A break above these levels would take the price up to the key resistance 87.


Categories
Forex Market Analysis

Daily Market Update: Trade Tariffs Begin, FOMC Meeting, NFP Data


News Commentary


The trade conflict between the US and China has just been put into action today when U.S. tariffs on $34 billion worth of Chinese goods went into effect at 04:00 GMT. An additional tariffs on another $16 billion is expected to take place in the upcoming two weeks. Meanwhile U.S. President Donald Trump has given instructions to identify a further $300 billion on possible Chinese goods.

China has also vowed to reply with tariffs on $34 billion of American goods. Beijing had previously said it would impose tariffs on U.S. agricultural products, crude imports, and vehicle products.


Yesterday, Federal Reserve policymakers enhanced the view of further increases in interest rates as the U.S. economic growth continued “above trend”.

“Participants generally expected that further gradual increases in the target range for the federal funds rate would be consistent with the solid expansion of economic activity, strong labour market conditions, and inflation near the Committee’s symmetric 2 per cent objective over the medium term,” the Fed said in the minutes.

The Fed’s statement to continue tightening monetary policy was boosted by a continued rally in inflation and a solid labour market, despite concerns about the impact of rising trade tensions on spending and business sentiment.


Today’s big data will be at 12:30 GMT with NFP. The expectation goes for 195K, less than the previous reading 223K

Also keep an eye on average hourly earnings, which is expected to remain the same as the last reading with 0.3%


 Chart Analysis


USD INDEX

As we expected on the daily chart, the price had reached the key resistance at 95.5 and bounced back from it, powered by divergence on RSI.

The price also had shaped a reversal double top pattern.

So, the index is supposed to get back down to the support zone of 93.2-92.6 again, then start its journey to the C wave.


USD/JPY

On the daily chart, the pair retested the key resistance of 111.1 again and the descending trend from the high of 2017 to shape a double top reversal pattern.
So, the price is expected to assure the next bearish move that leads the price to the support zone of 108.65-108.15.


AUD/USD

On the daily chart, the price has reached the support zone of 0.7325-0.7365.

The pair is supposed to find some breath powered by divergence on RSI to reach the key resistance of 0.7515, where the descending trend from the high of February is located.


AUD/JPY

As we expected before, the price has reached the support zone 81.2-80.5 as the price is moving sideways.

So, the price is expected to retest the head of the pattern to reach the levels of 84-84.4 again.


CAD/JPY

On the 4 hour chart, we can see a break above the descending wedge along with shaping head & shoulders pattern.

A GARTLEY harmonic pattern has enhanced the bullish bias before 84.35.

Watch the neckline of the H&S which is located at the mentioned resistance (84.35) with moving average 200 too.

A break above these levels would take the price up to the key resistance 87.


Categories
Forex Market Analysis

Daily Market Update: FOMC Meeting, Friday Deadline Of Tariffs, German Industrial Bounces


News Commentary


US President Trump has restated his call for OPEC to bring down the price of gasoline. He recently asked Saudi Arabia to increase production after he imposed Iran with sanctions reducing Iran’s production by up to 1.1M barrels per day. An Iranian Republican Guard Commander has said that Iran would block the Strait of Hormuz if the US stops Iranian oil sales.

Investors are still cautious ahead of Friday’s deadline for the U.S. to impose a 25% tariff on $34 billion worth of Chinese imports, which Beijing has pledged to match with a levy on U.S. products.


The Fed will release minutes of its June meeting today, with investors looking for clues on whether it is still on track to raise interest rates twice more this year

Most economists expect that the FED will persist in raising the rates at its own pace.

“Every FED official but one projects the central bank will get rates above 3% by 2020”, said Michael Hanson, head of global macro strategy at TD Securities.

Seth Carpenter, chief U.S. economist at UBS, agreed. He said it would take “a major surprise” to keep the FED from pushing interest rates up at a steady pace.


On other hand, some ECB members seemed to be troubled about the slow pace of rates hikes, saying that a Sept/Oct 2019 hike is too late. In response, the probability of a September rate hike has risen from 69% to 80%.

German industrial orders bounced back in May with higher than expected results after four consecutive monthly drops, as demand from domestic customers and the rest of the Eurozone picked up.


 Chart Analysis


USD INDEX

As we expected on the daily chart, the price had reached the key resistance at 95.5 and bounced back from it, powered by divergence on RSI.

The price also had shaped a reversal double top pattern.

So, the index is supposed to get back down to the support zone of 93.2-92.6 again, then start its journey to the C wave.


USD/JPY

On the daily chart, the pair retested the key resistance of 111.1 again and the descending trend from the high of 2017 to shape a double top reversal pattern.
So, the price is expected to assure the next bearish move that leads it to the support zone of 108.65-108.15.


AUD/USD

On the daily chart, the price has reached the support zone of 0.7325-0.7365.

The pair is supposed to find some breath powered by divergence on RSI to reach the key resistance of 0.7515, where the descending trend from the high of February is located.


AUD/JPY

As we expected before, the price has reached the support zone 81.2-80.5 as the price is moving sideways.

So, the price is expected to retest the head of the pattern to again reach the levels of 84-84.4.


Categories
Forex Market Analysis

Daily Market Update: PBOC To Hold Rates, Positive Data For AUD & GBP


News Commentary


The Dollar fell against the rest of the currency basket on Wednesday as trade slowed ahead of the U.S. Independence Day holiday, as concerns over trade tensions remain the top issue.

Investors remained worried ahead of Friday’s deadline for the U.S. to impose a 25% tariff on Chinese imports, which Beijing has declared to match with a another response on U.S. products.

U.S. President Donald Trump is insisting on plans to harm major trading partners, including the European Union, Mexico and Canada as part of his ‘America First’ policy that many investors fear will hit global growth.


On the other hand, China’s central bank has warranted to keep the exchange rate “basically stable,” in an attempt to calm markets which have been on fire by fears over the escalating trade hassle between Washington and Beijing.


The Australian dollar was boosted overnight after data showing that retail sales rose by a higher than expected 0.4% in May, beating forecasts for the second straight month.


Great Britain services PMI grew to 55.1 to exceed expectations and the last reading which was at 54.0.

Services PMI is considered a substantial factor to Sterling as it represents 80% of the total Gross Domestic Product (GDP), which has risen to 0.2% with a hike in manufacturing & construction, 54.4 & 53.1 respectively.

This data enhances the hawkish outlook for the BoE to raise the rate in August.


 Chart Analysis


USD INDEX

As we expected on the daily chart, the price had reached the key resistance at 95.5 and bounced back from it, powered by divergence on RSI.

The price had also shaped a reversal double top pattern.

So, the index is supposed to get back down to the support zone of 93.2-92.6 again, then start its journey to the C wave.


USD/JPY

On the daily chart, the pair retested the key resistance of 111.1 again and the descending trend from the high of 2017 to shape a double top reversal pattern.
So, the price is expected to assure the next bearish move that leads the price to the support zone of 108.65-108.15.


AUD/USD

On the daily chart, the price has reached the support zone of 0.7325-0.7365.

The pair is supposed to find some breath powered by divergence on RSI to reach the key resistance of 0.7515, where the descending trend from the high of February is located.


AUD/JPY

As we expected before, the price has reached the support zone 81.2-80.5 as the price is moving sideways.

So, the price is expected to retest the head of the pattern to reach the levels of 84-84.4 again.


Categories
Forex Market Analysis

Daily Market Update: RBA Remains Rates On Hold, German Politics Eased


News Commentary


Trade tensions remain on fire as the U.S. government has blocked China Mobile from offering services to the U.S. telecommunications market, recommending its application be declined.

“We urge the relevant side in the United States to abandon Cold War thinking and zero-sum games.” Said the Chinese foreign ministry spokesman Lu Kang

That move by U.S. President Donald Trump’s administration comes amid growing trade tensions between the two countries. The U.S. is probably set to impose tariffs on $34 billion worth of goods from China on Friday, which Beijing is expected to respond to with tariffs of its own, to remain in a tit for tat circle.


The euro has been supported as political risk in Germany calmed, after Chancellor Angela Merkel reached a deal on immigration policy with coalition partners, resolving a row that had put into doubt the future of the government.


The Reserve Bank of Australia left interest rates steady at 1.5%. The statement had come to a rather neutral to dovish tone as it declared inflation is likely to remain slow for some time, wage growth also remained slow and household consumption remains a source of uncertainty.

The statement came similar to the June statement with main data remaining the same as well as the tone.


Trading is expected to be thin ahead of the U.S. independence day holiday, with markets closing early at 17:00 GMT.


Chart Analysis


USD INDEX

As we expected on the daily chart, the price had reached the key resistance at 95.5 and bounced back from it, powered by divergence on RSI.

The price also had shaped a reversal double top pattern.

So, the index is supposed to get back down to the support zone of 93.2-92.6 again, then start its journey to the C wave.


USD/JPY

On the daily chart, the pair retested the key resistance 111.1 again and the descending trend from the high of 2017.

So, any bounce here will lead the price to the first support of 108.15.


AUD/USD

On the daily chart, the price has reached the support zone of 0.7325-0.7365

The pair is supposed to find some breath powered by divergence on RSI to reach the key resistance of 0.7515, where the descending trend from the high of February is located.


AUD/JPY

As we expected before, the price has reached the support zone 81.2-80.5 as the price is moving sideways.

So, the price is expected to retest the head of the pattern to again reach the levels of 84-84.4.


CAD/JPY

On the daily chart, as we expected, the price has risen from the support of 81.15, near the green support zone.

The pair bounces with two engulfing bars from the 78.6% Fibonacci level.

A Gartley harmonic pattern has been shaped at these same levels, with an oversold area on RSI.

All these factors enhance the continuation of bullish movement to reach firstly the resistance at 85.5, then the retest at 86.95


Categories
Forex Market Analysis

Daily Market Update: EU To Impose Tariffs On US, Great Britain Higher Manufacturing PMI


 News Commentary


The European Union has threatened to impose new tariffs worth $300 billion if the U.S. moves forward with tariffs on European cars.

President Donald Trump, who has criticised the EU of its trade surplus with the U.S. before, and for its higher import duties on cars, said last week that the government was completing its study and suggested the U.S. would take action soon.

The latest update in the global trade war comes on Friday when the U.S. moved to impose $34 billion of tariffs on Chinese exports. China is expected to respond with tariffs of its own on U.S. goods.


The Euro had been boosted on Friday after the European Union’s leaders reached a deal on migration, easing pressure on Merkel. However, the Euro came under pressure after Germany’s interior minister asked to resign over immigration policy, throwing into doubt the future of Angela Merkel’s coalition government.


In the UK, British factories kept up a steady growth in June but worries about global trade and Brexit still hit confidence about the outlook to a seven-month low.

But the better than expected Manufacturing PMI (54.4 versus forecast at 54.1) will provide additional optimism for the hawkish members on the committee to raise the rates.

All eyes will be on US manufacturing PMI which is expected to reach 58.2.


Chart Analysis


USD INDEX

As we expected on the daily chart, the price had reached the key resistance at 95.5 and bounced back from it, powered by divergence on RSI.

The price also had shaped a reversal double top pattern.

So, the index is supposed to get back down to the support zone again of 93.2-92.6, then start its journey to the C wave.


USD/JPY

On the daily chart, the pair retested the key resistance of 111.1 and the descending trend from the high of 2017.

So, any bounce here will lead the price to the first support of 108.15.


AUD/USD

On the daily chart, the price has reached the support zone of 0.7325-0.7365.

The pair is supposed to find some breath powered by divergence on RSI to reach the key resistance of 0.7515, where the descending trend from the high of February is located.


AUD/JPY

As we expected before, the price has reached the support zone 81.2-80.5 as the price is moving sideways.

So, the price is expected to retest the head of the pattern to again reach the levels of 84-84.4.


CAD/JPY

On the daily chart, as we expected, the price has risen from the support of 81.15, near the green support zone.

The pair bounces with two engulfing bars from the 78.6% Fibonacci level.

A Gartley harmonic pattern has been shaped at these same levels, with an oversold area on RSI.

All these factors enhance the continuation of bullish movement to reach first the resistance at 85.5, then the retest at 86.95.


Categories
Forex Market Analysis

Daily Market Update: RBNZ Left Interest Rates At 1.75%, BoC Governor Poloz Speech


News Commentary


Uncertainty remained after White House economic adviser Larry Kudlow told Fox Business Network later on Wednesday that Trump’s announced plan did not indicate a softened stance on China.

However, there are still tit-for-tat battles which are affecting the markets.


The Reserve Bank of New Zealand (RBNZ) maintained the Official Cash Rate (OCR) at 1.75%and has been forecasting no changes until late next year.

According to Governor Adrian Orr, inflation is likely to increase in the near term due to higher fuel prices. Beyond that, it is expected to gradually rise to the 2% annual target, resulting from capacity pressures.


The Bank of Canada Governor, Stephen Poloz, stated that the impact of the US trade fight and tighter mortgage rules will “figure prominently” in the Central Bank’s July’s interest rate decision.

He also approved market reactions to May data, flagging the hanging situation on NAFTA, but also kept an optimistic sentiment.


Chart Analysis


AUD/USD

On the daily chart, the price has reached the support zone of 0.7325-0.7365.

The pair is supposed to find some breath powered by divergence on RSI to reach the key resistance of 0.7515, where the descending trend from the high of February is located.


USD/CAD

As we expected before, the price has reached the key resistance level of 1.334.

As we can see, the price has reversed from a very strong selling area according to many factors, including key resistance level, 78.6% Fibonacci, the upper level of the reversal wedge, forming the Gartley harmonic pattern, and overbought in RSI.

So, any bounce there will lead the price down to the support zone at 1.309-1.299.


AUD/JPY

As we expected before, the price has reached the support zone 81.2-80.5 as the price is moving sideways.

So, the price is expected to retest the head of the pattern to again reach the levels 84-84.4.


Categories
Forex Market Analysis

Daily Market Update: RBNZ to Announce Official Cash Rate, Low ANZ Business Confidence


News Commentary


Trade tensions still weigh on the markets to cut the traders appetite to risk, to boost the safe havens like the Yen and the Swiss Franc.

However, following the trade adviser Peter Navarro, Trump signalled he may take a less confrontational approach, and that any measures would not just target China, to calm down concerns about the administration’s plans to hit Chinese investment in U.S. tech.


Jonathan Haskel, the Bank of England policymaker said there may be more slack in the UK economy, which would weaken the case for interest rate hikes.

He added that the central bank has scope to cut rates slightly in case of an economic downturn.


Disappointing data came from New Zealand after low ANZ business confidence index came in at -39. The last reading was -27.2.

A big move is awaiting for the NZD as the RBNZ will announce its official cash rate at 09:00 GMT. They are widely expected to not change the rate, to remain stable at 1.75%.

All eyes will be on rate statement with any clue to possible rate hike soon, any dovish sentiment will put more pressure on the currency.


Chart Analysis


USD INDEX

As we expected on the daily chart, the price had reached the key resistance at 95.5 and bounced back from it, powered by divergence on RSI.

The price also had shaped a reversal double top pattern.

So, the index is supposed to get back down to the support zone again of 93.2-92.6, then start its journey to the C wave.


AUD/USD

On the daily chart, the price has reached the support zone of 0.7325-0.7365.

The pair is supposed to find some breath powered by divergence on RSI to reach the key resistance of 0.7515, where the descending trend from the high of February is located.


USD/JPY

On the daily chart, as we expected, the pair bounced from the descending trend from the high of 2017 and the key resistance of 111.1.

As you can see on the chart, the price is moving according to Elliot waves. By forming the A & B waves, we are waiting for the next move down to hit the C level which is located at the support of 106.9 and also to meet the ascending trend from the low of 2016.

So, a possible bounce has started and on its way.


USD/CAD

As we expected before, the price has reached the key resistance level of 1.334.

As we can see the price has reversed from very strong selling area according to many factors, including key resistance level, 78.6% Fibonacci, the upper level of the reversal wedge, forming the Gartley harmonic pattern, and overbought in RSI.

So, the price is expected to go down to the support zone at 1.309-1.299.


NZD/USD

On the daily chart, the price has reached the crucial support zone of 0.682-0.6785, with bearish momentum.

Followed by divergence, if we see a price action there, then the price is expected to get back up again to retest the resistance zone at 0.698-0.703.

If the price breaks this zone, we could see a 0.667 level.


AUD/JPY

As we expected before, the price has reached the support zone 81.2-80.5 as the price is moving sideways.

So, the price is expected to retest the head of the pattern to again reach the levels of 84-84.4.


Categories
Forex Market Analysis

Weekly Market Update: Trade War Tensions, BoE Kept Interest Rates at Same Level, RBNZ to Announce Its Official Cash Rate

It has been a busy week for news, looking forward to seeing much volatility this week according to the consequences of the releases last week and the upcoming week’s data


News Commentary


USD

Tensions between the U.S. and China continue, as the two largest economies in the world faced a tit-for-tat over trade tariffs. Earlier this week, U.S. President Donald Trump threatened to impose tariffs on another $200 billion of Chinese goods. China could strike back at blue-chip firms including Caterpillar and Boeing who rely on China for revenue.

The dollar also eased following the release of soft U.S. manufacturing data which came in at 19.9, lower than the expected 28.9.

But demand for the dollar continued to be boosted after Federal Reserve Chairman Jerome Powell reiterated on Wednesday that the case for gradual rate hikes remains strong.

All eyes will be on Tuesday’s CB consumer confidence which is expected to reach 127.6, and Core Durable Goods Orders on Wednesday which is expected to reach 0.5%, and most importantly, the final GDP on Thursday with a forecast of 2.2%, same as the last one.


EUR

The European Union imposed tariffs on about $3.4 billion of U.S. imports on Friday, including motorcycles, orange juice and cranberry sauce. The tariffs have added to tensions as investors fear an outright global trade war between the U.S.and other major countries.

On the other hand, French and German business activity in June came in higher than expected, easing concerns of a slowdown in the Eurozone.
Good news for Greece is that the Eurozone creditors finally agreed a debt relief deal that will help Greece exit its bailout program.
Following late-night talks in Luxembourg, the Eurogroup agreed to hand Greece a final loan tranche of €15 billion.


GBP

The Pound strengthened after the Bank of England left interest rates steady, but the vote for a rate hike by the bank’s chief economist came with a surprise that supported the probability for the next hike in the August meeting.

The MPC voted 6-3 to hold rates flat, but the fact that there were three dissenting votes cast in favour of a rate hike today was a bit more hawkish than what was expected

All eyes will be on the current account on Friday with an expectation of -18.2B


NZD

New Zealand GDP growth dropped by 0.1% compared to the previous two quarters, coming in at just 0.5%, lower than the previous reading of 0.6%.

It’s a busy week for the New Zealand dollar with ANZ business confidence, which measures economic health with the last reading of -27.2.

The big event will be the official cash rate on Wednesday with the expectation to be left steady at 1.75%.


CAD

Disappointing inflation and retail sales from Canada damaged the loonie lower across the board, sending the odds of a July BoC rate hike to 55% from 68% earlier in the week. Meanwhile the odds of an August BoE hike rise to 70%.

All eyes will be on GDP on Friday with the last reading of 0.3%.


Chart Analysis


USD INDEX

As we expected on the daily chart, the price had reached the key resistance at 95.5 and bounced back from it, powered by divergence on RSI & B wave (Elliot waves).

So, the index is supposed to get back down again to the support zone 93.2-92.6, then start its journey to the C wave.


AUD/USD

On the daily chart, the price has reached the support of 0.7325, with a pin bar candle followed by engulfing one.

The pair is supposed to find some breath powered by divergence on RSI to reach the key resistance of 0.7515, where the descending trend from the high of February is located.


USD/JPY

On the daily chart, as we expected, the pair had broken the ascending channel followed by bouncing from the descending trend from the high of 2017 and the key resistance of 111.1.

The price also broke the support of 110.05 to reach the next support 108.15, to then get back up again from this level to retest the level at 110.05.

As you can see on the chart, the price is moving according to Elliot waves. By forming the A & B waves, we are waiting for the next move down to hit the C level which is located at the support of 106 and also to meet the ascending trend from the low of 2016.

So, a bounce has started and on its way.


AUD/NZD

On the daily chart, as we expected before, the price had made its way up to targets at the resistance zone of 1.0815-1.0865, boosted by a BAT harmonic pattern.

The price has already made its retracement as we expected it to.

Reaching the support zone and shaping the Gartley harmonic pattern, the price is supposed to continue its bullish movement up to the 1.1045 level after forming hammer & engulfing candles respectively.


USD/CAD

As we expected before, the price has reached the key resistance level of 1.334

As we can see the price is located at very strong selling area according to many factors, including key resistance level, 78.6% Fibonacci, the upper level of the reversal wedge, forming the Gartley harmonic pattern, and overbought in RSI.

So, any bounce there will lead the price down to the support zone at 1.309-1.299.


NZD/USD

On the daily chart, the price has reached a combination of support levels, with a support zone of 0.682-0.6785, an ascending trend line from the low of 2007, and finally with Bat harmonic pattern.

The price is expected to get back up again to retest the resistance zone at 0.698-0.703.


AUD/JPY

As we expected before, the price has reached the support zone 81.2-80.5 as the price is moving sideways.

So, with this engulfing candle, we expect the price to retest the head of the pattern to again reach the levels 84-84.4.


Categories
Forex Market Analysis

Daily Market Update: Trade Tensions Continue, OPEC Meeting


News Commentary


Tensions between the U.S. and its allies continue, as India joined China and the European Union in retaliation against steel and aluminium tariffs. As the biggest buyer of almonds, India raised its tariff on U.S. almonds by 20%

The European Union imposed tariffs on about $3.4 billion of U.S. imports on Friday, including motorcycles, orange juice and cranberry sauce. The tariffs have added to tensions as investors fear an outright global trade war between the U.S.and other major countries.

On the other hand, French and German business activity in June came in higher than expected, easing concerns of a slowdown in the Eurozone.
Good news for Greece is that the Eurozone creditors finally agreed a debt relief deal that will help Greece exit its bailout program.
Following late-night talks in Luxembourg, the Eurogroup agreed to hand Greece a final loan tranche of €15 billion.

The Organisation of the Petroleum Exporting Countries (OPEC) is gathering in Vienna amid calls from the United States, China and India to cool down the price of crude and prevent an oil deficit that would hurt the global economy.

Saudi Arabia and non-OPEC Russia have said a production increase of about 1 million barrels per day (bpd) or around 1 per cent of global supply had become a near-consensus proposal for the group and its allies.

Although a final decision may not arrive until Saturday when OPEC officials are scheduled to meet with their non-member allies who formed part of the 18-month accord to curb production by 1.8 million barrels per day.


Chart Analysis


NZD/USD

On the daily chart, the price has reached a combination of support levels, with a support zone of 0.682-0.6785, an ascending trend line from the low of 2007, and finally with a BAT harmonic pattern.

The price is expected to get back up again to retest the resistance zone at 0.698-0.703.


AUD/JPY

As we expected before, the price has reached the support zone 81.2-80.5 as it is moving sideways now.

So, with this engulfing candle, we expect the price to retest the head of the pattern to reach the levels of 84-84.4 again.


USD/JPY

On the daily chart, as we expected the pair had broken the ascending channel followed by bouncing from the descending trend from the high of 2017 and the key resistance of 111.1.

The price also broke the support of 110.05 to reach the next support 108.15, to then get back up again from this level to retest the level at 110.05.

As you can see on the chart, the price is moving according to Elliot waves. By forming the A & B waves, we are waiting for the next move down to hit the C level which is located at the support of 106 and also to meet the ascending trend from the low of 2016.

So, a bounce has started and on its way.


AUD/NZD

On the daily chart, as we expected before, the price had made its way up to targets at the resistance zone 1.0815-1.0865, boosted by a BAT harmonic pattern.

The price has already made its retracement as we expected it to.

Reaching the support zone and shaping the Gartley harmonic pattern, the price is supposed to continue its bullish movement up to the 1.1045 level after forming hammer & engulfing candles respectively.


USD/CAD

As we expected before, the price has reached the key resistance level 1.334.

As we can see the price is located at very strong selling area according to;- key resistance level, 78.6% Fibonacci, the upper level of the reversal wedge, forming the “Gartley” harmonic pattern, and overbought in RSI.

So, any bounce there will lead the price down to the support zone at 1.309-1.299.


Categories
Forex Market Analysis

Daily Market Update: US tariffs on China and its Consequences


News Commentary


Investors are reacting negatively to the escalating trade war between China and the US, and if the tit-for-tat tariffs continue, the euro could continue to head south. The US announced a 25 per cent tariff on $50 billion of Chinese goods on Friday. After China responded with an identical move on US imports, President Trump has now threatened to impose 10 per cent tariffs on some $200 billion in Chinese goods. Not surprisingly, China has threatened to retaliate to this latest move. Trump has vowed to take action on the $375 billion trade deficit that the US has with China, claiming that the latter is guilty of unfair trade practices. With the first of the US tariffs scheduled to take effect on July 6 and no signs that any side will blink first, the markets should be preparing for stormy weather ahead.

After the speech from ECB President Mario Draghi, in the eurozone, the current account surplus narrowed for a third straight month, dropping to EUR 28.4 billion. This fell short of the estimate of EUR 30.3 billion.

The US building permits have released with a decrease of 1.3M, lower than expectation 1.35M


Chart Analysis


US INDEX

As expected, After breaking the reversal pattern ‘wedge’, the price met the broken ascending trend from the high of 2017, meeting the broken ascending channel, heading the B level of the ABC Elliot waves. Divergence on RSI followed by breaking the upper line as shown.

According to Elliot, we can see a spike from that level to 97.9.


USD/JPY

On the daily chart, as we expected the pair had broken the ascending channel followed by bouncing from the descending trend from the high of 2017 and the key resistance of 111.1.

The price also broke the support of 110.05 to reach the next support 108.15, to then get back up again from this level to retest the level at 110.05.

As you can see on the chart, the price is moving according to Elliot waves. By forming the A & B waves, we are waiting for the next move down to hit the C level which is located at the support of 106 and also to meet the ascending trend from the low of 2016.

So, a bounce has started and on its way.


USD/CAD

On the daily chart, the price eventually broke the resistance zone of 1.309-1.299, followed by a break of the ascending trend line from the high of 2016, with an engulfing candle.

As we expected that, we need another confirmation bullish candle to assure the long bias, the price is expected to reach 1.34.


AUD/JPY

As we expected, the pair had formed a wedge which had been broken to reach the support zone 81.2-80.5, to make the price ranges in sideways between 80.5 & 84.4.

The price is about to have a bearish bias according to:

bouncing from the resistance zone 84.4-93.9, breaking continuous ‘flag’ patterns, bouncing from the moving average 200, and ABC Elliot waves

So, the price is expected to head for 76.25.


AUD/USD

As we expected, the price will have a strong bearish rally to the support of 0.7155 and this has been prepared according to five causes;-

the descending trend line from the high of February, breaking of the flag, the resistance zone, and eventually the B level of the ABC Elliott waves, and most importantly the break beneath the key support 0.7415.

So, the C wave is on its way after a possible retracement to the 0.7155 level


Categories
Forex Market Analysis

Daily Market Update: US tariffs, Divergence Between Central Banks


 News Commentary


Tariffs between the United States and China raised fears that an escalating trade war could weigh on global markets.

U.S. President Donald Trump announced tariffs on Friday on $50 billion of Chinese imports, with China retaliating immediately by slapping duties on American exports, which pushed the Yen higher as the safe haven flows away.

Oil prices dropped before OPEC meeting on Friday.

Investors are also estimating the impact of tightening monetary policy by central banks after the U.S. Federal Reserve increased the interest rate last week and the European Central Bank said it planned to end its bond-purchase program at the year-end.

This divergence between the two banks pushed the dollar higher in front of the whole basket of currencies.


Chart Analysis


US INDEX

After breaking the reversal pattern ‘wedge’, the price met the broken ascending trend from the high of 2017, meeting the broken ascending channel, heading the B level of the ABC Elliot waves. Divergence on RSI followed by breaking the upper line as shown.

According to Elliot, we can see a spike from that level to 97.9.


USD/JPY

On the daily chart, the pair had broken the ascending channel followed by bouncing from the descending trend from the high of 2017 and the key resistance of 111.1.

The price also broke the support of 110.05 to reach the next support 108.15, to then get back up again from this level to retest the level at 110.05.

As you can see on the chart, the price is moving according to Elliot waves. By forming the A & B waves, we are waiting for the next move down to hit the C level which is located at the support of 106 and also to meet the ascending trend from the low of 2016.

So, a bounce is expected to be on its way.


USD/CAD

On the daily chart, the price eventually broke the resistance zone of 1.309-1.299, followed by break the ascending trend line from the high of 2016, with an engulfing candle.

But we can also see that it touches the top of the “horn” & “wedge” patterns.

So, we only need another confirmation bullish candle to assure the long bias to reach 1.334.


AUD/JPY

As we expected, the pair had formed a wedge which had been broken to reach the support zone 81.2-80.5, to make the price ranges in sideways between 80.5 & 84.4.

The price is about to have a bearish bias according to:

bouncing from the resistance zone 84.4-93.9, forming continuous ‘flag’ patterns, bouncing from the moving average 200, and ABC Elliot waves

So, the price is expected to head for 76.25.


AUD/USD

As we expected, the price will have a strong bearish rally to the support of 0.7155 and this has been prepared according to five causes;-

the descending trend line from the high of February, breaking of the flag, the resistance zone, and eventually the B level of the ABC Elliott waves

so, the C wave is on its way after a possible retracement


Categories
Forex Market Analysis

Weekly Market Update: ECB Left Interest Rate, US-China Trade War, Great Britain Official Bank Rate

We had a busy last week with announcements from central banks (FED & ECB), also there was the conflict at the G7 summit, the consequences of Singapore summit.

So, we will discuss the upcoming results from all this data, along with the most important releases of the next week.


News Commentary


USD

The FED delivered the widely expected rate hike overnight, with a hawkish statement and economic projections. FOMC raised the Fed funds to 2.00%.

The Trump administration has slapped a 25% tariff on 818 Chinese goods, with a total value of up to $50B.

This action comes on top of the recent decision to impose steel and aluminium tariffs on many US allies, including Canada, Mexico and the European Union. Predictably, those countries countered with $20B in tariffs on US goods.

U.S. President Donald Trump and North Korean leader Kim Jong Un signed a ‘comprehensive’ deal at a historic summit aimed at the denuclearisation of the Korean peninsula.

Trump said the meeting in Singapore had gone “better than anybody could have expected” and he anticipated that the denuclearisation process would start “very, very quickly”, adding he had formed a “special bond” with Kim and the relationship with North Korea would be very different.


EUR

The regulator plans to complete the quantitative easing program in December 2018. The Central Bank left interest rates unchanged and said that it is not going to raise them until mid-2019. The speech by Mario Draghi, President of the European Central Bank, also hit the euro. The official said that the slowdown in the economic recovery in the Eurozone was not temporary, but also reached a global level. The ECB lowered the forecast for economic growth in the Eurozone from 2.4% to 2.1% this year.


GBP

Positive data came from Great Britain to enhance the sterling, with the retail sales reading 1.3%, higher than the expected 0.5%.

On Thursday the Bank of England is expected to leave all monetary policy levers untouched and the market will then look for clues on future moves from the MPC voting pattern and the subsequent press release. Governor Carney may also give his thoughts on UK Q2 GDP after this week’s data looks likely to weigh on second-quarter growth.


AUD

The Australian Dollar was trading as the weakest currency last week as it is pressured by its own data miss as well as weaker than expected China data. Australia employment rose 12k seasonally adjusted in May, below the consensus of 19.2k. The unemployment rate dropped to 5.4%, as participation rate also dropped to 65.5%.

All eyes will on the monetary policy meeting on Tuesday 1:30 GMT


Chart Analysis


US INDEX

After breaking the reversal pattern “wedge”, the price met the broken ascending trend from the high of 2017, meeting the broken ascending channel, heading the B level of the ABC Elliot waves, divergence on RSI followed by breaking the upper line as shown.

According to Elliot, we can see a spike from that level to 97.9.


USD/JPY

On the daily chart, the pair had broken the ascending channel followed by bouncing from the descending trend from the high of 2017 and the key resistance of 111.1.

The price also broke the support 110.05 to reach the next support 108.15 to get back up again from this level to retest the level at 110.05.

As you can see on the chart, the price is moving according to Elliot waves. By forming the A & B waves, we are waiting for the next move down to hit the C level which is located at the support of 106 and also to meet the ascending trend from the low of 2016.

So, a bounce is expected to be on its way.


USD/CAD

On the daily chart, the price eventually broke the resistance zone 1.309-1.299 followed by break the ascending tend line from the high of 2016, with an engulfing candle.

But also we can see that it touches the top of the “horn” & “wedge” patterns.

So, we only need another confirmation bullish candle to assure the long bias to reach 1.334.


AUD/USD

As we expected, the price will have a strong bearish rally to the support 0.7155. This has been prepared according to five causes;-

The descending trend line from the high of February, breaking of the flag, the resistance zone, and eventually the B level of the ABC Elliott waves

so, the C wave is on its way


 AUD/JPY

As we expected, the pair had formed a wedge which had been broken to reach the support zone 81.2-80.5, to make the price ranges sideways between 80.5 & 84.4.

The price is about to have a bearish bias according to:

bouncing from the resistance zone 84.4-93.9, forming continuous ‘flag’ patterns, bouncing from the moving average 200, and ABC Elliot waves

So, the price is expected to head for 76.25.


AUD/NZD

On the daily chart, as we expected before, the price had made its way up to targets at the resistance zone 1.0815-1.0865, boosted by a BAT harmonic pattern.

The price has already made its retracement as we expected it to.

Reaching the support zone and forming the Gartley harmonic pattern, the price is supposed to continue its bullish movement up to the 1.1045 level after any possible price action from these levels.


Categories
Forex Market Analysis

Daily Market Update: FED Decision To Rate Hike, ECB Meeting


News Commentary


The FED delivered the widely expected rate hike overnight, with a hawkish statement and economic projections. FOMC raised the Fed funds to 2.00%.

Greenbacks have been erased due to fresh concerns about the U.S.-China trade relations were seen weighing on the dollar, which is often sought in times of political tensions.

U.S. President Donald Trump will meet with his top trade advisors on Thursday to decide whether to activate threatened tariffs on billions of dollars in Chinese goods, a senior Trump administration official said.

The ECB rate decision and press conference is the biggest focus today with Eurozone inflation picked up again in May. The ECB should be much more comfortable to end the asset purchase program later this year.

Stopping the program right after September is certainly Euro positive.

The Australian Dollar is trading as the weakest currency today as it is pressured by its own data miss as well as weaker than expected China data. Australia employment rose 12k seasonally adjusted in May, below the consensus of 19.2k. The unemployment rate dropped to 5.4%, as participation rate also dropped to 65.5%.

From China, retail sales rose 8.5% in May, slowed from 9.4% and missed the expectation of 9.6%. Industrial production slowed to 5.8%, down from 7.0% and missed expectation of 7.0%.

Positive data came from Great Britain to enhance the sterling, with the retail sales reading 1.3%, higher than the expected 0.5%.


Chart Analysis


US INDEX

As we can see on the daily chart, the price had bounced from the key resistance level of 95.15. The price is expected to go down to meet the 92.6 level according to many reasons:

Breaking the reversal pattern “wedge”, meeting the broken ascending trend from the high of 2017, meeting the broken ascending channel, heading the B level of the ABC Elliot waves, divergence on RSI followed by breaking the upper line as shown.

According to Elliot, we can see a spike from that level to 97.9.


USD/JPY

On the daily chart, the pair had broken the ascending channel followed by bouncing from the descending trend from the high of 2017 and the key resistance of 111.1.

The price also broke the support 110.05 to reach the next support 108.15 to get back up again from this level to retest the level at 110.05.

As you can see on the chart, the price is moving according to Elliot waves. By forming the A & B waves, we are waiting for the next move down to hit the C level which is located at the support 106 and also to meet the ascending trend from the low of 2016.

So, a bounce is expected to be on its way.


AUD/JPY

On the daily chart, the pair had formed a wedge which had been broken to reach the support zone 81.2-80.5, to make the price ranges in sideways between 80.5 & 84.4.

The price is about to have a bearish bias according to:

reaching the resistance zone 84.4-93.9, forming continuous pattern “flag”, near the moving average 200, and ABC Elliot waves

So, watch for any price action in these levels to head for 76.25.


USD/CAD

The pair is about to take a bearish rally to the 1.274 level according to many reasons:

locating in the resistance zone 1.3-1.38, near the descending trend line from the high of 2016, shaping the reversal pattern “wedge”, and finally the harmonic pattern “Gartley.

So watch for any price action in these levels.


AUD/USD

On the daily chart, a reversal pattern wedge has been broken to reach 0.747 to form a flag pattern.

The price is expected to go up to the resistance zone, then it will have a strong bearish rally to the support 0.7155 according to five causes;-

the descending trend line from the high of February, the upper edge of the flag, the retest of the broken wedge, the resistance zone, and eventually the B level of the ABC Elliott waves


Categories
Forex Market Analysis

Daily Market Update: G7 Summit


News Commentary


All eyes will be on the upcoming G-7 meeting in Quebec as the summit comes at a time of escalating trade tensions between the U.S and some of its major trading partners. Last week, all finance ministers from six members of the G-7 criticised the US Treasury Secretary Steve Mnuchin. The trouble started last week, when the Trump administration imposed tariffs on Canada, Mexico and the European Union. Mexico and Canada are hugely dependent on American demand for their products, which is why over the last few months they’ve shown willingness to grant the US more favourable conditions within the North America Free Trade Area (Nafta). The trade tension is sure to dominate the summit, if these leaders cannot reach an equivalent point, investors could dump their risks to head for safe-haven assets.


On the other hand, there’s a release of big date for Canada, at 12:30 GMT. There’s  Employment Change with a forecast of 19.1K, and Unemployment Rate with a forecast of 5.8%. These figures could give the Canadian some fresh air.


Chart Analysis


US INDEX

On the daily chart, the price had successfully broken the ascending trend from the high of 2017, along with the resistance level to eventually reach the key resistance 95.15 to bounce back from there. The price shaped a reversal pattern (wedge) which closed with a break beneath it.

With divergence in RSI, the price is expected to have a correction to the key support at 92.6 which is located at the broken trend too.


USD/JPY

On the daily chart, the pair had broken the ascending channel followed by bouncing from the descending trend from the high of 2017 and the key resistance of 111.1.

The price also broke the support 110.05 to reach the next support 108.15 to get back up again from this level to retest the level at 110.05.

As you can see on the chart, the price is moving according to Elliot waves. By forming the A & B waves, we are waiting for the next move down to hit the C level which is located at the support 106.9.

So, any bounce now with price action will enhance the down run.


AUD/JPY

On the daily chart, we can see that the price is moving sideways between the resistance zone 84.4-84.15 and the support zone 81.2-80.5.

The price now has entered the red resistance area with a possible bounce.

Also, watch the ascending channel which has formed to be considered as a flag pattern. The pattern boosts the original trend which is a down one

So, any bounce now with price action will push the price to fall


AUD/NZD

On the daily chart, as we expected before, the price had made its way up to targets at the resistance zone 1.0815-1.0865, boosted by a BAT harmonic pattern.

The price has already made its retracement as we expected it too.

Bouncing from the support zone and the uptrend from the low of April, and the broken descending trend from the high of 2017, the price is supposed to continue its bullish movement up to the 1.1045 level.


USD/CAD

On the daily chart, as expected, the price made its way into the resistance zone of 1.289-1.298, almost reaching the key resistance at 1.309, with an approach from the descending trend line starting from the high of 2015, and the upper edge of the horn pattern.

The price has already bounced beneath the key resistance and the resistance zone and got back above it again, but it couldn’t go much further to form a pinbar, to take the price firstly to the support level at 1.274.


AUD/USD

On the daily chart, the price had a false break beneath the support zone 0.75-0.7535 with a pin bar. That enhances the AB=CD harmonic pattern, with breaking a descending channel. The pair rose with an engulfing candle above the support zone.

Along with divergence in RSI, the price is ready for the next move up to 0.774 which is a level with a combination of the lower trend line from the high of 2018 and the broken uptrend.

The price may have a little retracement before hitting this target


NZD/USD

On the daily chart, as we expected before, the pair had bounced from the ascending trend with an engulfing candle, along with breaking a descending trend, to reach our target at the resistance zone at 0.697-0.702.

According to the BAT-shaped harmonic pattern we expected, the price has already reached our first target and is expected to reach the B point at the next resistance zone of 0.7155-0.7185.

The price may have a little retracement before hitting this target


Categories
Forex Market Analysis

Daily Market Update: Euro Strength, G7 Summit, Switzerland CPI Rose


News Commentary


The Euro strengthened on rising bets that the European Central Bank (ECB) may soon announce it will start shooting off its massive bond purchase program.

The central bank’s chief economist Peter Praet, a close ally of President Mario Draghi, said the ECB would discuss next week whether to end bond purchases later this year.

Data indicated that Switzerland’s consumer price index (CPI) rose by 0.4% on a monthly basis in May, more than the 0.3% expected.

On other hand, Japanese Prime Minister Shinzo Abe was set to meet with U.S. President Donald Trump on Thursday and Friday at the White House to discuss a planned U.S. summit with North Korean leader Kim Jong Un next week.

The Federal Reserve is widely expected to raise interest rates for the second time this year at their next meeting on Wednesday.

But many investors are cautions on making big bets due to uncertainties over trade tensions, given U.S. President Donald Trump looks set to clash with other Group of Seven leaders at their weekend summit in Canada.

On the other hand, Mexico announced on Wednesday that it was imposing $3 billion in tariffs on U.S. imports in response to the latter’s triggering duties on steel and aluminium last Thursday.


Chart Analysis


US INDEX

On the daily chart, the price had successfully broken the ascending trend from the high of 2017, along with the resistance level to eventually reach the key resistance 95.15, to then bounce back from there. The price shaped a reversal pattern (wedge) which closed with a break beneath it.

With divergence in RSI, the price is expected to have a correction to the key support at 92.6 which is located at the broken trend too.


USD/JPY

On the daily chart, the pair had broken the ascending channel followed by bouncing from the descending trend from the high of 2017 and the key resistance of 111.1.

The price also broke the support 110.05 to reach the next support 108.15 to get back up again from this level to retest the level at 110.05.

As you can see on the chart, the price is moving according to Elliot waves. By forming the A & B waves, we are waiting for the next move down to hit the C level which is located at the support 106.9.

So, any bounce now with price action will enhance the down run.


AUD/JPY

On the daily chart, we can see that the price is moving sideways between the resistance zone 84.4-84.15 and the support zone 81.2-80.5.

The price has now entered the red resistance area with a possible bounce.

Also, watch the ascending channel which has formed to be considered as a flag pattern. The pattern boosts the original trend which is a down one.

So, any bounce now with price action will push the price to fall.

.

Categories
Forex Market Analysis

Daily Market Update: Raised GDP in Australia, NAFTA Pressures the Canadian, ECB Next Move


News Commentary


The Australian dollar was supported by GDP growth numbers, which rose 1% in the first quarter of 2018, beating the estimated 0.8%. On an annualised basis, growth was 3.1%, above both the expected 2.8% and the previous quarter’s 2.4% gain.

Trade talks between the U.S. and China are ongoing. China offered to increase the buying of U.S. goods by $25 billion this year which grabbed some attention. The reports said China would step up purchases of crude oil, coal and farm products.

The Canadian dollar came under renewed pressure after White House economic adviser, Larry Kudlow, said on Tuesday that President Donald Trump is considering holding separate talks with Canada and Mexico.

That added fuel to the speculation that the United States could dispose of the North American Free Trade Agreement (NAFTA).

All eyes will be on the Canadian trade balance at 12:30 GMT with a forecast of -3.4B.

Some reports said that at its next policy meeting this month, the ECB could declare on when its quantitative easing program would end.

“The market will start to focus on the ECB from now on. Politics in Italy and Spain will play second fiddle as we now have new governments in both countries,” said Kazushige Kaida, head of foreign exchange at State Street Bank.


Chart Analysis


USD/JPY

On the daily chart, the pair had broken the ascending channel followed by bouncing from the descending trend from the high of 2017 and the key resistance of 111.1.

The price also broke the support 110.05 to reach the next support 108.15 to get back up again from this level to retest the level at 110.05.

As you can see on the chart, the price is moving according to Elliot waves. By forming the A & B waves, we are waiting for the next move down to hit the C level which is located at the support 106.9.

So, any bounce now with price action will enhance the down run.


AUD/JPY

On the daily chart, we can see that the price is moving sideways between the resistance zone 84.4-84.15 and the support zone 81.2-80.5.

The price now has entered the red resistance area with a possible bounce.

Also, watch the ascending channel which has formed to be considered as a flag pattern. The pattern boosts the original trend which is a down one

So, any bounce now with price action will push the price to fall.


AUD/NZD

On the daily chart, as we expected before, the price had made its way up to targets at the resistance zone 1.0815-1.0865, boosted by a BAT harmonic pattern.

The price has already made its retracement as we expected it too.

Bouncing from the support zone and the uptrend from the low of April, and the broken descending trend from the high of 2017, the price is supposed to continue its bullish movement up to the 1.1045 level.


Categories
Forex Market Analysis

Weekly Market Update: RBA Rate Statement, EU Politics, US-China Conflict


News Commentary


US

Investors have been watching the May jobs report closely on Friday for any clues on future monetary policy as maximum employment is one of the Federal Reserve’s key objectives.

All data came positive as Non-Farm Employment Change released with 223K, higher than the expected 189K, and Unemployment Rate decreased by 3.8%. ISM Manufacturing PMI came in at 58.7, better than the forecasted 58.3.

The news has featured that the U.S.-North Korea summit is back on track. North Korea and the US are starting the preparations for the June 12 summit between Kim Jong-un and Donald Trump.

Separately, Trump contacted the Japanese prime minister, Shinzo Abe. He “affirmed the shared imperative of achieving the complete and permanent dismantlement of North Korea’s nuclear, chemical, and biological weapons and ballistic missile programs,” The White House claimed. And they would meet before the Kim-Trump summit.

China warned the United States on Sunday that any agreements reached on trade and business between the two countries will be void if Washington implements tariffs and other trade measures, as the two ended their latest round of talks in Beijing.

That came after U.S. Commerce Secretary Wilbur Ross met Chinese Vice Premier Liu He in Beijing over the weekend.

The world’s two largest economies have threatened each other with tens of billions of dollars’ worth of tariffs in recent months, leading to worries that Washington and Beijing may engage in a full-scale trade war that could damage global growth and oil markets.


EUR

The Euro gained on Thursday as Italian parties renewed attempts to form a government, to calm down the concerns about the wider impact of a political crisis in Europe’s third-largest economy.

The two anti-establishment parties have made many efforts to form a coalition government, rather than force Italy into holding elections for the second time this year in September.

The CPI flash estimate enhanced the regains of the Euro after a reading of 1.9%, which was more than the forecast of 1.6%, along with the core reading of 1.1 %, which was more than the forecast of 1.0%.

Besides, economists have concluded that the ECB will begin hiking rates in the middle of next year.

All eyes will be on the Draghi speech on Tuesday to note any views for the economy and the growth.


CAD

The Bank of Canada Governor, Stephen Poloz, left rates on hold for a third straight decision on Wednesday at 1.25%, but gave a hawkish statement for the economy and removed some cautious language.

The central bank also clarified that recent economic data bolsters its April outlook for a 2% growth in the first half of 2018.

GDP rose to 0.3%, which was higher than the expected 0.2%. That would reinforce the optimism bias for the BOC.

Canada is waiting for some big data this week. Firstly with the trade balance on Wednesday, the last reading was -4.1B, and the unemployment rate on Friday, the last release was 5.8%.


AUD

Australia reported worse than expected Capex data. Private capital expenditures rose only 0.4% in the first quarter against 1.0% estimated and 0.2% from the fourth quarter of last year.

The Australian dollar is also waiting for many events this week. Retail sales on Monday, GDP on Wednesday, and trade balance on Thursday to give an outlook to the economic growth.

All eyes will be on the RBA statement rate on Tuesday, which the RBA is expected to keep rates stable at 1.5%


Chart Analysis


US INDEX

On the daily chart, the price had successfully broken the ascending trend from the high of 2017, along with the resistance level to eventually reach the key resistance 95.15 to bounce back from there.

The price shaped a reversal pattern (wedge) which closed with a break beneath it.

With forming divergence in RSI, the price is expected to have a correction to the key support at 92.6 which is located the broken trend too.


NZD/USD

On the daily chart, as we expected before, the pair had bounced from the ascending trend with an engulfing candle, along with breaking a descending one, to reach our target at the resistance zone at 0.697-0.702.

According to the Bat-shaped harmonic pattern, the price is expected to reach the B point at the next resistance zone 0.7155-0.7185.

The price may face a little retracement before going up to the mentioned targets.


USD/CAD

On the daily chart, as we expected the price had made its way into the resistance zone of 1.289-1.298, almost reaching the key resistance at 1.309, with an approach from the descending trend line starting from the high of 2015, and the upper edge of the horn pattern.

The price has already bounced beneath the key resistance and the resistance zone and got back again above it, but it couldn’t go much further to form a pinbar, to take the price firstly to the support level at 1.274.


AUD/USD

On the daily chart, the price had a false break beneath the support zone 0.75-0.7535 with a pin bar.

That enhances the AB=CD harmonic pattern, with breaking a descending channel.

The pair rose with an engulfing candle from the support zone.

Along with divergence in RSI, the price is ready for the next move up to 0.774 which is a level with a combination of the lower trend line from the high of 2018 and the broken uptrend.


AUD/JPY

On the daily chart, as we expected, the price reached the resistance zone at 84-84.35.

The price couldn’t break through this area to bounce back.

It reached the support levels at 81.25-80.5 (as we expected) to pull back up again boosted by the ascending trend from the low of March.

As the pair is currently moving sideways. The price is expected to retest the resistance zone again.


AUD/NZD

On the daily chart, as we expected before, the price had made its way up to targets at the resistance zone 1.0815-1.0865, boosted by a BAT harmonic pattern.

The price is going to have a little retracement at these levels to continue its bullish movement up to the 1.1045 level.


Categories
Forex Market Analysis

How the US-China Trade War “On Hold” Affected the Market


News Commentary


US Secretary of the Treasury Steven Mnuchin said the US trade war with China is “on hold”. Investors now hope that this particular pause will be more remarkable than previous attempts to rebalance trade tensions.

The statement also said “consensus on taking effective measures to substantially reduce” US trade deficit in goods with China. And, China agreed to “significantly increase purchase” of US goods and services.

That automatically affected the Yen as risk appetite has returned, which made the Japanese currency lose its bright future as a safe haven.

On the other side, the Australian & New Zealand Dollars found their momentum as traders return to desire more risks.

The National Australia Bank pushed back their forecast of an RBA rate increase within 2018. Their next move’s expectation is now relocated from November to May 2019. That change put them back in line with market pricing.

RBA chief economist Alan Oster announced that the “change reflects the fact there is no sign yet of stronger wages growth, and unemployment has been stuck around 5.5% for the best part of a year.” Also, he explained that once the tightening cycle begins “further rate increases will be very gradual”. And after the first May 2019 increase, the next one will be “not until November 2019”.


Chart Analysis


US INDEX

On the daily chart, the price has bounced from the resistance of 93.6 with a pin bar.

A BAT harmonic pattern boosts the continuation of the bearish momentum. Divergence on RSI assured this possible downfall.

The price is expected to fall as a retracement to the support 92.6.


AUD/JPY

On the daily chart, as we expected, the price reached the resistance zone at 84-84.35 and continued by shaping a head & shoulders reversal pattern.

If the price could break this zone to activate the pattern, it may reach the second area at 85.45-85.95


Categories
Forex Market Analysis

Weekly Market Update: FOMC & ECB Meetings


News Commentary


We are looking forward to another busy calendar week for most assets, followed by many important readings and announcements from central banks, to see how this will affect each currency.


EUR

The German Final CPI results were not unexpected. The indicator dropped to 0.0% marking a 3-month low. The Eurozone Final CPI went to 1.2%, down from 1.3% last month. The Eurozone Final Core CPI dropped from 1.0% to 0.7. The German indicator posted a sharp drop of -8.2 for a second straight month, the first declines since July 2016. The low reading certainly doesn’t show much optimism. The ECB will have to stay with its stimulus policy program in their meeting on Thursday.


The EUR has another battle with Italy’s new leader’s elections who may propose new deficit spending that appears to tighten the EU Growth.

Further details on the formation of the new Italian government between the League and Five Star movement will be a key market focus for EUR fixed income markets.


US

The dollar found momentum as the bond yields on 10-year U.S. Treasury raised to 3.025%, the highest level in three weeks. A rise above the high of 3.035% reached on April 25 would take it to its highest since early 2014.

U.S. bond yields were enhanced by signs of trade tensions between the U.S. and China calming down after U.S. President Donald Trump promised to help Chinese technology company ZTE.

This also affected the Dow and S&P 500 who both passed the previous peak, which came almost a month earlier in what could be an indication of an ending of the correction.

All eyes will be on the FOMC meeting on Wednesday to show any hint about how many rate hikes may come this year.


GBP

The UK Average Earnings Index came in below expectations with 2.6%. This may put more pressure on sterling which will make traders concerned about any rate hike soon.

Besides, inflation fell faster than the BoE forecasted in February.

Policymakers think the effects of Brexit on sterling are likely to ease slightly faster than expected, so they now plan that inflation will return to the 2 percent target in two years, despite the delay of the next rate rise.

In the UK, the inflation report on Tuesday is expected to ease the fading impact of the GBP lowering.

With also CPI on Wednesday, there are expectations of the same as the last reading of 2.5%.

Following on Thursday will be retail sales with a forecast of 0.8%, and second estimate on GDP on Friday with an expectation of 0.1%.

All eyes will be on BOE governor Carney’s speech on Thursday and Friday, noting about an upcoming rate hike.


CAD

Inflation in Canada has been higher in recent months and rose to 2.3% in March.

Economic CPI stabilised at the forecast of 0.3%, with core retail sales falling to 0.2%.

Negotiations about the North American Free Trade Agreement (NAFTA) have reached a dilemma with no meetings scheduled among the top leaders, ahead of the month-end.

Trump’s economic adviser Kudlow linked between NAFTA and China, indicating that an agreement on NAFTA would show that the US can avoid a trade conflict with China. The NAFTA agreement would also show Trump’s tactics, and if there is trade conflict with China, then it is China’s fault.


 AUD

The Australian Employment Change for April was better than expected with 22.6K, which crossed over the 19.8K estimate.

On the other hand, the Unemployment Rate rose for the fifth time since July 2017, reaching 5.6%.

The lower wage price index put more pressure on the Australian dollar with a reading less than expected of 0.5%.

All eyes will be on RBA governor Lowe’s speech to declare any notes about inflation,  growth and the outlook for the economy.


JPY

The announcement that North Korea suspended negotiations with South Korea on the denuclearisation has affected the Japanese yen as a “safe haven” of the financial market.

Japan GDP ended the expansion streak for eight straight quarters of growth. Japan GDP contracted -0.2% QoQ in Q1, less than the expectation of 0.0% QoQ. On an annualised basis, GDP contracted -0.6% versus the expectation of -0.1%.


CHART ANALYSIS


US INDEX

On the daily chart, the price has bounced from the lower trend line from the high of 2017.

The price is near the key resistance of 94.15 which bounced with a pin bar.

A bat harmonic pattern boosts the continuation of the bearish momentum.

Divergent on RSI assured this possible downfall.

If the price could break beneath the key support level 92.6, it may reach 91.1 again.


 AUD/USD

On the daily chart, the price had a false break beneath the support zone 0.75-0.7535. That enhances the harmonic pattern AB=CD. The pair had made a price action (pin bar) in this false break to boost the bullish bias. The pair is moving onto the support zone now. Along with divergence in RSI and breaking the lower trend line as shown, the price is ready for the next move up to 0.7635 then 0.7715.


 USD/CAD

On the daily chart, the price had made its way into the resistance zone of 1.2925-1.3, with an approach from the descending trend line starting from the high of 2015. The price reversed from these levels, breaking beneath the key 1.28 support level and then, returning to it. If the daily candle closes under this level again, it will prompt the price to be bearish to the support zone 1.252-1.243.


 AUD/JPY

On the daily chart, we can see that the price bounced from the support area of 80.35-81.2.

A well-noticed head & shoulders reversal pattern is shaped. The price is on the second shoulder with a breaking of the lower trend line as shown.

Followed by oversold on RSI and the breaking of the lower trend line, the price is expected to get back up again to the resistance area 84-84.35.


USD/JPY

The price is located at a very strong short-selling area, rebounding from the descending trend line from the high of 2018. Besides the broken uptrend line from the low of 2011, also reaching the top edge of the upward channel along with forming an AB=CD harmonic pattern with divergence on RSI. The price is also about to shape a double top pattern. We will wait for a bounce from these levels and break beneath the upward channel to go short to our targets of 108.1 then 104.8.


Categories
Forex Market Analysis

Daily Market Update: Canadian CPI


News Commentary


Canadian Inflation and retail sales numbers on Friday could fuel expectations of a rate hike if they point to strong readings. Inflation in Canada has been higher in recent months and rose to 2.3% in March.

Economic CPI forecast to reach 0.3% with core retail sales to be 0.5%.

However, Negotiations about the North American Free Trade Agreement (NAFTA) have reached a dilemma with no meetings scheduled among the top leaders, ahead of the month-end.

Trump’s economic adviser Kudlow linked between NAFTA and China, indicating that an agreement on NAFTA would show that the US can avoid a trade conflict with China. The NAFTA agreement would also show Trump’s tactics, and if there is trade conflict with China, then it is China’s fault.


On the other side, inflation fell faster than the BoE forecasted in February.

Policymakers think the effects of sterling’s Brexit are likely to ease a slightly faster than expected, so they now plan that inflation will return to the 2 percent target in two years, despite the delay of the next rate rise.


The Australian Employment Change for April was better than expected with 22.6K, which crossed over the 19.8K estimate.

On the other hand, the Unemployment Rate rose for the fifth time since July 2017, reaching 5.6%.


Charts Analysis


AUD/USD

On the daily chart, the price had a false break beneath the support zone 0.75-0.7535. That enhances the harmonic pattern AB=CD. The pair had made a price action (pin bar) in this false break to boost the bullish bias. The pair is moving onto the support zone now. Along with divergence in RSI and breaking the lower trend line as shown, the price is ready for the next move up to 0.7635 then 0.7715.


USD/CAD

On the daily chart, the price had made its way into the resistance zone of 1.2925-1.3, with an approach from the descending trend line starting from the high of 2015. The price reversed from these levels, breaking beneath the key 1.28 support level and returning to it. If the daily candle closes under this level again, it will prompt the price to be bearish to the support zone 1.252-1.243.


AUD/JPY

On the daily chart, we can see that the price bounced from the support area of 80.35-81.2.

A well-noticed head & shoulders reversal pattern is shaped. The price is on the second shoulder with a breaking of the lower trend line as shown.

Followed by oversold on RSI and the breaking of the lower trend line, the price is expected to get back up again to the resistance area 84-84.35.