Categories
Forex Basic Strategies

Trading The High Low Breakout ‘Asian Forex Session’

The significant advantage of the forex market is it opens 24 hours a day, which provides a couple of trading opportunities to traders around the globe. There are four major trading sessions that exist, the first one of Asia, followed by Frankfurt, London, and New York. All of these are the significant sessions that allow investors to trade even in opening sessions or even in the middle of the night. But not all the trading sessions are equally volatile; for example, London and New York are the biggest sessions where a lot of volume traded, and on the other hand, traders believe that the Frankfurt and Asian sessions are the least traded session in the market.

So this mentality stops the traders from trading the Asian session. Another reason might be that when the Asian session opens, half of the world slept, that’s why the price action is less volatile in the market. In a less volatile market, simply it is difficult for the traders to seize the more significant gains, and even in less volatile conditions, traders hate to trade the markets, and if you are the one who is always looking to make quick bucks in the volatile conditions. In this article, we will show you the strategy we created, especially to take advantage of the Asian markets.

We believe you know that London is the most significant trading session in the market, which provides where most of the traders around the globe, bankers, and institutions trade the market. In the London market, most of the currencies show a lot of volatility, and you can trade all of it, but it is advisable to give preference to the GBP, CHF, USD, and EUROS.

Trading Strategy

First of all, we suggest you follow the link below and find out when the London session starts according to your country’s time.

https://forex.timezoneconverter.com/

After finding out the opening time of the London session according to your local time, the next step is to sit on your desk one hour prior to the London opening and find out which of the currencies performed better in the Asian session and mark the Asian session High and Low. The next step is to wait for the London opening and in London session when the price action breaks the Asian session high or low take trade in that direction. As you know, London is the biggest session, so always expect longer moves.  This strategy is specially created for intraday traders, so always trade the Asian high and lows on lower timeframes, such as 5, 15, or 30 minutes.

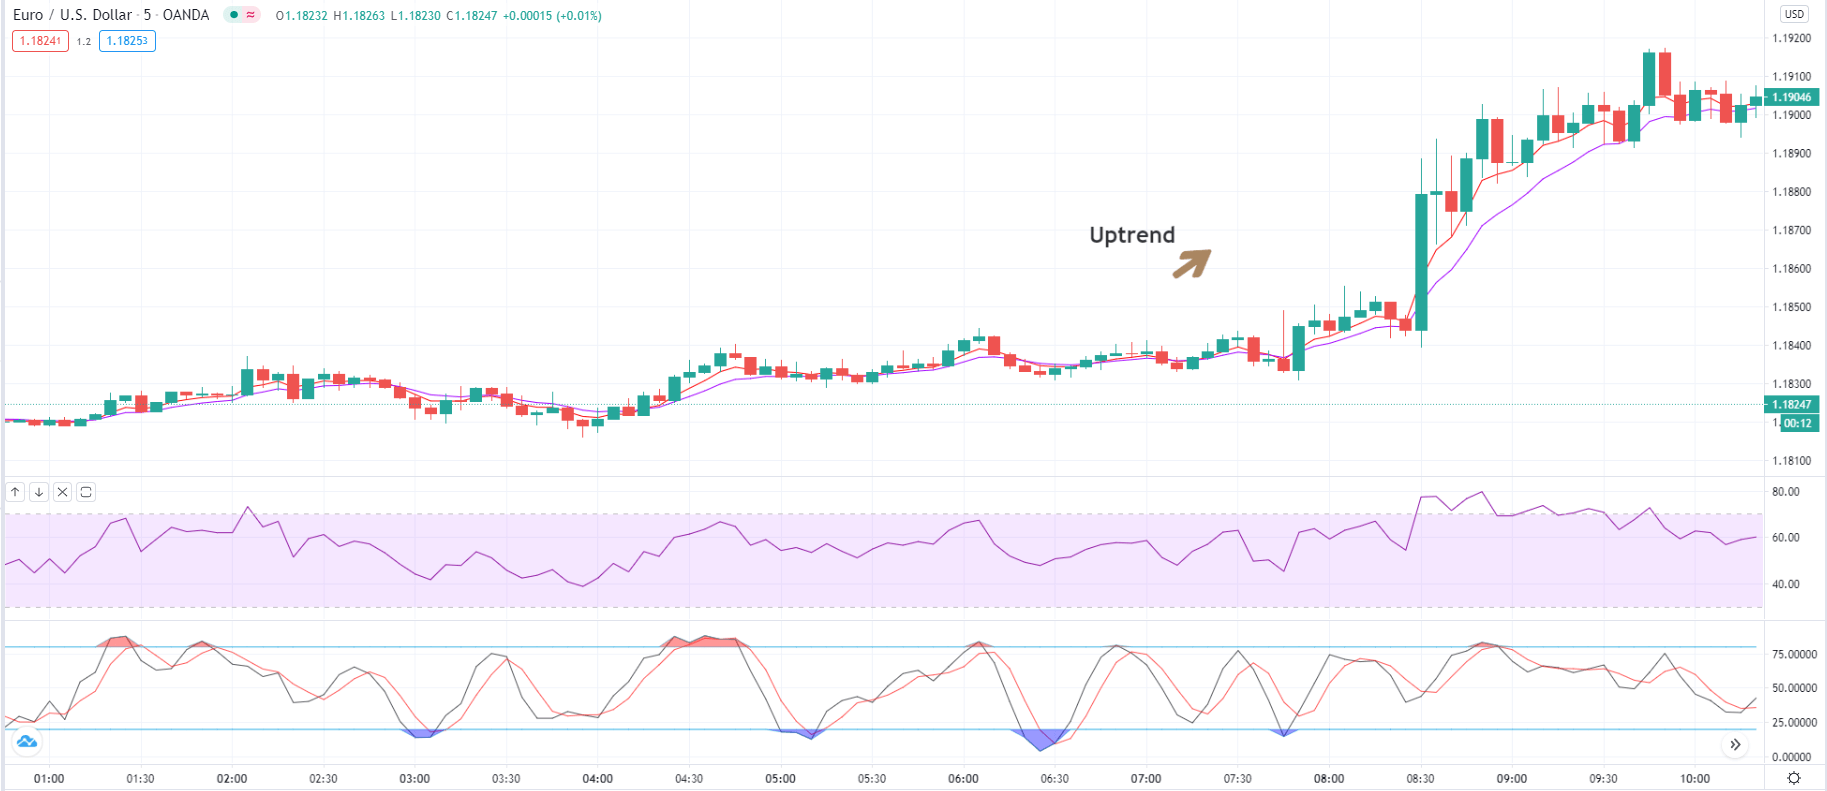
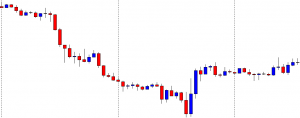
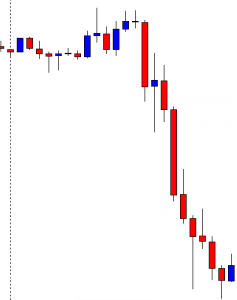
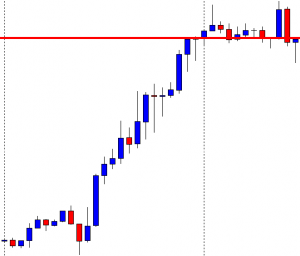
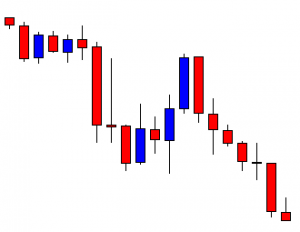
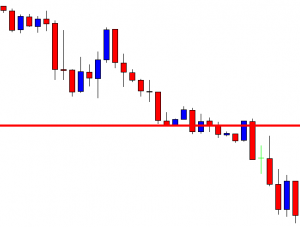
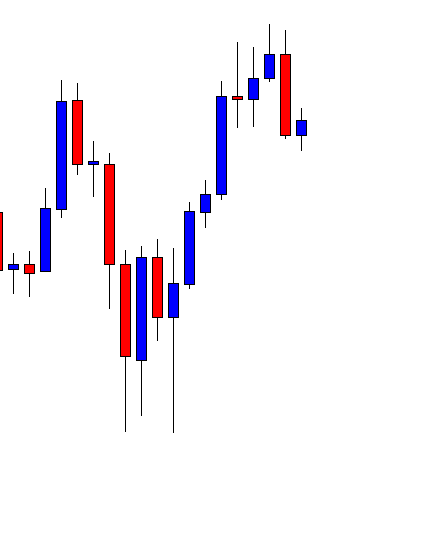
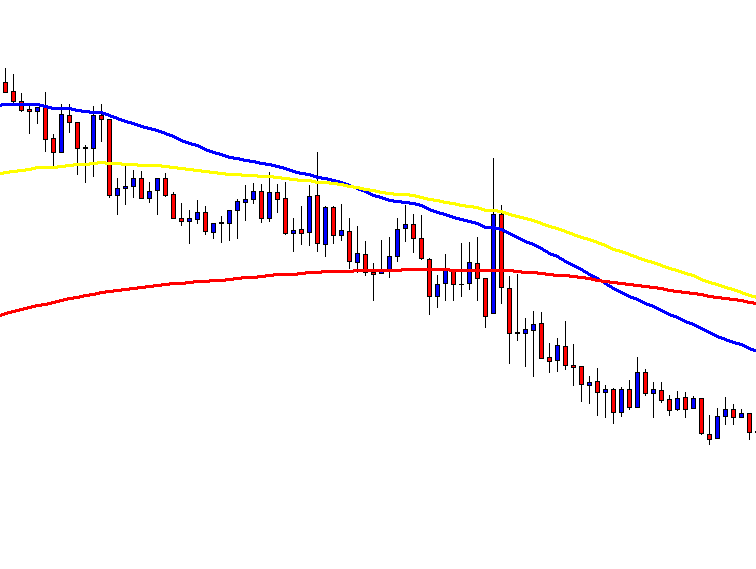
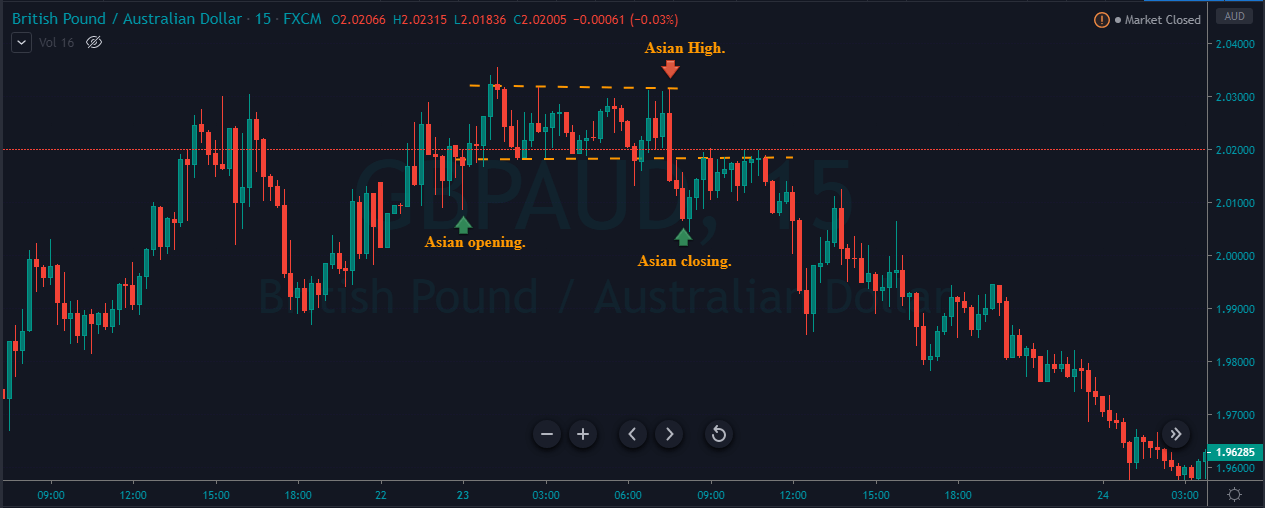
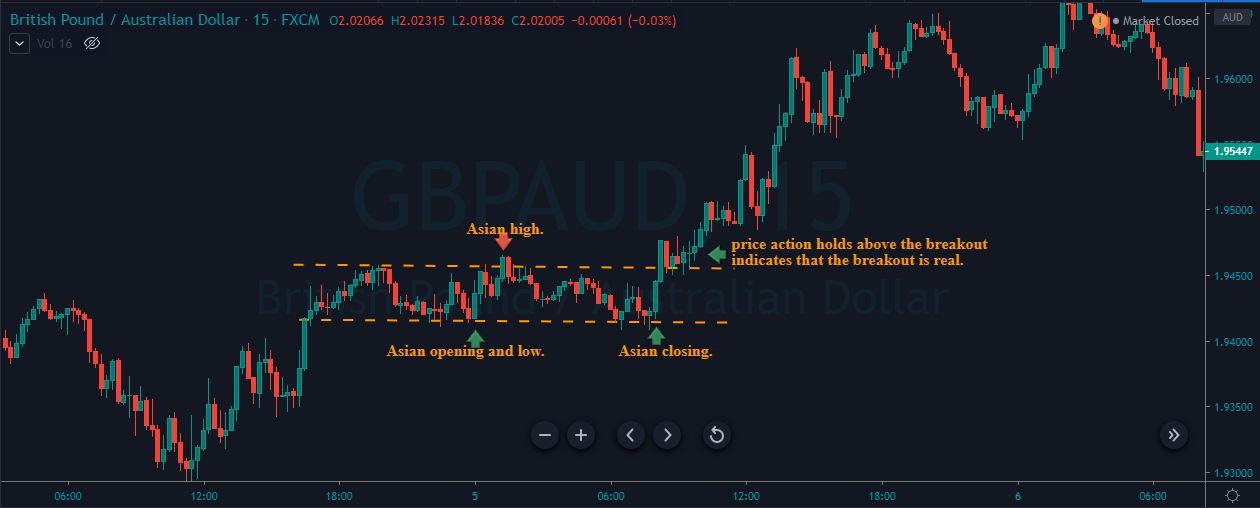
According to the GMT, the Asian session opens at Midnight and closes at Morning 08:00, and the London session also opened the morning at 8:00 AM, so before the London, opening finds out the Asian high low to take the trade. The image represents the opening, high, and close of the Asian session, the below image clearly represents that the GBPAUD forex pair, didn’t move much in the Asian session and even it turned into a range to give us trades in the London Session.

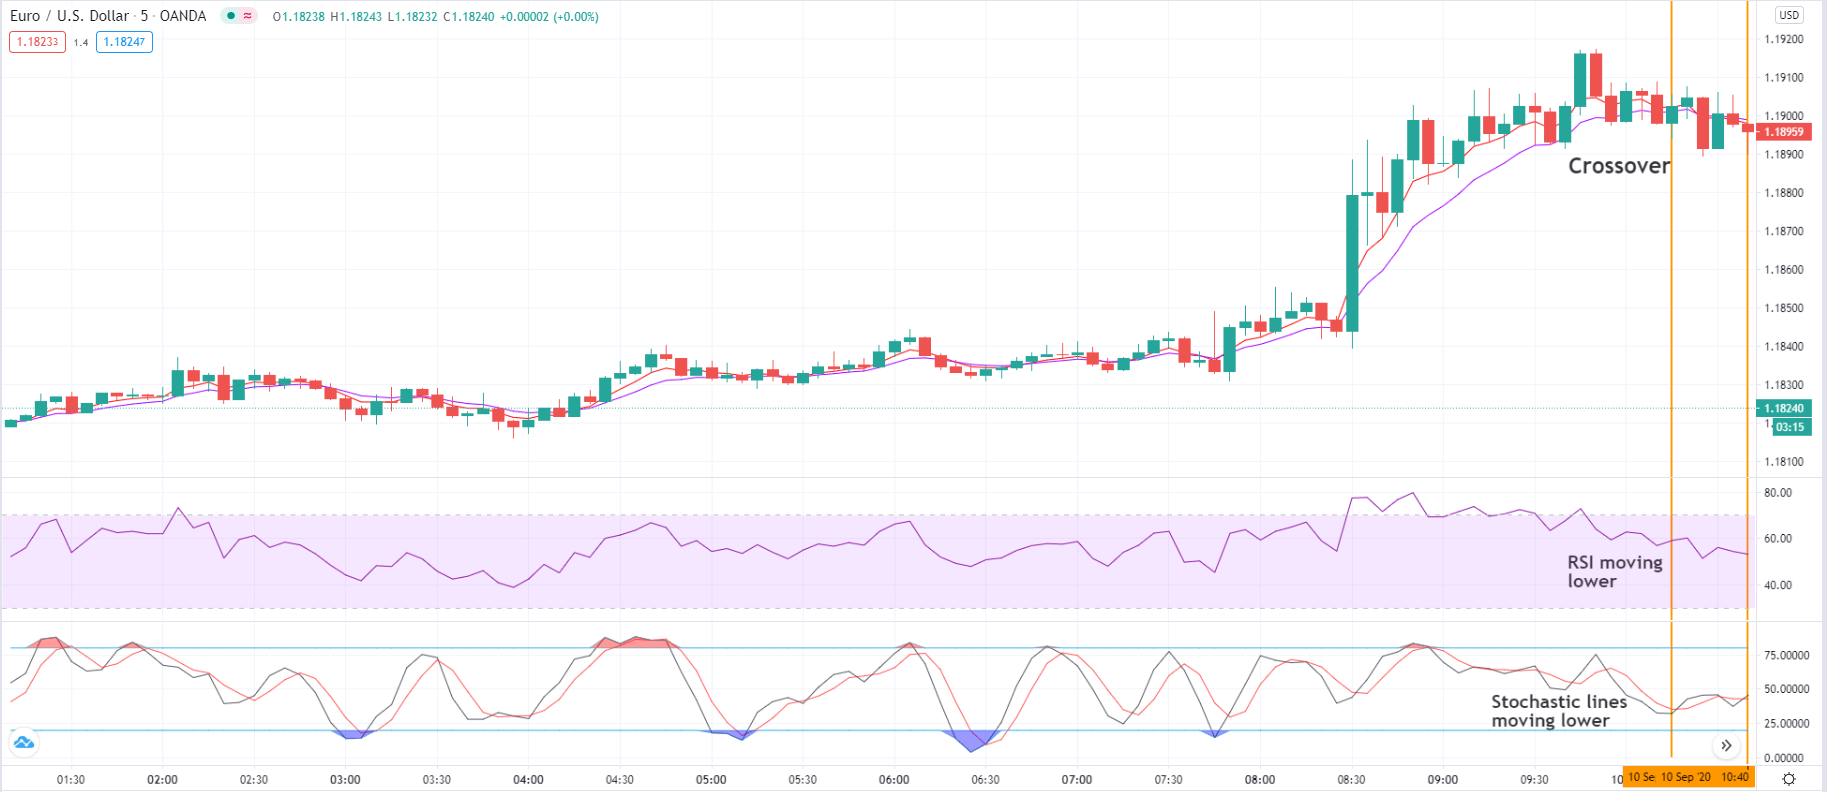
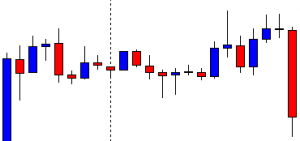
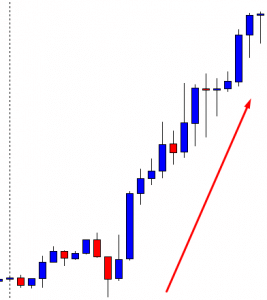
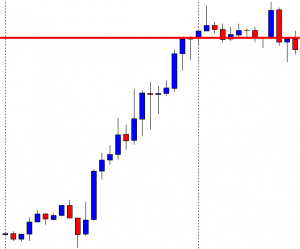
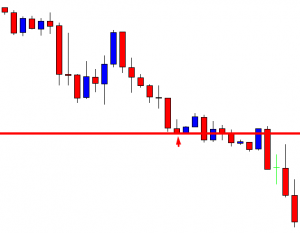
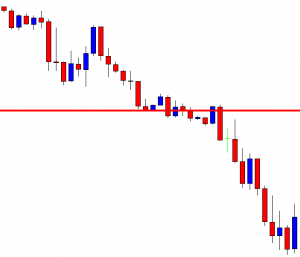
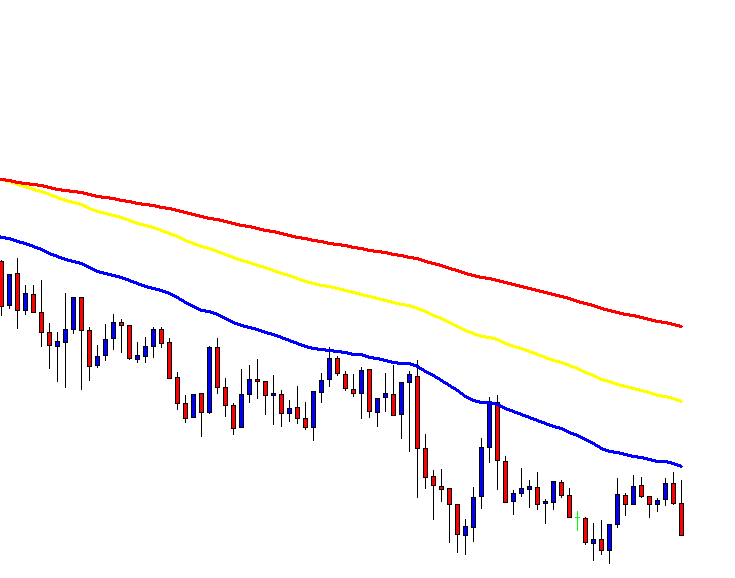
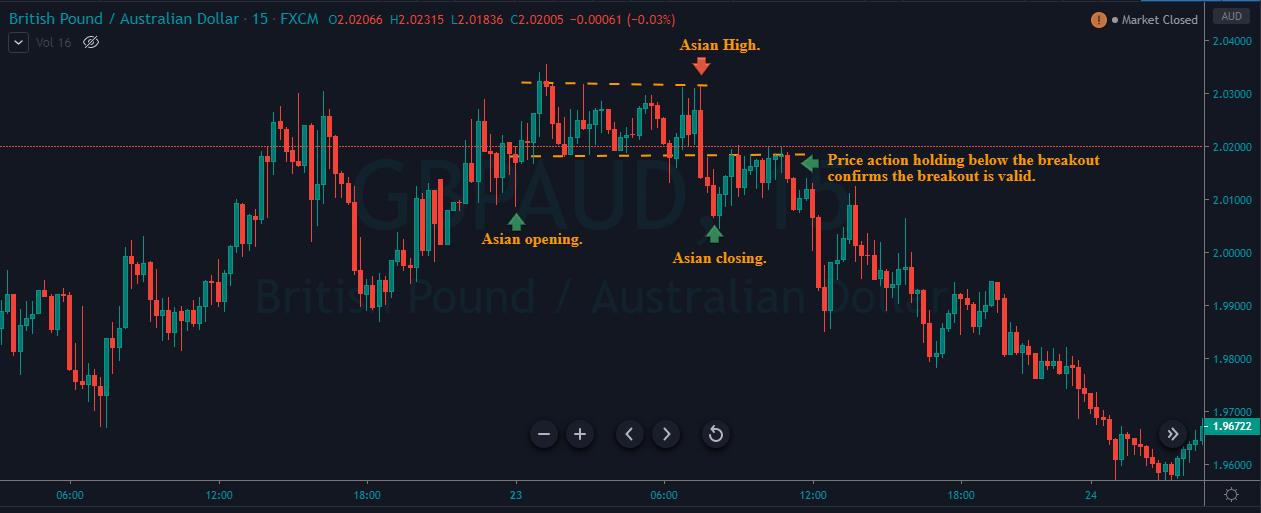
The major mistake most of the breakout traders made is they don’t wait to confirm the breakout, and sometimes price action came back into the range, and they end up losing side. So it is advisable to confirm the breakout first then only activate your trade. As you can see in the below image, when price action breakout the Asian high and low in the London session, it started holding below the breakout line, which confirms that the breakout is real.

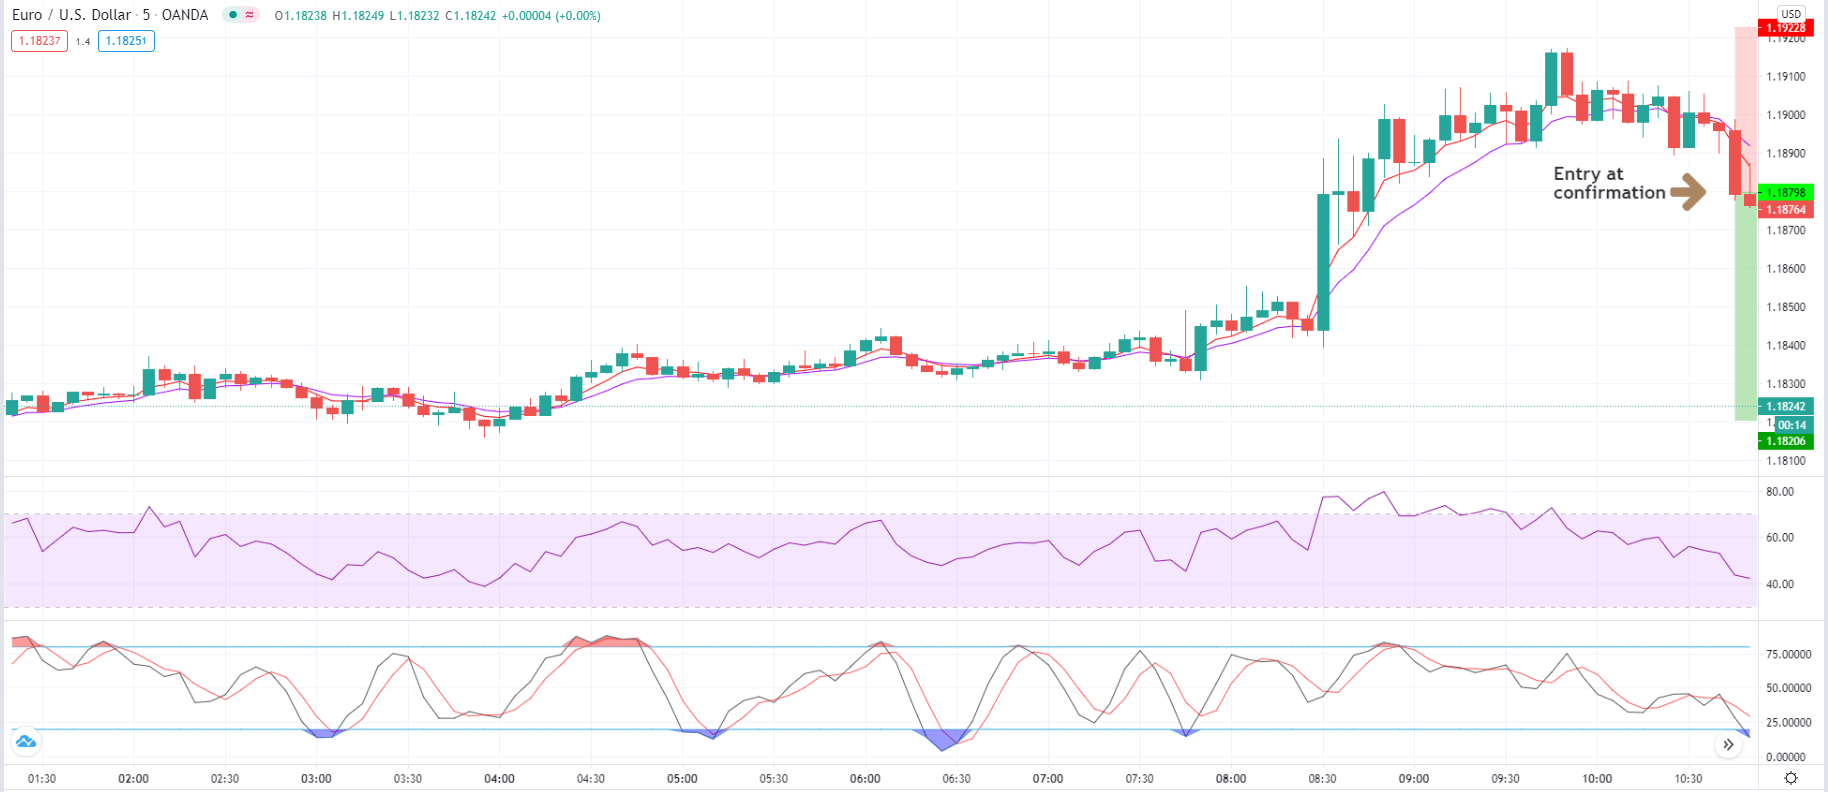
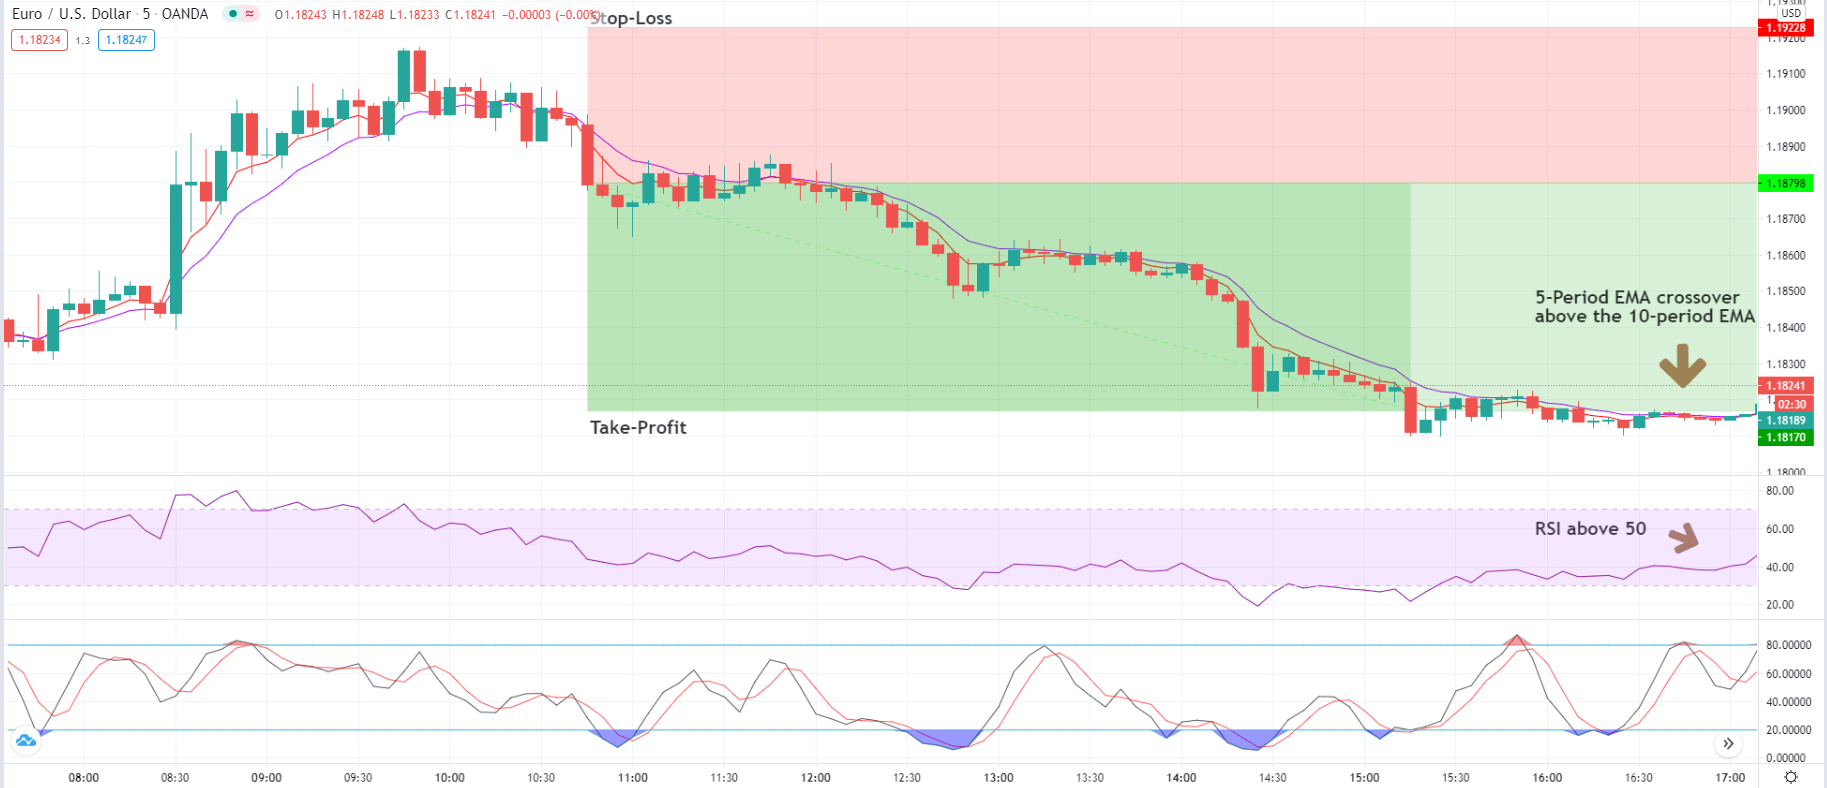
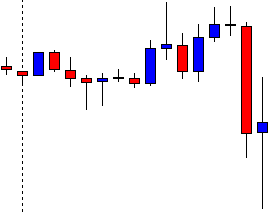
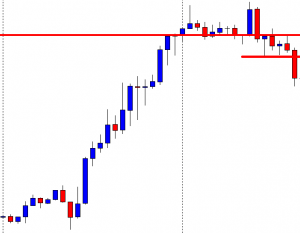
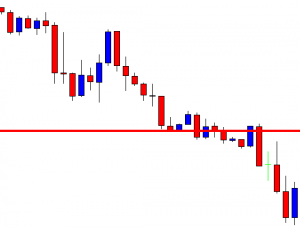
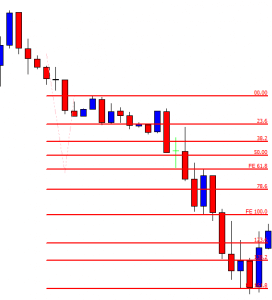
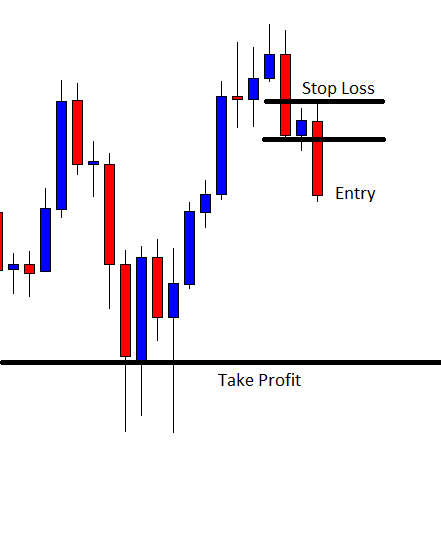
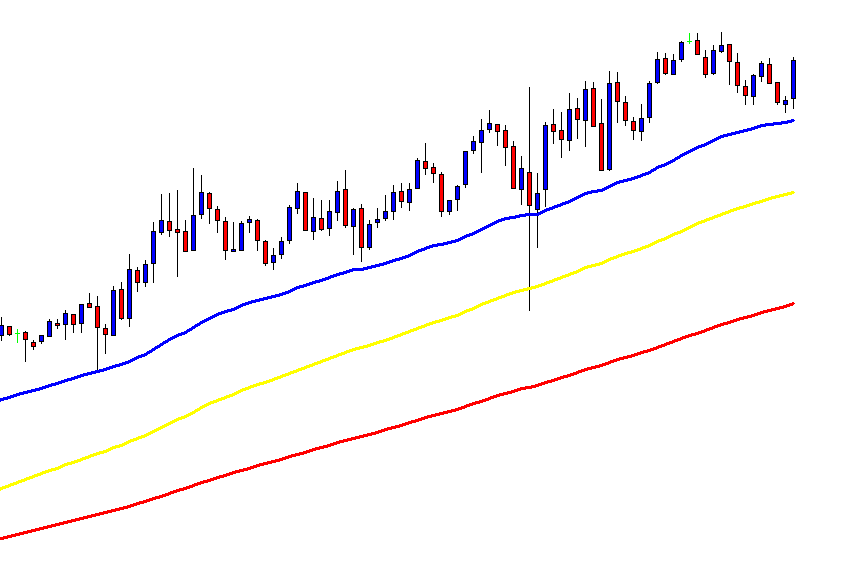
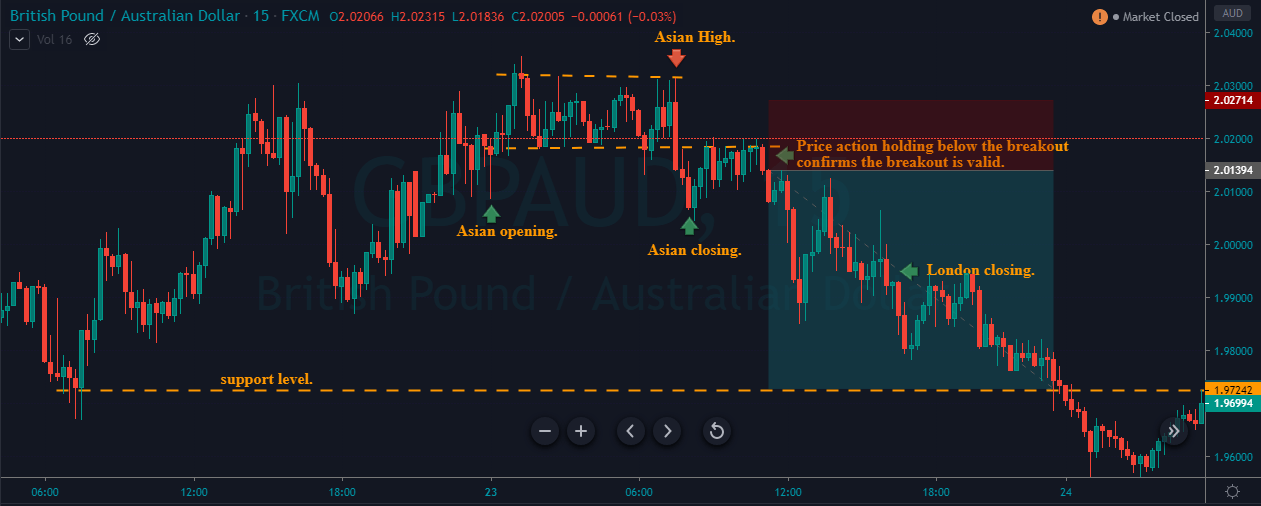
The image below represents our entry, exit, and take profit in this forex pair; we took entry when the price action holds below the breakout line. The stop loss was just above the breakout; the reason for the smaller stops is that the holding below the breakout line confirms the stability of the breakout. Some traders like to trade only the London session, and they exit their positions as the London session closes. It is your personal preference. However, we recommend you hold your positions for the more extended targets because the London session overlaps with the US session, and the US is the biggest session in the industry, where the traders with deep pockets trade the markets. So just like London, if the markets allow you to hold your position for the US session, then go ahead and milk the market. The last green on the below image represents the London closing, but we decided to go for the deeper targets because the trend of the market was quite healthy, which is a sign for us to hold our winning position.

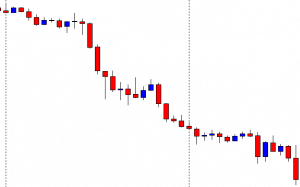
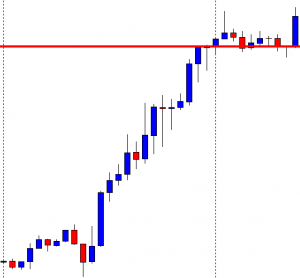
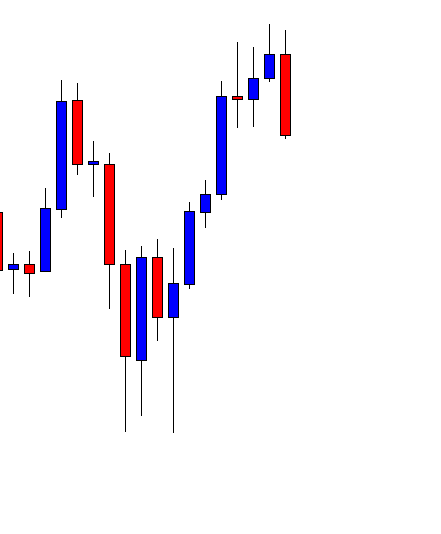
The image below represents the Asian, opening, high, low, and close on the GBPAUD forex pair.

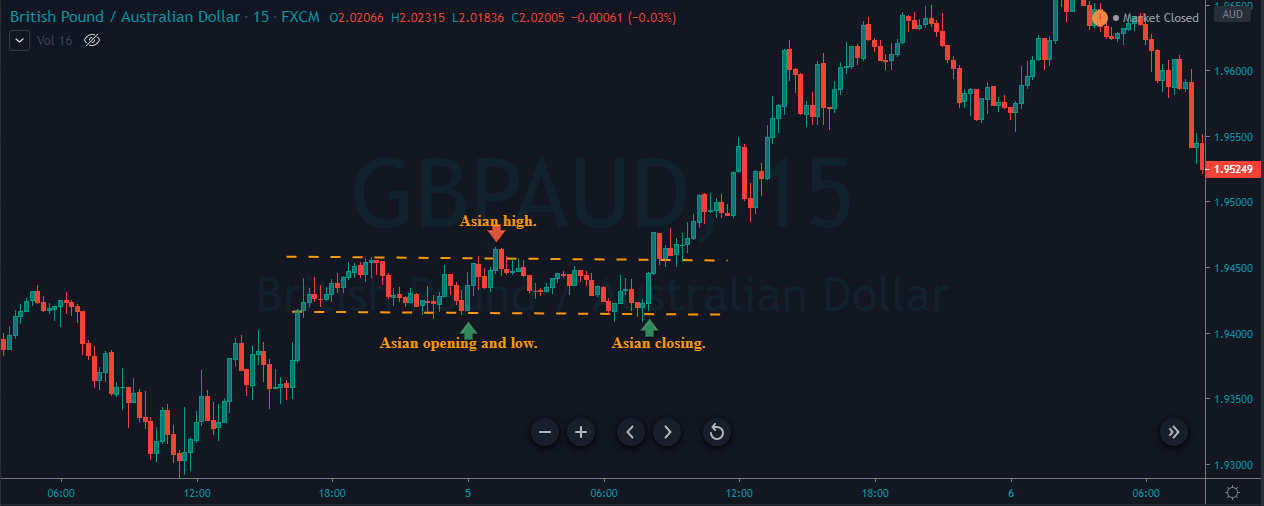
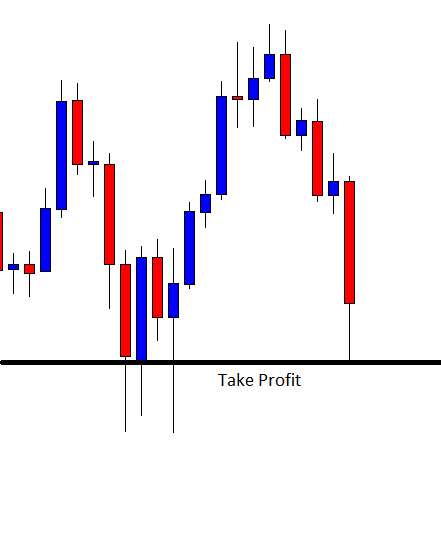
The image below shows that the Asian session failed to make any move in this pair, and it just holds sideways because it was waiting for London to open so that the increased volatility moves the market. When London opens then price action immediately breakout the range, it started holding above the range, which was a confirmation to go long in this pair.

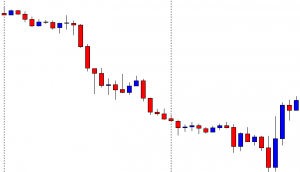
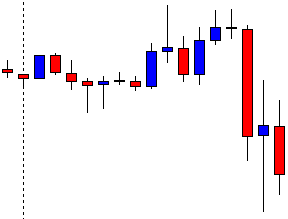
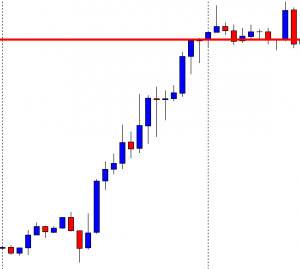
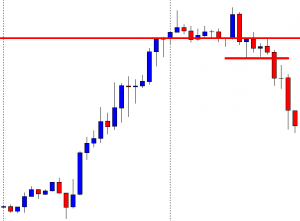
The below image represents our entry, exit, and take profit in this pair; we took entry when price action holds above the breakout line. The stops were just below the breakout, and for the take profit, we decided to lose our position at the major resistance line in the US session.

Conclusion

Asian session high low breakout is an intraday strategy; it helps you to trade all the sessions in the market. You can take data from the Asian session and use it in the London session to take an entry, and the volatility and strength of the US session help you to exit your position at more significant gains. This is the beauty of this strategy, which makes you active in all the sessions. The more you use this strategy, the better your trading will be, and the deeper understanding you will have of all the trading sessions.

Categories
Forex Elliott Wave Forex Market Analysis

AUDJPY Could Develop a Limited Upside

Overview 

The AUDJPY cross advances in an incomplete upward sequence that belongs to a corrective structural series backed by Monday’s trading session’s euphoric sentiment. The Elliott Wave view unveils the likelihood of a limited upside before resuming its declines.

Market Sentiment

The AUDJPY cross retraces on the overnight Tuesday trading session after the surprising weekly kick-off, which jumped the price over 2.2%, climbing until 77.037, its highest level since September 18th.

The AUDJPY 8-hour chart illustrates the 30-day high and low range, which exposes the participants’ intraday market sentiment. The figure distinguishes the price action consolidating in the extreme bullish sentiment zone, backed by the stock market’s euphoric rally on Monday’s trading session.

The breakout of the last 30-day high of 76.274 during Monday’s trading session raised the participants’ extreme bullish sentiment, expecting further upsides on the cross. Moreover, we see that the price action remains above its 60-period linear weighted moving average, which confirms the bullish bias on the AUDJPY.

Nevertheless, the AUDJPY found resistance below mid-September’s consolidation zone. This market context expects a significative retracement or a consolidation movement before continuing the rally experienced in Monday’s session. Finally, a retracement below the 75.087 level would turn the market sentiment from bullish to bearish.

Technical Overview

The AUDJPY cross advances in an incomplete upward bullish sequence of a lower degree, which belongs to a descending structure that began on August 31st when the price topped on 78.462.

The below 8-hour chart exposes the price action running in an upward wave ((b)) of Minute degree labeled in black, which currently advances its fourth wave of Minuette degree identified in blue. Likewise, according to the Dow Theory, considering that the AUDJPY cross advanced over 66% of the bearish decline, the price should develop a bearish connector corresponding to wave ((b)).

In this context, following the Elliott Wave theory and considering the third internal segment of the intraday rally, the price could produce a limited upside toward the supply zone bounded between 77.295 and 77.497. Finally, the bearish divergence on the MACD oscillator may mean a confirmation of the upward movement’s exhaustion corresponding to wave ((b)).

Short-Term Technical Outlook 

The incomplete bullish sequence of the AUDJPY cross unfolded in its 4-hour chart exposes the progress in its fourth wave of Subminuette degree labeled in green. Likewise, considering that the third wave is the extended wave of wave (c), the fifth wave in green should not be extended.

On the other hand, considering that the second wave in green is a simple correction, the fourth wave should elapse more time than the second wave. Additionally, the fifth wave in green could extend itself between 77.140 and 77.654. The price could find fresh sellers expecting to open their shorts on the bearish side of wave ((c)) of Minute degree labeled in black. The invalidation level of the bearish scenario locates at 78.462. 


Categories
Forex Basic Strategies

Learning The ‘Intraday Strategy’ To Trade The Forex Market

Introduction

In today’s article, we present to you a fairly simple but reliable trading strategy that can be used by all types of traders, irrespective of their style. It is believed that when markets are strongly trending in one direction, it gets impossible to catch the stalling point. It is only difficult to catch the ‘top’ or ‘bottom’ of the market, but it also carries a huge amount of risk. We are going to discuss a trading strategy that is contrary to this common belief. We shall try to catch the highest or the lowest point in the market by using some of the most powerful technical indicators and techniques.

Time Frame

The strategy can be used on the 5 minutes, 15 minutes, and 1-hour time frame chart. An intraday trader would apply the strategy on the 5 or 15 minutes chart, whereas a positional trader would open the 1-hour chart.

Indicators

We use the following indicators in the strategy:

  • 5-period Exponential Moving Average (EMA)
  • 10-period Exponential Moving Average (EMA)
  • 14-period Relative Strength Index (RSI)
  • Slow Stochastic Oscillator
  • K and D period – 3

Currency Pairs

This strategy can only be applied on major currency pairs of the forex market. Some of the preferred pairs include EUR/USD, GBP/JPY, GBP/USD, USD/CAD, USD/JPY, EUR/GBP, etc.

Strategy Concept

The rules of the strategy are quite simple and straightforward. We enter the market for a ‘long’ when the 5-period EMA crosses above the 10-period EMA after a prolonged downtrend. But this isn’t enough. Along with this, the RSI should be above the level of 50, and Stochastic slow and fast lines should move in the same direction (upward). Here we need to make sure that the Stochastic does not enter the overbought zone. Similarly, if the 5-period EMA crosses below the 10-period EMA after a prolonged uptrend, we prepare to enter ‘short.’ In this case, the RSI should be below the level of 50, and Stochastic lines should be moving downwards.

We exit the trade when 5-period EMA crosses beyond the 10-period EMA, where this is confirmed by the close of a candle beyond the latter. Another way to exit the trade is when the RSI drops below the 50 level. The several conditions which must be fulfilled in order to execute a trade make the strategy a good filter for trade entries. However, the two EMAs have a drawback as they can get choppy and generate false signals. We can avoid this by carefully monitoring the movement of EMA lines along with the other indicators. When the strategy is executed by following every rule of the strategy, wrong ‘trades’ can be eliminated to a great extent.

Trade Setup

In order to explain the strategy, we have considered the 5 minutes chart of EUR/USD, where we will be illustrating a ‘long’ trade. Here are the steps to execute the strategy.

Step 1: The first step is to identify the trend of the market and plot all the indicators on the chart, as mentioned in the above section. An easier way to identify the trend is by looking at the price concerning 5 and 10 period EMA. If the 5-period EMA is above the 10-period EMA, we say that the market is an uptrend. Whereas, if the 5-period EMA is below the 10-period EMA, the market is said to be in a downtrend.

In the example considered, it clear from the below image that the market is in an uptrend, and at the end, the trend seems to be weakening.

Step 2: This is the most critical step where we combine all the rules of the strategy. Once the trend has been identified, we should wait for a crossover of the 5-period EMA below the 10-period EMA, during the reversal of an uptrend. We say that the market has made a ‘top’ when both RSI and Stochastic lines start moving lower after the crossover. We should make sure that RSI does not move into the oversold zone. In order to catch the reversal of a downtrend, we should see a crossover of the 5-period above the 10-period EMA. At the crossover, the RSI and Stochastic lines should head upwards but so much that they move into the overbought zone.

The below image shows the crossover of both the EMAs that is accompanied by a ‘moving down’ RSI and Stochastic.

Step 3: Let us discuss the ‘entry’ of the strategy. We enter the market after a confirmation candle in the direction of the reversal. That means we enter ‘short’ after the close a bearish candle below both the EMAs. Similarly, we go ‘long’ after the appearance of a bullish candle, where the price closes above both the EMAs.

We can see in the below image that we are entering the market for a ‘sell’ right after at the close of the price below the 10-period EMA.

Step 4: In this step, we determine the stop-loss and take-profit for the strategy. The stop-loss is pretty straight forward where we place it just above the ‘highest’ or ‘lowest’ point. We take our profit and exit the position based on the signal provided by RSI. There two ways to exit the strategy. The first signal provided by the market to exit is when the crossover of the EMAs takes place. The second way to exit is when the RSI starts moving higher and crosses above the level of 50.

In the case of EUR/USD, as shown below, we take our profits when both the indicators indicated a reversal of the trend.

Final Words

The strategy actually generates various entry signals, and each of them can at least result in a profit for scalpers, by running very tight stops and keeping risk low. Thus, the strategy makes a reliable reversal trading system which relatively accurately pinpoints reversal points at the end of a trend and, more importantly, the ability to provide high risk-to-reward (RR) trades.

Categories
Forex Daily Topic Forex Price Action

Double Top/Double Bottom and Intraday Trading

In today’s lesson, we are going to demonstrate an example of a double top that drives the price towards the downside in an intraday chart. The double top/double bottom usually makes the price bearish if they are formed in a major chart. However, they work in the same way in minor charts as well. Let us find out how it drives the price in an H1 chart. Let us get started.

It is an H1 chart. The chart shows that the price makes a long bearish move. The chart belongs to the sellers. The sellers may wait for the price to make a bullish correction and produce a bearish reversal candle at flipped resistance to go short in the pair.

The chart makes a strong bullish move instead, upon producing a bullish engulfing candle. The last candle comes out as a bullish engulfing candle after consolidation. It seems that the buyers are dominating the minor charts.

The price does not continue its bullish move. It has been in long consolidation. The price is roaming around the level of resistance, where it has had a bounce. A bullish breakout may attract the buyers to go long in the pair. On the other hand, a bearish reversal candle at a double top resistance may make the sellers wait to go short in the pair below the neckline.

The chart produces a long bearish candle closing below the neckline. It suggests that the Bear may dominate in the pair. The sellers are to wait for the price to consolidate and produce a bearish reversal candle to go short in the pair. Let us find out what happens.

The next candle comes out as a spinning top closing within the breakout level. It seems that the pair is getting ready to get bearish. The sellers are to keep their close eyes in the pair to get a bearish reversal candle and a breakout at the lowest low to trigger a short entry.

Here it comes. The pair produces a bearish engulfing candle. The candle’s body engulfs the last candle’s body. However, the sellers may wait for the price to make a breakout at the lowest low of the last candle (wick’s lowest low). It is very important as far as intraday trading is concerned.

The price breaches the wick’s lowest low and heads towards the South with good bearish momentum. It travels a long way by offering 1:2 risk-reward. It’s a good thing about intraday trading that it offers good risk-reward.

We have demonstrated an example of a double top driving the price towards the downside in the H1 chart. They work in any time frame from 1M to 1Month. However, it is better not to use it in too minor time frames such as the 1M, 5M, 15M.

Categories
Forex Daily Topic Forex Price Action

Intraday Trading: Watch Out for Highest High/Lowest Low

In today’s lesson, we are going to demonstrate an intraday chart that ends up offering an entry. Intraday trading can be prolific if it is done in the right way. In today’s example, the price heads towards the North by making a good bullish move. It seems that the bull is in control. However, the price gets bearish later and ends up offering entry to the sellers. Let us find out how that happens.

It is an H1 chart. The chart shows that the price makes a good bullish move. The last candle comes out as a hanging man. The price does not make any bearish correction, so the daily candle closes without having an upper shadow. It suggests that the bull may dominate in the pair the next day.

The next day, the price makes a bullish breakout at the last day’s highest high. The pair is trading above the level. Ideally, the price above the last day’s highest high means the bull is in control. However, in this chart, the price does not make any bearish correction before making the breakout. Thus, the buyers are to wait for the price to consolidate and produce a bullish reversal candle to go long in the pair.

The next candle comes out as a bearish engulfing candle. The candle closes below the breakout level. If the level works as a level of resistance, the sellers may come into play and go short in the pair. Let us find out what happens next.

The next candle comes out as a hammer closing within the breakout level. It looks good for the sellers. The sellers may wait for the price to produce a bearish reversal candle and go short below the hammer’s lowest low.

The chart produces a bearish engulfing candle closing below the hammer’s body. The sellers may trigger a short entry below the hammer’s lower shadow. The last day’s lowest low offers the price to travel towards the North with a good reward.

One of the candles comes out as a bearish Marubozu candle closing well below the hammer’s lowest low. The entry may be triggered earlier just by using price breakout. Some traders may wait for a 15M breakout to trigger the entry, and some even wait for an H1 breakout. Ideally, a 15M breakout is good enough to trigger such entry. Traders may set their stop loss above the breakout level since it is the new resistance and Take profit with 2R. If they set the stop loss above the trend’s highest high, they may set take profit at the previous day’s lowest low. Let us find out how the entry goes.

The price heads towards the South with good bearish momentum. It hits 2R in a hurry. The way it has been going, it may hit the previous day’s lowest low soon as well.

To do intraday trading, pay attention to the last day’s highest high and lowest low, breakout, breakout confirmation, and reversal candle. Do some backtesting and then try live trading with a tiny lot at the beginning. Once you have mastered this, it can make your hand full.

Categories
Forex Daily Topic Forex Fibonacci

Intraday Trading: How Fibonacci Levels Help You Determine Entry and Take-Profit Levels

In today’s lesson, we are going to learn an intraday trading strategy using the previous day’s highest high or lowest low. When the price makes a breakout at yesterday’s highest high or lowest low, the price usually trends towards the breakout direction. In today’s lesson, we are going to demonstrate an example of a bearish breakout. After making a bearish breakout at the previous day’s lowest low, the price consolidates and produces a bearish engulfing candle at a significant Fibonacci level. Then, it heads towards the South with good bearish momentum. We try to find out the Fibonacci level where the price trends from as well as the take profit level where the price may make a reversal. Let us proceed.

This is an H1 chart. The chart shows that the price makes a bearish move by producing an ABC pattern. The last candle closes the trading session at the lowest low of the day. The next chart shows that the price consolidates around the lowest low of the previous trading day and makes a good bearish move.

The chart suggests that it becomes intraday sellers’ territory. The sellers may look to go short in the pair. The question is how and when. Let us find these two answers.

The last candle comes out as a bullish candle. Since the chart has been bearish, the sellers may wait for the chart to produce a bearish reversal candle to go short below consolidation support. Here is another equation that they must consider. We will find that out in a minute.

The chart produces a bearish engulfing candle. The sellers may trigger a short entry right after the last candle closes. A question may be raised here that the chart produces a bearish engulfing candle earlier right at the breakout level. We have not concentrated on that to go short from there. However, we have planned to go short right after the last candle closes. What are the reasons behind this? Let us find out how the price reacts after the last candle is produced.

The price heads towards the South with good bearish momentum. The chart produces a bullish reversal candle. It may change its trend or make a bullish correction, at least. For intraday traders, they cannot afford to wait as many pips by waiting to get a bullish reversal candle. They are to close the trade right after the last bearish candle. The question is, how would they know that they should set their take profit at that level?

The answer is Fibonacci levels. Do you remember I was talking about the level for the price to resume its bearish move, we find that out by Fibonacci levels as well. See, the chart produces a bearish engulfing candle at the level of 61.8%, and it hits 161.8%. These are two levels intraday traders must count when a pair trades below the previous day’s lowest low or vice versa. Stay tuned for more lessons for intraday trading with Fibonacci levels.

Categories
Forex Daily Topic Forex Price-Action Strategies

Trading on the Daily Chart More Rewarding Than It Looks

Trading on the daily chart is very rewarding as well as hassle-free comparing to intraday trading. Trade management is different since it allows enough time for the traders to make a decision about their positions. This often allows the traders to earn more pips. In today’s article, we are going to demonstrate an example of price action trading on the daily chart, which allows the traders to hunt some extra pips. We find out how traders do it.

This is a daily chart. It shows that after being bullish for seven trading days, it produces a bearish engulfing candle. The Bearish engulfing pattern is one of the strongest bearish reversal patterns. The sellers are to wait for the price to consolidate and give them a level of resistance where they set Stop Loss above to ensure better risk-reward.

This is what the sellers want to see. The chart produces a bullish inside bar, which states that the sellers may take over the control upon getting another bearish engulfing candle closing below the level of support.

Look at the last candle. It comes out as a bearish engulfing candle closing below the level of consolidation support. The sellers may trigger a short entry right after the candle closes by setting the stop loss above the highest high of the signal candle. To set take profit, some traders may close the trade manually upon getting a bullish reversal candle; some may set at 1:1 risk-reward; some may set at the last significant lowest low. It depends on traders’ psychology and with the strategy (in terms of taking profit) they feel comfortable with.

The price consolidates with one more candle after triggering the entry. However, the price hits the target, which is set at the level of the significant lowest low. As mentioned, some traders may keep holding the position since the price is still with the bear. Let us proceed to the next chart and find out what the price does in the next candle.

It makes a breakout as well. The sellers holding the position may dream big. It seems the price may keep heading towards the South further. This is the good thing about trading on the daily chart. Traders get enough time to decide about their positions. They get 1:1 risk-reward in almost every trade. If they understand daily price action well and get well acquainted with daily trading, it usually gets them very lucrative risk-reward. Imagine, if traders want to manage trade like this on the H4 or the H1 chart, how painful it could be. Moreover, the H4 or the H1 chart is not as consistent as the daily chart. In our fore coming articles, we will demonstrate more examples of how we can maximize our profit by trading on the daily chart. Stay tuned.

Categories
Forex Basic Strategies

Moving Average Strategies: Three Simple Moving Averages Part 1

Moving Average (MA) is the most widely used indicator which has long been used by the traders in the financial markets. It is a trend detecting indicator. Since detecting trends is one of the most important key components of trading, visual representation of a trend by Moving Average makes it be a favorite indicator among the financial traders.

There are multiple Moving Average strategies used by traders. In this lesson, we are going to learn a strategy called “Three SMAs”. It is a strategy with three Simple Moving Averages; these are Simple Moving Average 200, Simple Moving Average 100 and Simple Moving Average 50.

Let us now have a look at how a chart looks like with “Three SMAs”.

This is how the charts look like most of the time. The red one is 200-period Simple Moving Average, the yellow one is the 100-period SMA and the blue one is  50-period SMA. It is better to use different colors so that we can identify them easily.

In the chart above, we see that the price gets caught in between those Moving Averages to start with. The price comes further down, but the 50-SMA stays between the100-SMA and the 200-SMA. What does “Three SMAs” suggest to us here? It suggests that the price does not have a solid trend.

In the naked eyes, the price action suggests that the asset is down-trending. However, by having “Three SMAs”, we can identify solid down-trend has not been established yet. This is why many price action traders use “Three SMA’s” to be sanguine about the trend. Ideally, this is not a chart that we should look for entries.

The question is how a trading chart should look like with “Three SMAs” to look for entries. Let us have a look at the chart below.

The difference is very evident here. See how they have been lined up. Moving Average 200 stays on the top; Moving Average 100 stays in between; Moving Average 50 stays at the bottom. This is an ideal chart with “Three SAM’s” to look for short entries.

In the case of price is up-trending, this is how it looks like.

In a buying market, they are to be lined up just another way round than the selling market. Look at the chart above. The Moving Average 200 stays at the bottom, Moving Average 100 stays in between and Moving Average 50 stays at the top. In this chart, we shall look for long entries.

“Three SMAs” indicators work wonderfully well with intraday trading. In this lesson, we have used a 15-minute chart and three SMAs with periods of 50,100 and 200. If we want to use other charts such as H1 or H4, we have to change the values. However, the best combination for “Three SMAs” is Moving Averages of 50,100 and 200 on the 15M chart.

We now understand how “Three SMA’s” may help us understand the trend.  Thus, “Three SMA’s” may be integrated with any other strategies for taking entries. Moreover, only “Three SMAs” itself offers us entries as well. In our next article, we will demonstrate how entries are to be taken based on “Three SMAs”.  Stay tuned.

Categories
Forex Market Analysis

Forex and Indices – Daily Update 26.07.18


Fundamental Overview


Forex News: The market sentiment of the session was led by the US Dollar (DXY), which advanced against the main currencies group climbing 0.68 per cent. The Dollar boost was aided on the one hand, by the labour market data, in the Thursday session the Initial Jobless Claims data rose 217,000, which despite the increase of 9,000 from the previous week’s revised level, continue showing optimistic levels for the American economy. On the other hand, the ECB interest rate decision continues without changes for the common currency, contributing to the strength in the USD appreciation. The worst performer currency of the session was in the “commodities currencies group”; the Aussie (AUD) fell 1.04 per cent dragged by the dive in Copper price which retraced 1.59 per cent.

Forex News – Daily Performance

Forex News - Daily PerformanceSource: Forex.Academy Collection.


Technical Analysis


EURUSD

EURUSD made a false breakout which could not reach the first daily resistance, turning to the daily pivot and even falling below the weekly pivot point changing the market sentiment from bullish to bearish. For long positions, we need to see the breakout above the bearish breakdown candle at 1.1710, with a first potential profit target placed at the first daily resistance at 1.1756, the second potential target is the confluence level between the second daily resistance and the first weekly resistance at 1.1785. Short positions should be valued as a continuation of the breakdown, with a profit potential target at 1.1615. Pay attention to this area because the confluence with the third daily resistance at 1.16077 could be a potential buy zone.


GBPUSD

The GBPUSD pair in the 30-minutes chart tested the first daily resistance of the intraday trading session at 1.3214, After this, the price made a re-test, from where the pound started to fall and found support in the weekly pivot point at 1.31257. For long positions, the price should break over the daily pivot level at 1.31739 with a potential profit target at 1.3215 (first intraday resistance). Short positions should be valued as the continuation of the previous movement when the price breaks under the weekly pivot level (1.31257) with a potential target in second daily support at 1.31065.


USDCHF

The Swiss currency in the 30-minutes chart continues moving sideways between the first daily support (0.99007) and below the first daily resistance (0.9942). For long positions, the USDCHF should break above the first daily resistance at 0.9942 level with a short-term target at 0.9960 (weekly pivot level); for bearish positions, we need to see that the price to close below the intraday range at 0.9910 with a potential profit target in 0.9877 (first weekly support.)


EURCAD

The EURCAD cross in the 30-minutes chart is moving bearish, testing the second weekly support located at 1.52488. For bullish positions, the price should break and consolidate above 1.5278 with a potential target is at the first weekly support at 1.5325. For bearish positions, as a continuation of the trend, the price could drop to the third weekly support at 1.51778.


GBPCAD

The GBPAUD cross is moving bearish nearly above the first weekly support at 1.71211. For long positions, the price should breakdown candle at 1.7185 with a potential target on the daily pivot level at 1.7232. If we are looking bearish continuation, the price could see the bottom at the 1.70067 level (confluence zone between the third daily support and second weekly support.)


FTSE 100

FTSE 100 in the 30-minutes chart is moving in a narrow range below the daily pivot level (7,669.8 pts) and above the weekly pivot level (7,649 pts.) For bullish positions, the price should break above 7,686 pts, with a potential target on the first weekly resistance at 7,735 pts, which is the convergence zone with the second daily resistance. Bearish positions should be considered if FTSE 100 index breaks below the weekly pivot level at 7,649 with a potential profit target at the first weekly support (7,593 pts.), the second profit target is the HHL at 7,521 pts.


DAX 30

The DAX index 30 in the 30-minutes chart soared to the third daily resistance (12,827 pts), from this zone we have two options. Long positions could extend to the second weekly resistance at 12,912 pts, only if the price breaks above the 12,827 pts. The second option is for short trades; it could be considered if the price breaks below 12,715 pts with a profit target located at 12,604 pts.


Categories
Forex Market Analysis

Forex and Indices – Daily Update – 25.07.18


Fundamental Overview


President Trump will meet with Juncker.

US President Donald Trump will meet with the president of the European Commission, Jean-Claude Juncker, in an attempt to overcome the difficulties in bilateral relations between the United States and the European Union, specifically facing the application of additional tariffs to European cars exported to the United States which Trump seeks to increase.

The European Union applies additional 10 per cent tariffs to automobiles imported from the United States, while the United States applies only 2.5 per cent to European cars. Finally, President Trump commented on his Twitter account that both the United States and the European Union should eliminate all tariffs, barriers and subsidies, making trade between them both more just.


Technical Analysis


Forex Trading Indicators

EURUSD

Forex Trading Indicators: EURUSD continue moving sideways but with an intraday bullish bias. The price continues bouncing from the daily pivot at 1.1684. For intraday positions, long positions should be considered if the price breaks above 1.1710, with a potential profit target placed at the second resistance at 1.1747 and the second potential target in the area between the third daily resistance (1.1777) and the first weekly resistance (1.1785). Short positions should be valued if the pair breaks down the weekly pivot level at 1.1680 with a profit potential target at 1.1615.


GBPUSD

Forex Trading Indicators: The GBPUSD pair, as seen on a 30-minutes chart, broke up and consolidated above the first daily resistance on Tuesday 24th’s trading session. In the current session, the price can not strike above the first intraday resistance (1.3178.) For long positions, the price should break over 1.3175 with a potential profit target at 1.3212 (second intraday resistance). Short positions could be valued when the price breaks under 1.3140 with a potential target in first daily support at 1.3090.


USDCHF

Forex Trading Indicators: The USDCHF pair in the 30-minutes chart is moving sideways between the daily pivot (0.9937) and slightly below the first intraday support (0.9915). For long positions, the Swiss currency should break above the daily pivot level with a short-term target at 0.9960 (weekly pivot level); for bearish continuation, we need to see a price close below the intraday range at 0.9914, the potential profit target is at 0.9887 (third daily support).


EURAUD

Forex Trading Indicators: The EURAUD cross in the 30-minutes chart is testing the confluence between the daily and weekly pivot point at 1.5778. For bullish positions, the price should break above 1.58, and the potential target is at the first intraday resistance (1.5829). Bearish positions should be considered if the cross breaks under 1.5717 with a profit target in the confluence zone between the first weekly support (1.56735) and the second daily support (1.56612).


GBPAUD

Forex Trading Indicators: The GBPAUD cross is running sideways between 1.7680 and 1.7794. For long positions, the price should break above 1.7778, and its potential target is slightly above the first weekly resistance at 1.7858. In the case of short positions, the price should break down 1.7680, with a potential target at 1.7589 level.


FTSE 100

Forex Trading Indicators: The FTSE 100 in the 30-minutes chart turned bearish moving from the daily pivot at 7,699 to the weekly pivot level (7,649.9). For bullish positions, the price should break above 7,700 pts, with a potential target at 7,791 pts, which is the convergence zone between the second weekly resistance level and the second daily resistance. Bearish positions should be valued if the British index breaks under the weekly pivot level at 7,649 with a potential profit at the first weekly support (7,593 pts.), the second profit target is the HHL at 7,521 pts.


DAX 30

Forex Trading Indicators: DAX 30 in the 30 minutes chart. After failing the test to the first weekly resistance (12,737.1 pts.), the German index moves bearish below the daily and weekly pivot level turning to bearish the market sentiment. For long positions, we need to see the breakout above 12,600 pts with a potential target in the re-test of the first weekly resistance at 12,737 pts. A short position is considered if the price breaks down 12,537, and its potential target is the second weekly support at 12,293 pts with extension in the HHL at 12,143 pts.