Categories
Forex Daily Topic Forex Price Action

Trading Within Last Weekly Range

In today’s lesson, we will demonstrate an example of a chart where the price is having a retracement within the last weekly range. The price produces a double bottom and makes a breakout at the neckline. It then consolidates but does not head towards the North as it normally does when it makes a breakout at weekly high/low. Let us proceed and find out the possible reason behind it.

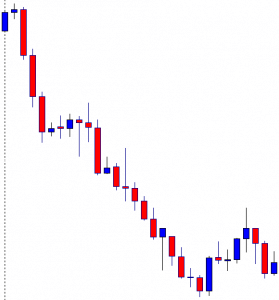
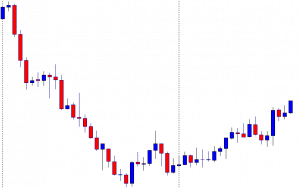
The price makes a long bearish move and finds its support. Upon producing a bullish engulfing candle, it heads towards the North and comes back again. At the support zone, it produces a bullish inside bar. Let us see what happens next.

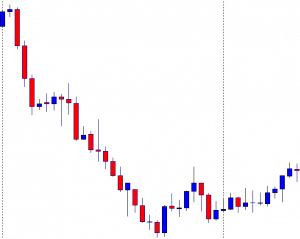
The price heads towards the North next week. It means it is trading within the last week’s range. The price is at the last swing high. If it makes a bullish breakout, the buyers may want to go long at its weakness.

The chart produces two bearish candles followed by a bullish engulfing candle closing within the last swing high. It seems that the price may consolidate more to find its way.

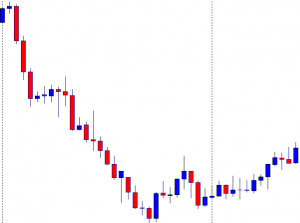
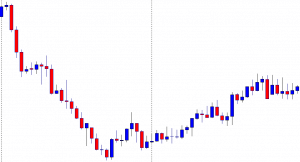
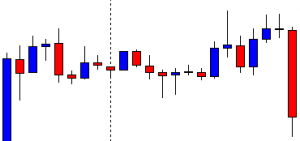
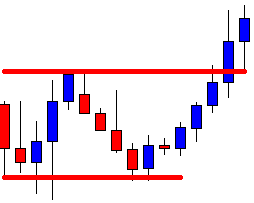
The price upon producing a spinning top followed by a bullish engulfing candle makes a bullish breakout at the last swing high. It is a neckline breakout of a double bottom. The buyers may keep their eyes on the chart to go long on its weakness.

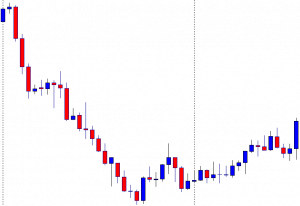
The price produces a bearish inside bar followed by a spinning top with a bullish body. Then, it produces a bullish candle closing above consolidation resistance. Since it is a breakout at the resistance, it is supposed to be a buy signal. The question is whether the buyers should trigger a long entry or not. Let us see the next chart.

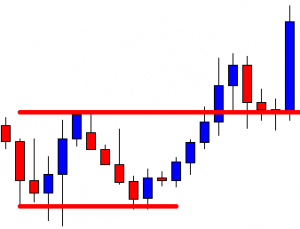
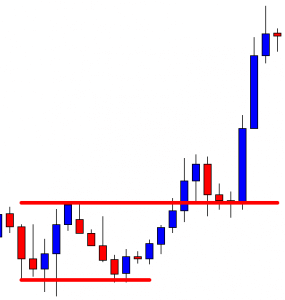
The price gets choppy, struggling to make a breakout towards the North. The buyers would not love to see such price action after triggering the entry. If the price makes a breakout at the last week high/low, traders wait for the price to consolidate and produce a bullish/bearish reversal candle to take entry upon a breakout. On the other hand, if the price trades within last week’s range, the price usually makes retracement (instead of consolidation) to offer entry. The Fibonacci level, such as the 38.2% and 61.8%, play a significant role in producing the reversal candle. In today’s chart, the price is in the weekly range. Thus, traders are to wait for the price to make a retracement to offer them entry. It rather consolidates, which ends up making the price choppy.

Categories
Forex Daily Topic Forex Price Action

Double Top/Double Bottom and Intraday Trading

In today’s lesson, we are going to demonstrate an example of a double top that drives the price towards the downside in an intraday chart. The double top/double bottom usually makes the price bearish if they are formed in a major chart. However, they work in the same way in minor charts as well. Let us find out how it drives the price in an H1 chart. Let us get started.

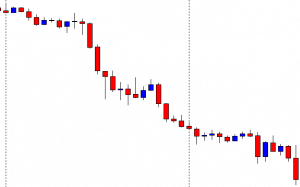
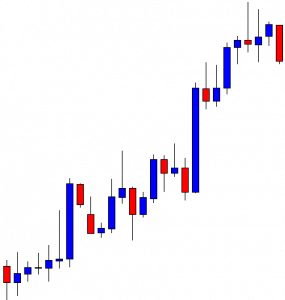
It is an H1 chart. The chart shows that the price makes a long bearish move. The chart belongs to the sellers. The sellers may wait for the price to make a bullish correction and produce a bearish reversal candle at flipped resistance to go short in the pair.

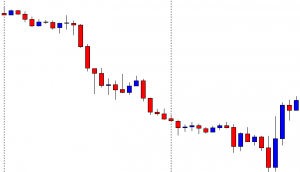
The chart makes a strong bullish move instead, upon producing a bullish engulfing candle. The last candle comes out as a bullish engulfing candle after consolidation. It seems that the buyers are dominating the minor charts.

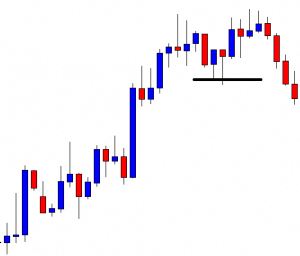
The price does not continue its bullish move. It has been in long consolidation. The price is roaming around the level of resistance, where it has had a bounce. A bullish breakout may attract the buyers to go long in the pair. On the other hand, a bearish reversal candle at a double top resistance may make the sellers wait to go short in the pair below the neckline.

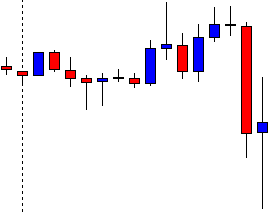
The chart produces a long bearish candle closing below the neckline. It suggests that the Bear may dominate in the pair. The sellers are to wait for the price to consolidate and produce a bearish reversal candle to go short in the pair. Let us find out what happens.

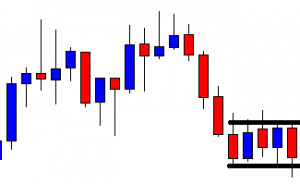
The next candle comes out as a spinning top closing within the breakout level. It seems that the pair is getting ready to get bearish. The sellers are to keep their close eyes in the pair to get a bearish reversal candle and a breakout at the lowest low to trigger a short entry.

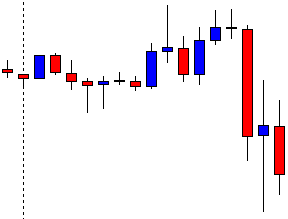
Here it comes. The pair produces a bearish engulfing candle. The candle’s body engulfs the last candle’s body. However, the sellers may wait for the price to make a breakout at the lowest low of the last candle (wick’s lowest low). It is very important as far as intraday trading is concerned.

The price breaches the wick’s lowest low and heads towards the South with good bearish momentum. It travels a long way by offering 1:2 risk-reward. It’s a good thing about intraday trading that it offers good risk-reward.

We have demonstrated an example of a double top driving the price towards the downside in the H1 chart. They work in any time frame from 1M to 1Month. However, it is better not to use it in too minor time frames such as the 1M, 5M, 15M.

Categories
Forex Daily Topic Forex Price Action

A Classic Example of Trading on a Double Top

Last week, in one of our lessons, we showed an example of how the price gets bullish based on the double bottom and flipped support. In today’s lesson, we are going to demonstrate an example of a double top and flipped resistance. a Double Top is the opposite of a Double Bottom, so it drives the price towards the South. It is one of the strongest bearish reversal patterns. Traders love to go short when a chart produces a double top in the Forex market. Let us now proceed and find out how it usually works.

The chart shows that the price heads towards the North and finds its resistance. It produces a bearish engulfing candle. Sellers on the minor chart may look to go short in the chart. However, the sellers in this chart may wait for either the price consolidates and makes a bearish breakout or to produce a double top.

The price finds its support and heads towards the level of resistance again. It consolidates around the level of resistance. A bearish reversal candle followed by a breakout at the last support may attract the sellers to go short in the pair since the chart would produce a double top, and the breakout would be a neckline breakout.

Here it goes. The price heads towards the South with good bearish momentum. It makes a breakout at the neckline and produces one more bearish candle. The sellers are going to wait to go short in the pair below the lowest low. However, it is best to wait for the price to consolidate around the breakout level and produce a bearish reversal candle to get a better risk-reward.

The price consolidates around the breakout level and produces a bearish engulfing candle at the breakout level. The sellers may go short below consolidation’s support by setting stop-loss above consolidation’s resistance and by setting a take-profit target with 1R at least. Please note, a double bottom/double top and consolidation around the neckline breakout level usually offers more than 1R. Let us find out how the trade goes.

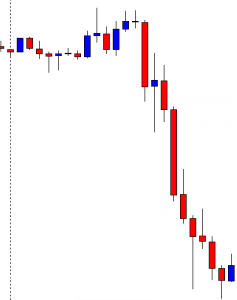
The price heads towards the downside with extreme bearish momentum. It produces an inverted hammer. The price may make a bullish correction from here. Count the length that the price has traveled so far. It has traveled a long way offering about 6R to the sellers. One trade like this in a week may make a trader fulfilled. Thus, keep your eyes on patterns such as the Double Top/Double Bottom. Remember the procedure; wait for the price to consolidate and produce a reversal candle at the breakout level; trigger an entry below consolidation support/resistance, and manage your trade accordingly.

Categories
Forex Daily Topic Forex Price Action

The Double Bottom and the Flipped Level of Support

In today’s lesson, we are going to demonstrate an example of a double bottom, which pushes the price towards the North. The example also proves an old theory of support becomes resistance or resistance becomes support after a breakout. Let us get started.

The chart shows that the price makes a bearish move and finds its support. The level of support produces a bullish candle, which is followed by two more bullish candles. The buyers may wait for the price to consolidate and produce a bullish reversal candle to go long in the pair.

The price makes a long bearish correction. It comes back to the level of support again. A bearish breakout may attract the sellers to go short and drive the price towards the South. On the other hand, the buyers may wait to get a bullish reversal candle at its second bounce.

The chart produces a bullish engulfing candle. Since it is produced at the second bounce, the buyers in the chart may wait for the price to make a breakout at the neckline and go long.

The price heads towards the North with good bullish momentum. It makes a breakout at the neckline and trades above the level for one more candle. The buyers would love to see the price to consolidate or make a bearish correction at the breakout level and produce a bullish reversal candle to trigger a long entry.

The price makes a bearish correction and produces a bullish engulfing candle closing above the level of resistance. The buyers may trigger a long entry right after the last candle closes by setting Stop Loss below the candle’s lowest low and by setting Take Profit with 1R. Here we must notice that the neckline level becomes the level of support. This is one of the most reliable theories in the financial market.

The price heads towards the North with extreme bullish momentum. It hits 1R in a hurry and travels towards the North further. The last candle comes out as a hanging man, which is a bearish reversal candle. However, it is not a strong one. The price may keep traveling towards the North. Anyway, the buyers achieve their target with the entry, which is taken on two theories.

  1. Double Bottom- A very strong bullish reversal pattern
  2. Resistance works as a level of support after the breakout.

In the case of a double bottom and neckline breakout, we may sometimes find that the price does not come at the breakout level. It consolidates well above and makes a bullish move. In some cases, the price may not hit the target. However, if the price comes and produces a bullish reversal candle at the breakout level, the price may hit the target in most of the cases.

Categories
Forex Basic Strategies

Profiting From The Rounding Top & Rounding Bottom Forex Pattern.

Introduction

The Rounding Top and Rounding Bottom are two of the most famous trend reversal patterns in the Forex trading industry. These patterns are mostly used to catch the end of a trend in both bullish and bearish markets. These patterns are extremely reliable as they are back-tested rigorously by a number of professional technical traders. Learning the trading of these patterns introduces us to a lot of trading opportunities while riding a brand new trend. Always remember that the Rounding top pattern appears at the top of an uptrend, and the Rounding Bottom pattern appears at the bottom of a downtrend.

Rounding Top

The Rounding Top pattern appears to be in the form of an inverted ‘U’ shape. Hence it is also referred to as an ‘Inverse Saucer.’ This pattern resembles the Double Top chart pattern but a bit more complex than that. Most of the time, the Rounding Top appears at the major resistance level on a price chart. This pattern has three major components – A rounding shape where the price action fails to print a higher high, a taper off, and the beginning of the lower trend.
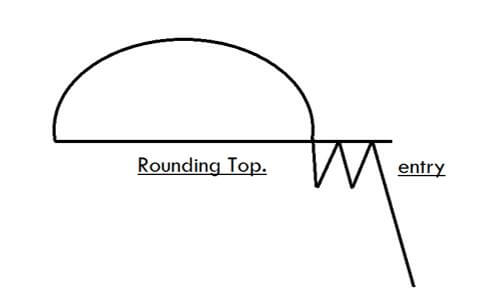
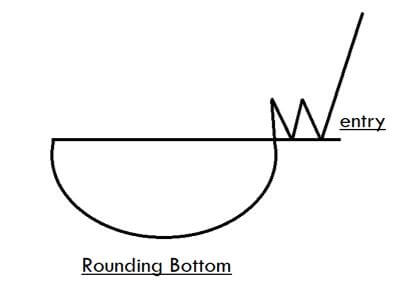
Rounding Bottom 

The Rounding Bottom is a bearish reversal chart pattern, and it appears at the end of a downtrend, indicating a long term reversal in the price action. This pattern resembles the Cup and Handle pattern, but it doesn’t go through the temporary downward trend of the handle portion. This pattern can be found at the major support area in any trading timeframe. Just like the Rounding Top, this pattern also has three major components –  The Rounding Shape, where the price action fails to print a brand new lower low, taper off, and the beginning of an uptrend.
Trading The Rounding Top Pattern

The below CAD/CHF charts represents the formation of a Rounding Top pattern in this Forex pair.
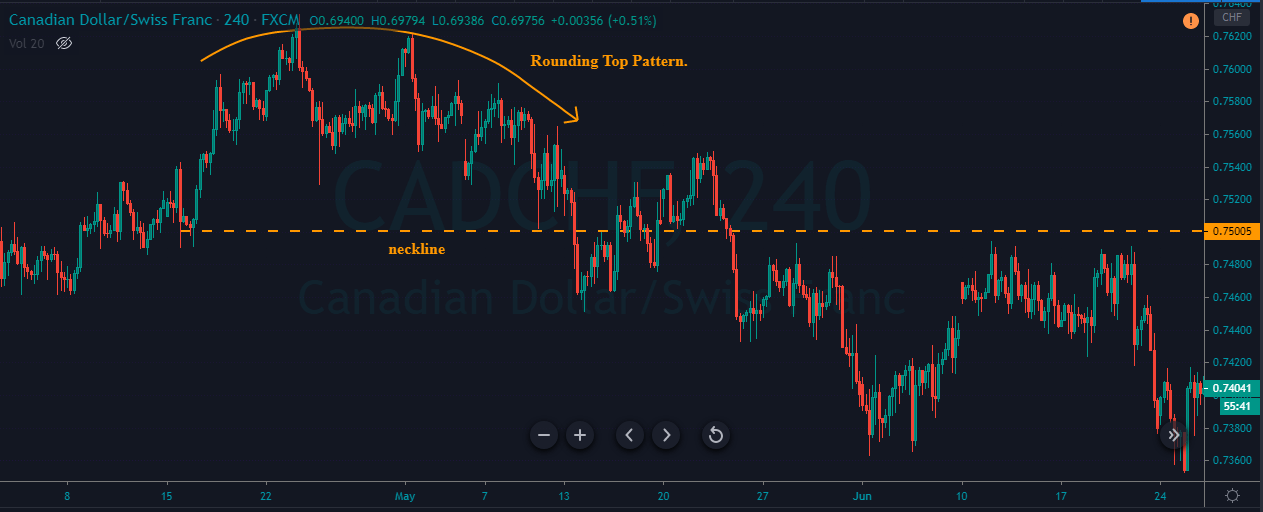
We had decided to go short as soon as the pattern is confirmed when the price reached the neckline. The bear candles on the price chart were stronger than the bull candles indicating the gaining strength of sellers in the market. The sell trade is activated when the price goes below the neckline. Stop-loss is placed just above the region where the pattern is formed.
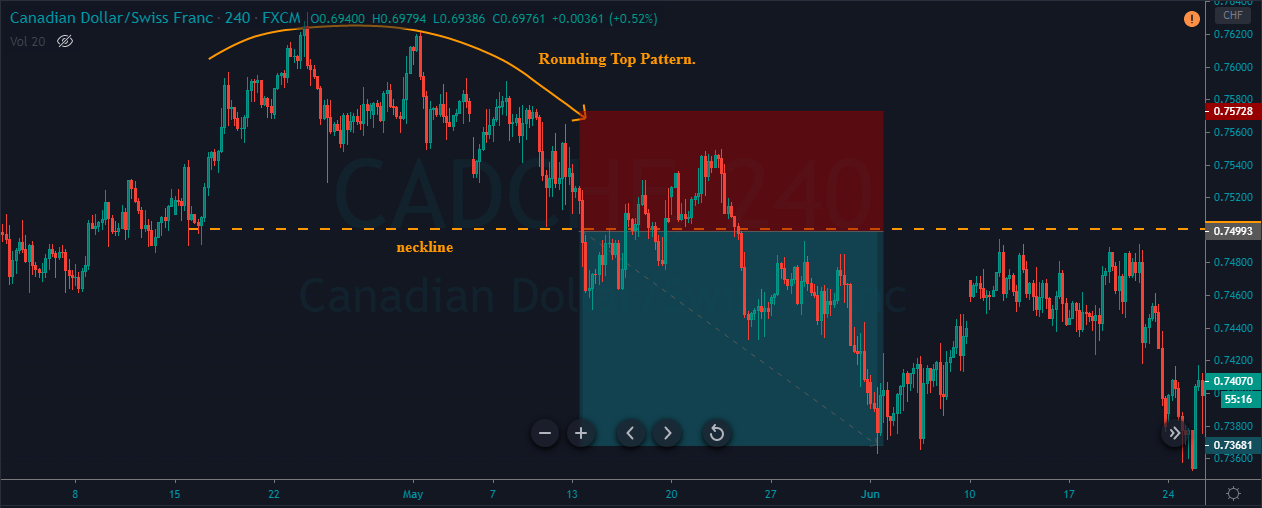
After activating the trade, price action didn’t blast to the south immediately. Instead, it pulled back to buy-side, before eventually going down. In this kind of situation, most of the traders doubt their strategy and exit their positions because of fear. But since our analysis is strong enough, it is a good idea to hold our positions and wait for the price to move in our direction.

Trading The Rounding Bottom Pattern

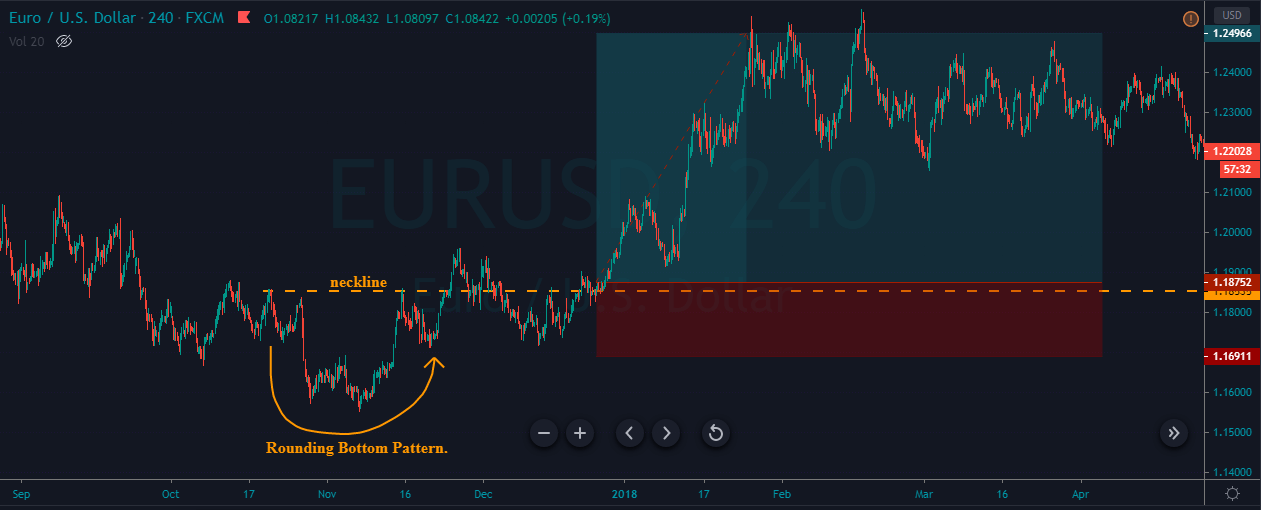
The below EUR/USD, 240 Minutes chart, represents the formation of the Rounding Bottom pattern on the price chart. We can see the market being in a downtrend when the Rounding Bottom pattern is formed. This is a clear indication for us to understand that the bears are losing momentum, and bulls are about to take over the market. We took a buy-entry when the price went above the neckline. The take-profit was placed at the higher timeframe’s significant resistance area.
Rounding Top Pattern + RSI Indicator

In this strategy, we have paired the Rounding Top pattern with the RSI indicator to identify accurate trading signals. As we all know, the RSI is a momentum indicator that measures the magnitude of the price change. RSI stands for Relative Strength Index, and it is developed, J. Welles Welder.

This indicator oscillates between the 0 and 100 levels. When RSI reaches the 70 level, it indicates overbought market conditions, and we must expect a downside reversal. Likewise, when it reaches the 30 level, it indicates the oversold conditions, and we must expect a buy-side reversal.

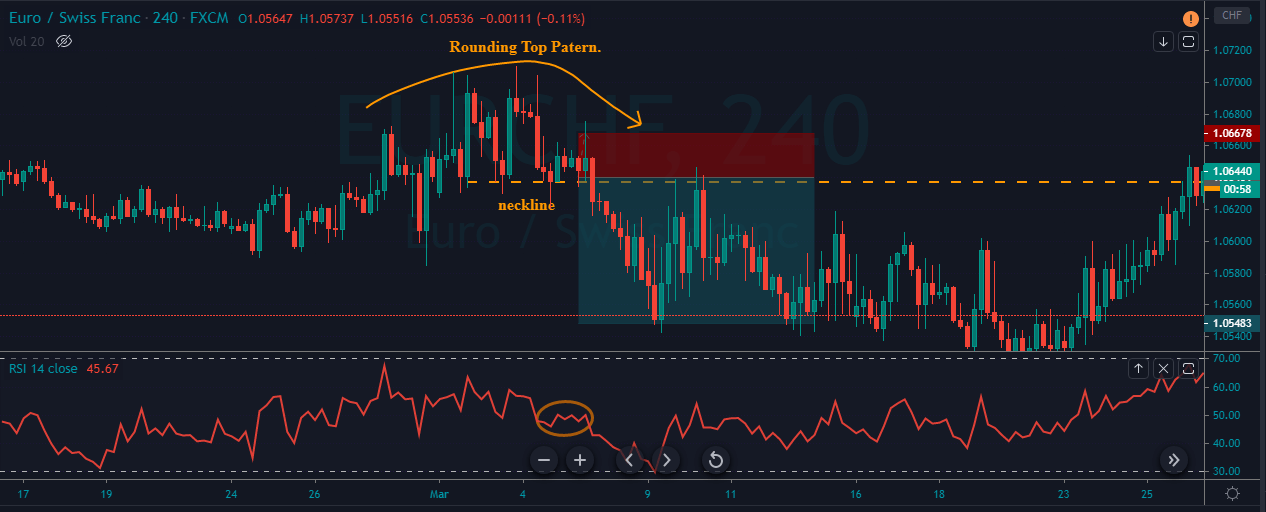
The strategy is simple –  Identify the Rounding Top pattern and see if the price action is going below the neckline. If yes, check where the RSI indicator is. If it is in the overbought area, it is a clear indication for us to go short.

The below price chart represents the formation of the Rounding Top pattern on the EUR/CHF Forex pair.
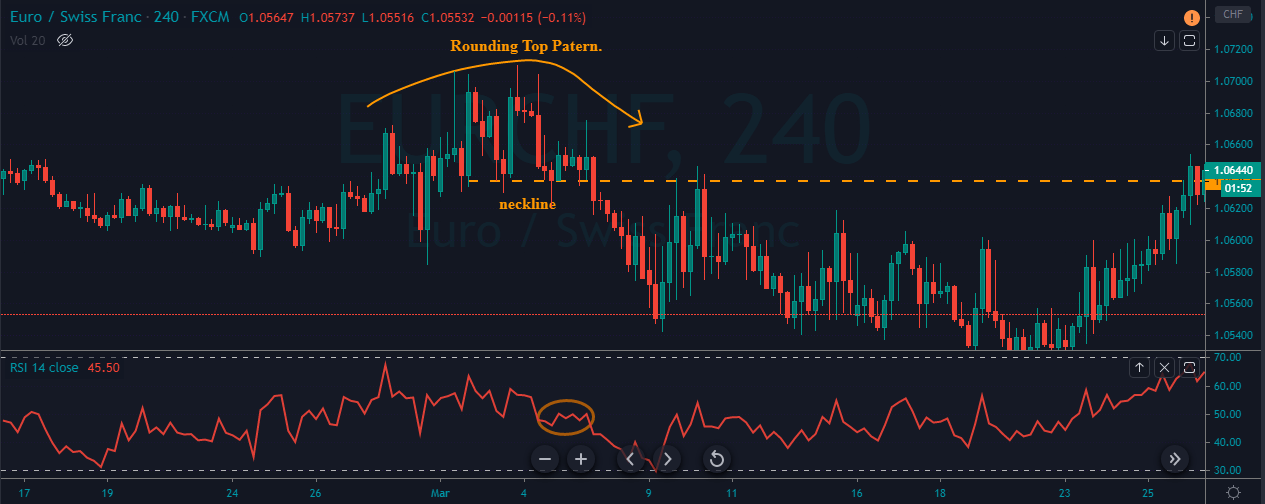
In the below chart, we can see the price going below the neckline. At the same time, RSI gave a reversal at the overbought area, indicating us to go short in this pair. We have activated the trade at the neckline, and the stop-loss placement was above the most recent higher low. We had closed our positions when the price action started to struggle at the Bottom.
Rounding Bottom Pattern + RSI Indicator

The below chart represents the formation of the Rounding Bottom pattern on the NZD/CAD Forex pair.
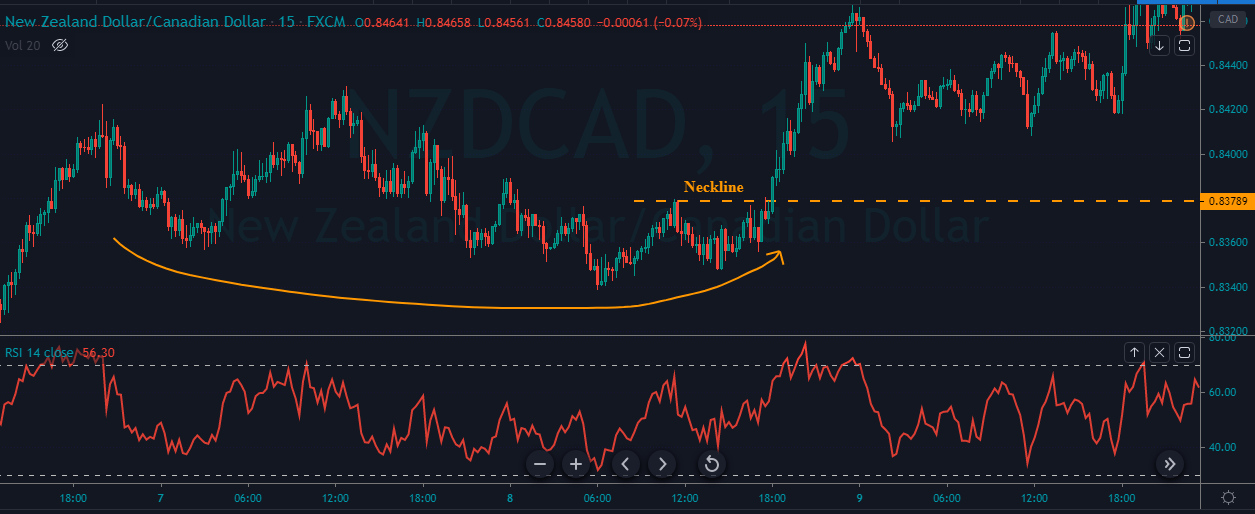
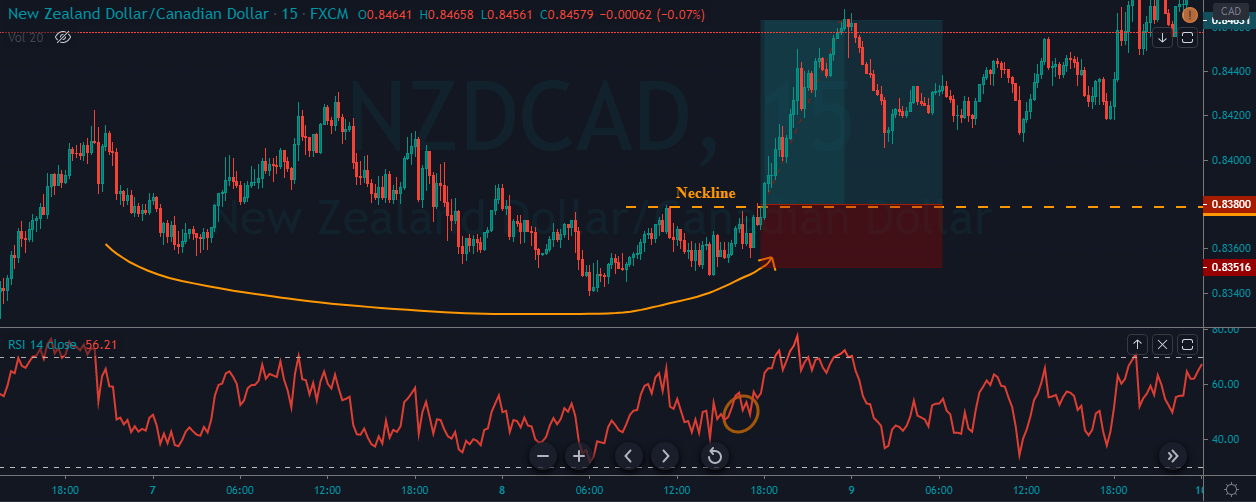
We had gone long when the price broke the neckline, and the RSI gave a reversal at the oversold area. As you can see in the chart below, right after our buy activation, the price smoothly blasted to the north. We booked our whole profits when the price reached a significant resistance area. Stop-loss was just below our entry as the neckline acts as a strong support to the price action.
Conclusion

The Rounding Top and Bottom are bullish and bearish reversal patterns that are used to identify the end of an ongoing trend. You need to know that you must wait for the breakout of the neckline to take long or short positions according to the pattern formed. The stop-loss can be placed above the neckline when trading the Rounding Top and below the neckline when trading the Rounding Bottom pattern.

The take-profit must be equal to the size of the pattern formed, and if the trend is strong enough, consider going for deeper targets. Overall, these patterns are quite popular and easy to spot on the price chart. Practice trading these patterns using a trading simulator or a demo account before applying these strategies on live accounts.

We hope you find these strategies informative. If you have any questions, make sure to let us know in the comments below. Cheers.