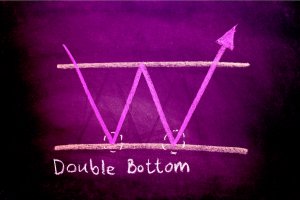
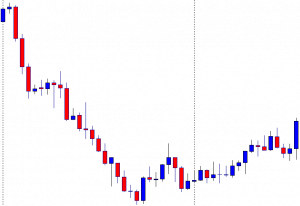
In today’s lesson, we will demonstrate an example of a chart where the price is having a retracement within the last weekly range. The price produces a double bottom and makes a breakout at the neckline. It then consolidates but does not head towards the North as it normally does when it makes a breakout at weekly high/low. Let us proceed and find out the possible reason behind it.

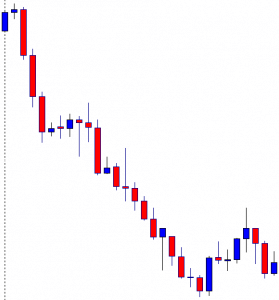
The price makes a long bearish move and finds its support. Upon producing a bullish engulfing candle, it heads towards the North and comes back again. At the support zone, it produces a bullish inside bar. Let us see what happens next.
The price heads towards the North next week. It means it is trading within the last week’s range. The price is at the last swing high. If it makes a bullish breakout, the buyers may want to go long at its weakness.
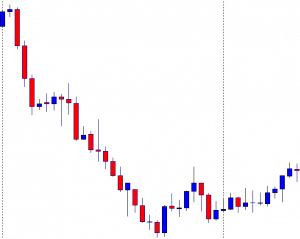
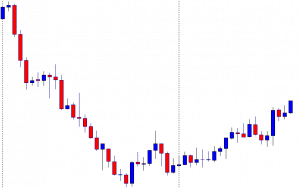
The chart produces two bearish candles followed by a bullish engulfing candle closing within the last swing high. It seems that the price may consolidate more to find its way.
The price upon producing a spinning top followed by a bullish engulfing candle makes a bullish breakout at the last swing high. It is a neckline breakout of a double bottom. The buyers may keep their eyes on the chart to go long on its weakness.
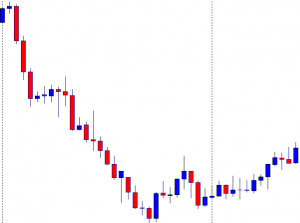
The price produces a bearish inside bar followed by a spinning top with a bullish body. Then, it produces a bullish candle closing above consolidation resistance. Since it is a breakout at the resistance, it is supposed to be a buy signal. The question is whether the buyers should trigger a long entry or not. Let us see the next chart.
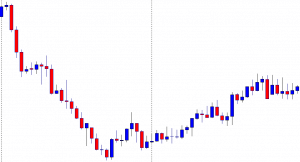
The price gets choppy, struggling to make a breakout towards the North. The buyers would not love to see such price action after triggering the entry. If the price makes a breakout at the last week high/low, traders wait for the price to consolidate and produce a bullish/bearish reversal candle to take entry upon a breakout. On the other hand, if the price trades within last week’s range, the price usually makes retracement (instead of consolidation) to offer entry. The Fibonacci level, such as the 38.2% and 61.8%, play a significant role in producing the reversal candle. In today’s chart, the price is in the weekly range. Thus, traders are to wait for the price to make a retracement to offer them entry. It rather consolidates, which ends up making the price choppy.