
The trend is traders’ friend. Breakout is traders’ best friend. In today’s lesson, we are going to demonstrate an example of an H1 breakout, which makes a reversal even in the daily chart. Thus, the price heads towards the breakout direction with good momentum ending up offering an excellent reward. Let us get started.

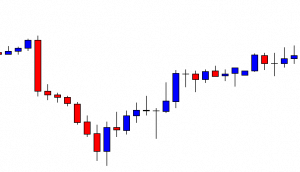
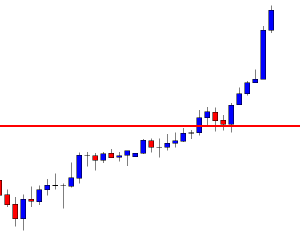
The chart shows that the price makes a strong bearish move and finds its support. Upon producing a bullish engulfing candle, the price heads towards the North at a moderate pace. The price does not make a breakout at the last swing high. Thus, the chart is still bearish biased. Please note, the H1 chart does not show, but the daily trend has been bearish in this chart.
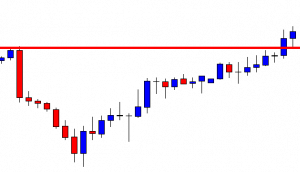
The chart shows that one of the candles breaches through the last swing high, closing well above the level. The last candle comes out as a bullish candle as well. It confirms the breakout. The buyers may wait for the price to consolidate and get a bullish reversal candle to go long in the pair.
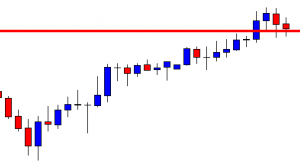
The last two candles come out as bearish candles. The spinning top closes within the level of support. If the level produces a bullish engulfing candle, the buyers may go long in the pair.
The last candle comes out as a bullish engulfing candle closing well above consolidation resistance. The buyers may trigger a long entry right after the candle closes by setting stop loss below the level of support and by setting take profit with 1R.
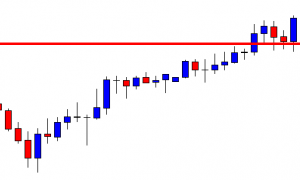
The price heads towards the North with extreme bullish momentum. The way the chart looks, it seems it may continue its journey for a while. The chart shows that the buyers achieve their target within the next two candles after triggering the entry. Let us proceed to the following chart to see what the price does.
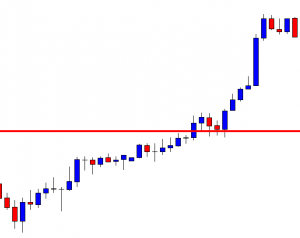
The last candle comes out as a bearish engulfing candle. It is produced at the second rejection as well. This means the chart forms a double top here. A double top resistance forming a bearish engulfing candle suggests that the price may make a bearish move here. However, if we calculate the length of the bullish move, it ends up being a very good one. This is what usually happens when the price makes a breakout at the last daily candle’s highest high when the daily chart is bearish and if the breakout takes place at the lowest low when the daily trend is bullish. Make sure the price consolidates and produces a strong reversal candle at the breakout level. If that happens, it often ends up offering an excellent reward in the end.