
The cryptocurrency market had quite a slow day and closed to no movement in the past 24 hours. Bitcoin is currently trading for $9,243, which represents an increase of 0.59% on the day. Meanwhile, Ethereum gained 0.56% on the day, while XRP gained 0.74%.


Daily Crypto Sector Heat Map
When talking about top100 cryptocurrencies, Kava gained 20.77% on the day, making it by far the most prominent daily gainer. Syntherix Network (16.17%) and Waves (15.28%) also did great. On the other hand, Nexo has lost 12.73%, making it the most prominent daily loser. It is followed by Ravencoin’s loss of 8.11% and The Midas Touch’ loss of 6.75%.
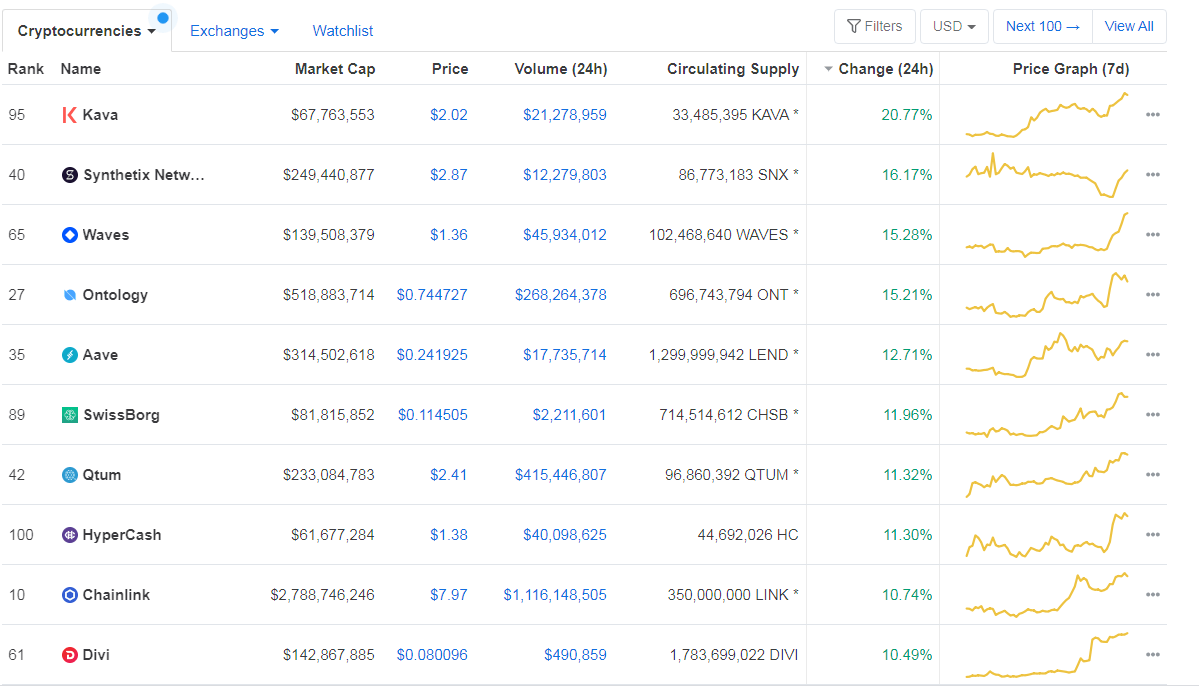
Top 10 24-hour Performers (Click to enlarge)
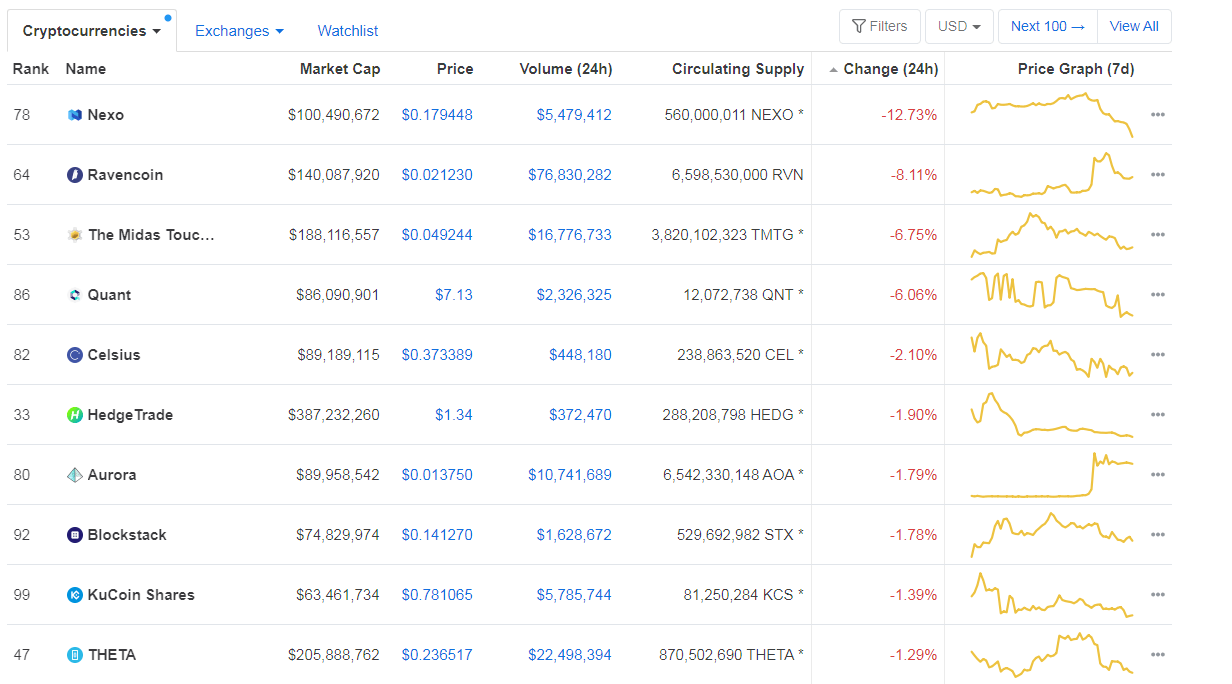
Bottom 10 24-hour Performers (Click to enlarge)
Bitcoin’s dominance level decreased slightly since we last reported, with its value currently at 63%. This value represents a 0.27% difference to the downside when compared to yesterday’s value.
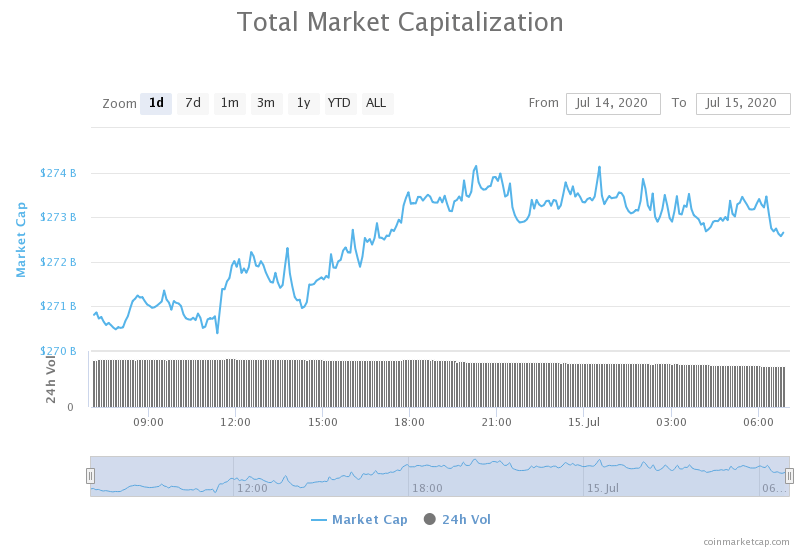
Daily Crypto Market Cap Chart
The cryptocurrency market capitalization increased slightly when compared to when we last reported, with the market’s current value being $272.66 billion. This value represents an increase of $1.79 billion when compared to the value it had yesterday.
_______________________________________________________________________
What happened in the past 24 hours?
_______________________________________________________________________
- Bitcoin’s correlation with gold is critical as fears of a stock market collapse grow (Cryptoslate)
- Fidelity Investments invests big in Bitcoin mining as institutions want crypto (Cryptoslate)
- Bitcoin mining difficulty reaches historic highs—and analysts say it’s bullish (Cryptoslate)
- Darknet use of bitcoin mixers surged in 2020’s first quarter: report (The Block)
- Binance’s crypto payments card to debut in Europe starting next month (The Block)
- European Investors Outpace Americans in Race to Bitcoin, but That May Soon Change (Cryptobriefing)
- Zcash Surges 25%, Get Ready for a Nosedive (Cryptobriefing)
- Bank of England mulls digital currency as Chinese efforts surge (Cryptoslate)
- Former Chinese Official Says CBDC Will Pave Way for Digital Stocks (Cointelegraph)
- Japanese Banking Giant to Issue Its Own Stablecoin in Late 2020 (Cointelegraph)
_______________________________________________________________________
Technical analysis
_______________________________________________________________________
Bitcoin
The largest cryptocurrency by market capitalization had quite a slow day. While its price went above the descending resistance line, the price itself did not move that much. On top of that, the move seemingly got stopped by the $9,251 resistance level (at least for now). The decreasing volume while being stopped by both moving averages and the resistance level suggests that the move reached exhaustion and that $9,251 will not be tackled (in the very near future).
BTC traders should look for a trade opportunity after the largest cryptocurrency passes $9,251.
BTC/USD 4-hour Chart
Technical factors:
- Price is below its 50-period EMA and its 21-period EMA
- Price right below the middle B.B. (20-period SMA)
- RSI neutral (48.17)
- Increased volume (Coming back to normal)
Key levels to the upside Key levels to the downside
1: $9,251 1: $9,120
2: $9,580 2: $8,980
3: $9,735 3: $8,820
Ethereum
Ethereum was even less volatile than Bitcoin, with its price hardly even moving throughout the day. The second-largest cryptocurrency by market capitalization spent the day sitting on the $240 level while the bears and bulls were fighting on whether the price will consolidate below or above it. The volume dwindled as time passed, and ETH seems like it has more chance of remaining under $240. However, there is still a chance for bulls to win.
Ethereum traders should look for an opportunity after the fight for $240 ends.
ETH/USD 4-hour Chart
Technical Factors:
- Price above the 50-period EMA and below the 21-period EMA
- Price below the middle B.B. (20-period SMA)
- RSI neutral (48.14)
- Increased volume (Coming back to normal)
Key levels to the upside Key levels to the downside
1: $240 1: $228
2: $251.4 2: $225.4
3: $260 3: $218
Ripple
The third-largest cryptocurrency by market cap hardly moved at all after the price drop of July 13, which brought the price below the $0.2 threshold yet again. XRP is hovering below the $0.2 level for two days now, without any possibility of breaking it yet.
XRP traders can look for an opportunity to trade when the volume increases, and the trend becomes clear enough, as the low volume and volatility are certainly not ideal for trading at the moment.
XRP/USD 4-hour Chart
Technical factors:
- XRP in a mid-term descending trend (though it broke the trend in the short-term)
- XRP lacks strong support levels below $0.178
- Price above 21-period and below the 50-period EMA
- Price right under the middle B.B. (20-period SMA)
- RSI is neutral (46.8)
- Volume lower than average
Key levels to the upside Key levels to the downside
1: $0.205 1: $0.2
2: $0.214 2: $0.19
3: $0.227 3:$0.178
Related posts
 Daily Crypto Review, May 28 – “We Are All Satoshi” – Craig Wright Exposed?
 Daily Crypto Review, Sept 23 – Gold Pushing BTC Towards $9,500; XRP Bears Taking Over
 Daily Crypto Review, Sept 28 – XRP Exiting Bearish Structure and Aiming for $0.245; Bitcoin Eyeing $11,000
 Daily Crypto Review, Sept 30 – Goldman Sachs Entering the Crypto Sector; Bitcoin Prepares for a Move