The cryptocurrency sector has stayed at virtually the same spot since our last report. Bitcoin is currently trading for $10,688, representing a decrease of 0.07% on the day. Meanwhile, Ethereum gained 0.18% on the day, while XRP lost 0.95%.


Daily Crypto Sector Heat Map
If we look at the top100 cryptocurrencies and their gains and losses, The Midas Touch Gold gained 21.5% on the day, making it the most prominent daily gainer. Zilliqa (14.64%) and Energy Web Token (11.71%) also did great. On the other hand, DeFi projects took a hit as UMA lost 10.9%, making it the most prominent daily loser. It is followed by yearn.finance’s loss of 7.8% and OMG Network’s loss of 6.4%.
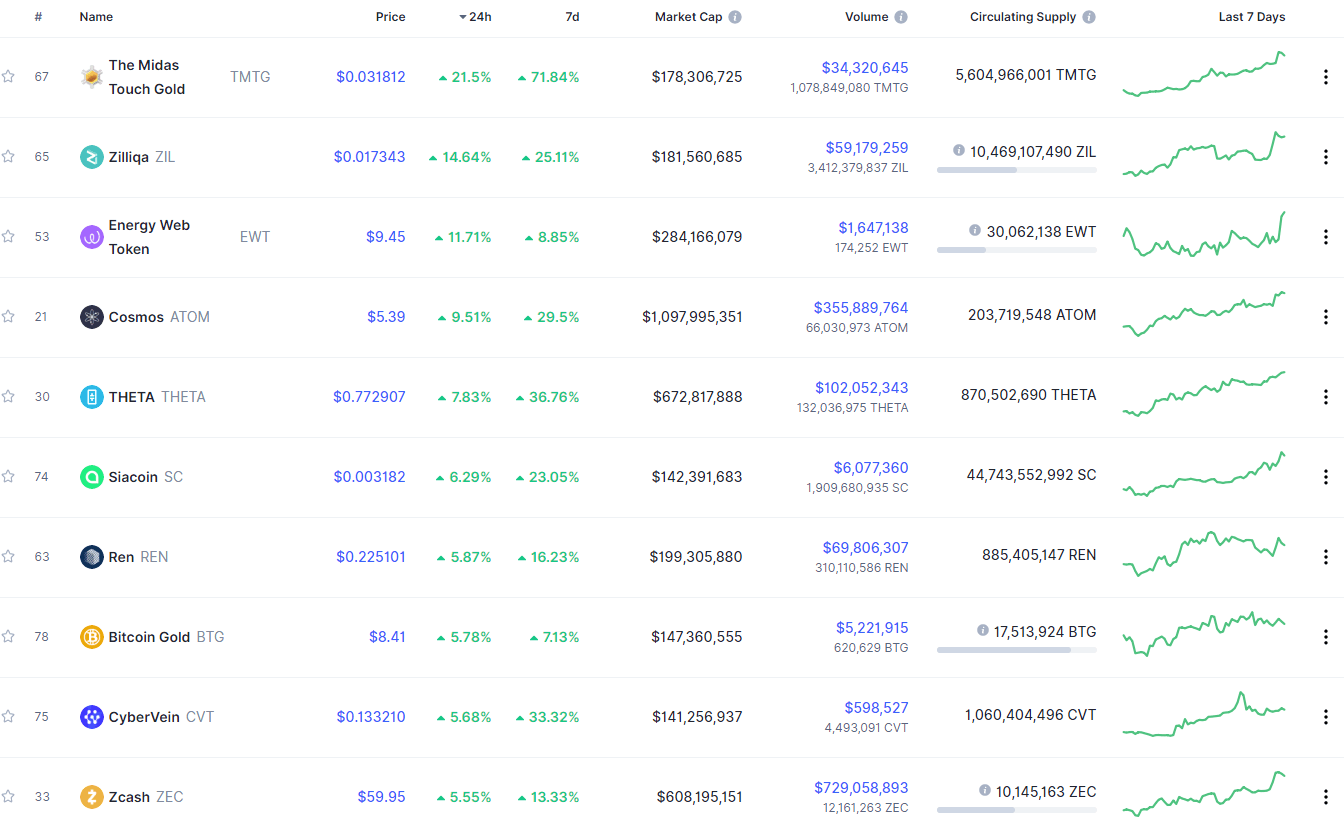
Top 10 24-hour Performers (Click to enlarge)

Bottom 10 24-hour Performers (Click to enlarge)
Bitcoin’s level of market dominance stayed at the same spot since our last report, with its value currently being at 60.48%. This value represents a 0.02% difference to the upside when compared to when we last reported.
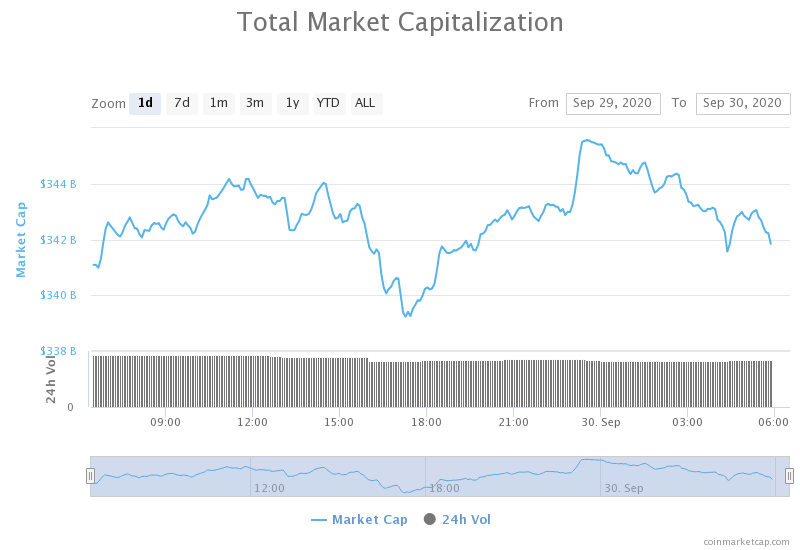
Daily Crypto Market Cap Chart
The crypto sector capitalization has gained in value over the course of the past 24 hours. Its current value is $344.44 billion, which represents an increase of $0.55 billion when compared to our previous report.
_______________________________________________________________________
What happened in the past 24 hours?
_______________________________________________________________________
- 93% of the top 250 coins have declined in price in September (Cointelegraph)
- Data shows over 100 million unique users now have Bitcoin and crypto accounts (Cryptoslate)
- DeFi darling Yearn.finance (YFI) deployed a new token—then $15m was stolen (Cryptoslate)
- Coinbase offers exit package for employees not comfortable with its mission (The Block)
- Goldman Sachs looking to round out digital assets team with new international hires (The Block)
- Technicals and On-Chain Metrics Spell Trouble for Ethereum (Cryptobriefing)
- Shielded Zcash Withdrawals on Gemini Aren’t All That Private (Cryptobriefing)
- Reddit’s MOON Cryptocurrency Now Has Cash Value (Cryptobriefing)
- Traders Rotate to Bitcoin Expecting a Quiet Q4 for Altcoins (Coindesk)
- Coinbase Launches 5% Staking Rewards for Cosmos’ ATOM (Coindesk)
_______________________________________________________________________
Technical analysis
_______________________________________________________________________
Bitcoin
While it seems that Bitcoin is having quite a slow day, that is not exactly the case. Even though its price has not changed much since our last report, the largest cryptocurrency by market cap is fighting to stay above the triangle formation it has recently passed. If it manages to confirm its position above the triangle (and then 38.2% Fib retracement level), Bitcoin will set itself up to rush towards (and past) $11,000.
BTC/USD 1-day Chart
If we zoom in to the 4-hour chart, we can see that Bitcoin is right on the verge of going back under is level, but has held up nicely so far. Trading is quite simple at the moment, as Bitcoin is not making any sudden moves either towards the upside or downside.
BTC/USD 4-hour Chart
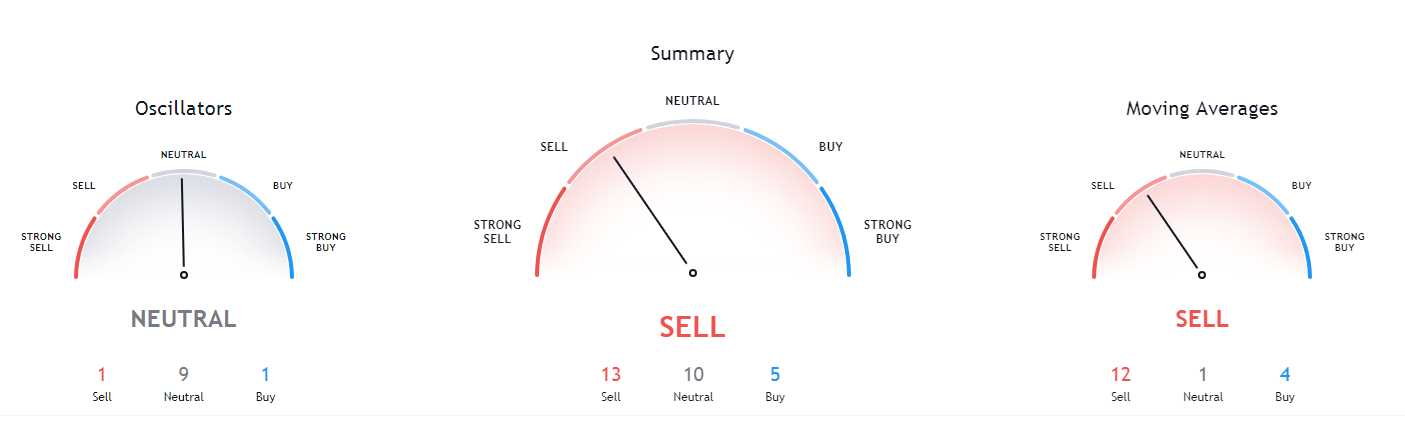
Bitcoin’s short-term technicals are tilted towards the sell-side and will be tilted in that direction until Bitcoin confirms its position above the 38.2% Fib retracement. However, its daily overview is slightly bullish, while its weekly and monthly overviews are extremely bullish.
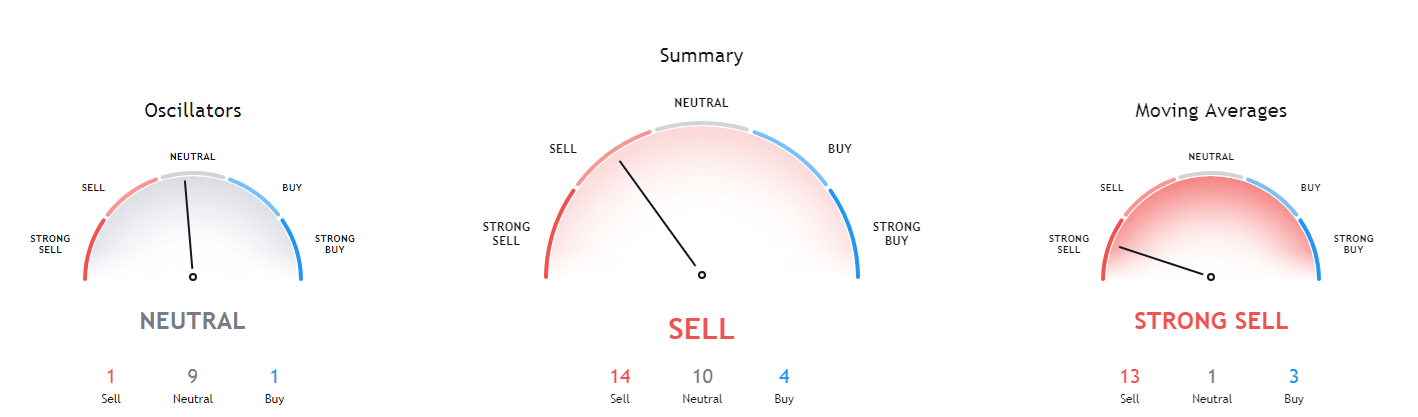
BTC/USD 4-hour Technicals
Technical factors (4-hour Chart):
- Price is slightly above its 50-period EMA and below its 21-period EMA
- Price is right below its middle Bollinger band
- RSI is neutral (48.90)
- Volume is average
Key levels to the upside Key levels to the downside
1: $10,850 1: $10,630
2: $11,000 2: $10,500
3: $11,090 3: $10,015
Ethereum
Ethereum has been pretty stable in the past 24 hours. Its price has been making higher highs and higher lows ever since Sept 24, until now. The trend has (seemingly) stopped, with Ethereum being stopped out by the $360 resistance level. While this makes Ethereum’s outlook slightly more bearish, in reality, this doesn’t change much as Ethereum Option traders have already made a prediction of ETH trading between $340 and $360 by the end of Oct.
ETH/USD 4-hour Chart
While Ethereum’s 4-hour and 1-day technicals are now tilted towards the sell-side, its longer-term overview is extremely bullish. If we take a look at its weekly or monthly technicals, the sentiment is heavily tilted towards the buy-side.
ETH/USD 4-hour Technicals
Technical Factors (4-hour Chart):
- The price is at its 50-period and its 21-period EMA
- The price is at its middle Bollinger band
- RSI is neutral (50.89)
- Volume is below average
Key levels to the upside Key levels to the downside
1: $360 1: $340
2: $371 2: $300
3: $400 3: $289
Ripple
XRP has, after four days of trying, failed to break the $0.2454 resistance level. Its price has fallen off a bit since the last attempt, currently trading at around $0.24. We can also see that XRP has moved below its 50-period moving average, which may cause a further descent towards $0.235.
XRP/USD 4-hour Chart
XRP technicals are quite confusing. While its 4-hour outlook is mixed, its daily outlook is heavily tilted towards the sell-side. On the other hand, its weekly outlook is bullish, while its monthly outlook is, once again, bearish.
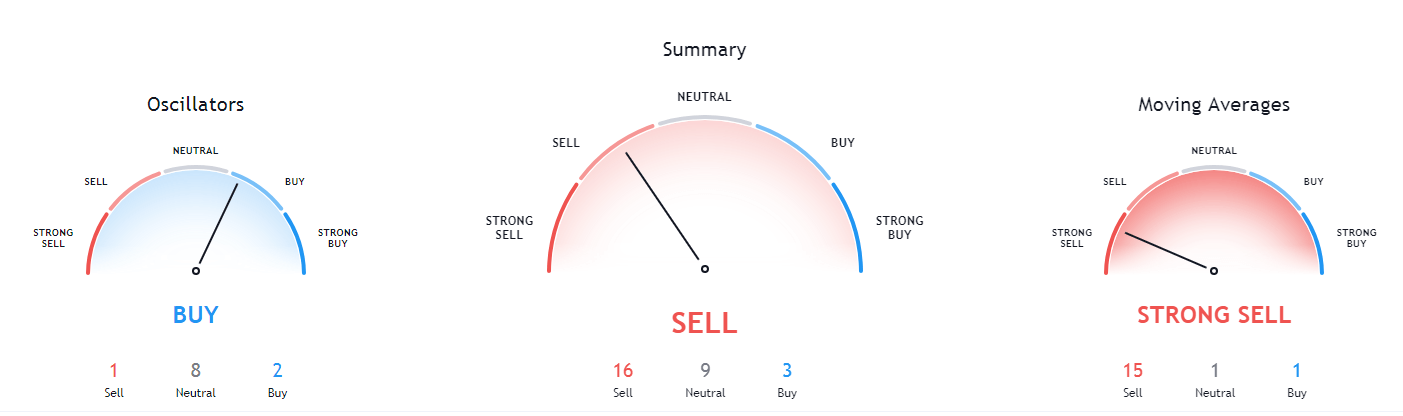
XRP/USD 4-hour Technicals
Technical factors (4-hour Chart):
- The price is below both its 50-period EMA and its 21-period EMA
- Price is slightly below its middle Bollinger band
- RSI is neutral (48.16)
- Volume is stable and average
Key levels to the upside Key levels to the downside
1: $0.2454 1: $0.235
2: $0.266 2: $0.227
3: $0.27 3: $0.221
Related posts
 Daily Crypto Review, Apr 27 – Bitcoin stopped by the $7,750 resistance – What’s to come next?
 Daily Crypto Review, Jun 08 – Cryptos Preparing For The Next Move – What To Expect?
 Daily Crypto Review, Jun 09 – Bitcoin Gaining 700% Soon? Analyst Estimates BTC At $75,000
 Daily Crypto Review, Jun 12 – BTC Plunging To Two-Week Lows; Binance Launching BTC Futures Contracts
One reply on “Daily Crypto Review, Sept 30 – Goldman Sachs Entering the Crypto Sector; Bitcoin Prepares for a Move”
hopefully a big push up soon for bitcoin