Introduction
Previously, we had discussed how a group of different candlestick formations provides the necessary information to comprehend the market sentiment and evaluate the probability of a trend reversal, which could help traders in joining the start of the new trend.

In this educational article, we’ll review how candlestick formations can be used to establish a trading strategy and which patterns could bring more confidence in the trading setups.
The Candlestick Patterns’ Usefulness
Candlestick patterns arise as a result of the price action at a determined range of time. Independently of the timeframe under visualization, e.g., weekly, daily, hourly, or even minute timeframe, the price never is a lagging indicator. Furthermore, candlestick patterns tend to appear in every market and timeframe.
Trading Signals with Candlesticks Patterns
There exist a set of candlestick patterns that frequently appears in the financial markets across time, although the technical trader must consider the market context before consider if the candlestick represents a continuation or a reversion of the trend.
Hammer and Hanging Man
The hammer characterizes itself by presenting a large shadow and a small body located near the high of the day. When this pattern appears at the end of a bearish trend, it tends to be a bullish reversal signal.
When a hammer pattern shows up after a substantial descent, the technical trader may place a buy position on the next trading bar above the high of that hammer, placing its stop-loss below the low of the last day.
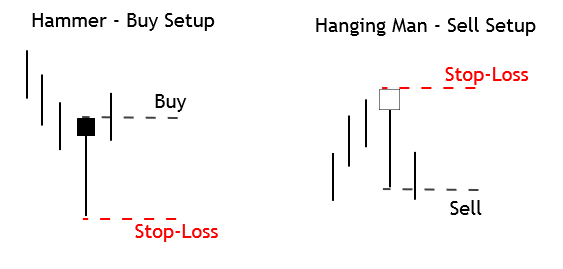
On the opposite side, the hanging man pattern arises when an uptrend ends. The sell setup will take place in the next session candle using the low of the hanging man candle as entry level, with a stop-loss above its high.
Engulfing Candlestick Pattern
The engulfing pattern is a formation constituted by two candles. The bullish engulfing pattern will occur at the end of a downtrend. During the trading session, the action takes place in a wide range. The price opens near the low of the day and closes near the high of the day, erasing the losses of previous trading session or sessions.
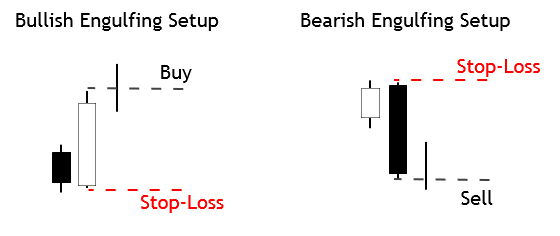
A bullish position will take place at the high of the previous day, with a stop-loss located below the low of the last trading session. A bearish position will occur at the low of the previous trading session, with a stop-loss order placed above the highest level of the engulfing candle.
Harami Pattern
The harami pattern tends to indicate the change of the trend only when it appears at the end of a bull or bear leg. The Harami is the weakest form of a reversal pattern.
A buy position will trigger if the price breaks and closes above the high of the day of the narrow range candle during the next trading session, the stop loss is to be placed below the low of the session in progress.
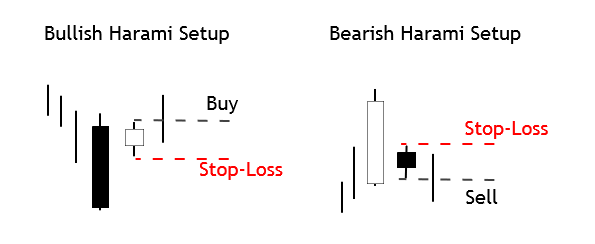
A sell position will occur if the price breaks and closes below the narrow range candle, and its stop-loss may be located above the highest level of the harami candle.
Morning Star and Evening Star Pattern
Both the morning star as the evening star pattern are formations that hold three candlesticks for its configuration.
The Morning star pattern is a bullish trend formation, which will activate a buy position above the high of the last trading session, with its stop-loss below the low of the previous day or candle.
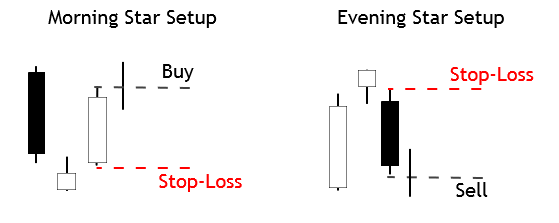
The evening star pattern is a bearish formation, which will trigger a sell position below the third candle of the pattern, its stop-loss placed above the high of the last trading session.
Conclusions
In this educational article, we presented a group of candlestick patterns, which could increase the confidence in an entry setup. However, although the formation provides an entry-level and stop-loss, these formations don’t identify a profit target level. This context could not ensure the technical trader a risk to reward ratio at least one to one, reducing the profitability of any candlestick pattern.
To reduce this variability on the expected results, we remark the Fischer and Fischer conclusions; they unveil the advantage of the use of candlestick formations compared to bar charts, stating that candlesticks are easier to understand and most useful for short-term traders.
Finally, they conclude that the most reliable candlestick formations are the engulfing pattern, hammer, and hanging man. In this context, the technical trader should consider that before ramping up a trading strategy based on candlestick formations, it’s recommended to evaluate its performance, developing a statistical backtest before jumping in the real-market.
Suggested Readings
- Fischer, R., Fischer J.; Candlesticks, Fibonacci, and Chart Patterns Trading Tools; John Wiley & Sons; 1st Edition (2003).