The Hammer
The Hammer is a one-candle pattern. The Hammer is identified as a small body with a large lower shadow at the bottom of a downtrend. The result of having a small body is that the open and the close are near each other. The large lower shadow means during the session sellers could move down the price but, then, buyers stepped in and pushed the price back to the levels of the open, or, even, a bit further up. That means sellers lost the battle, and the buying activity started dominating the price action. A positive candle is needed to confirm the price action. This usually converts this candle into a Morning Star formation.
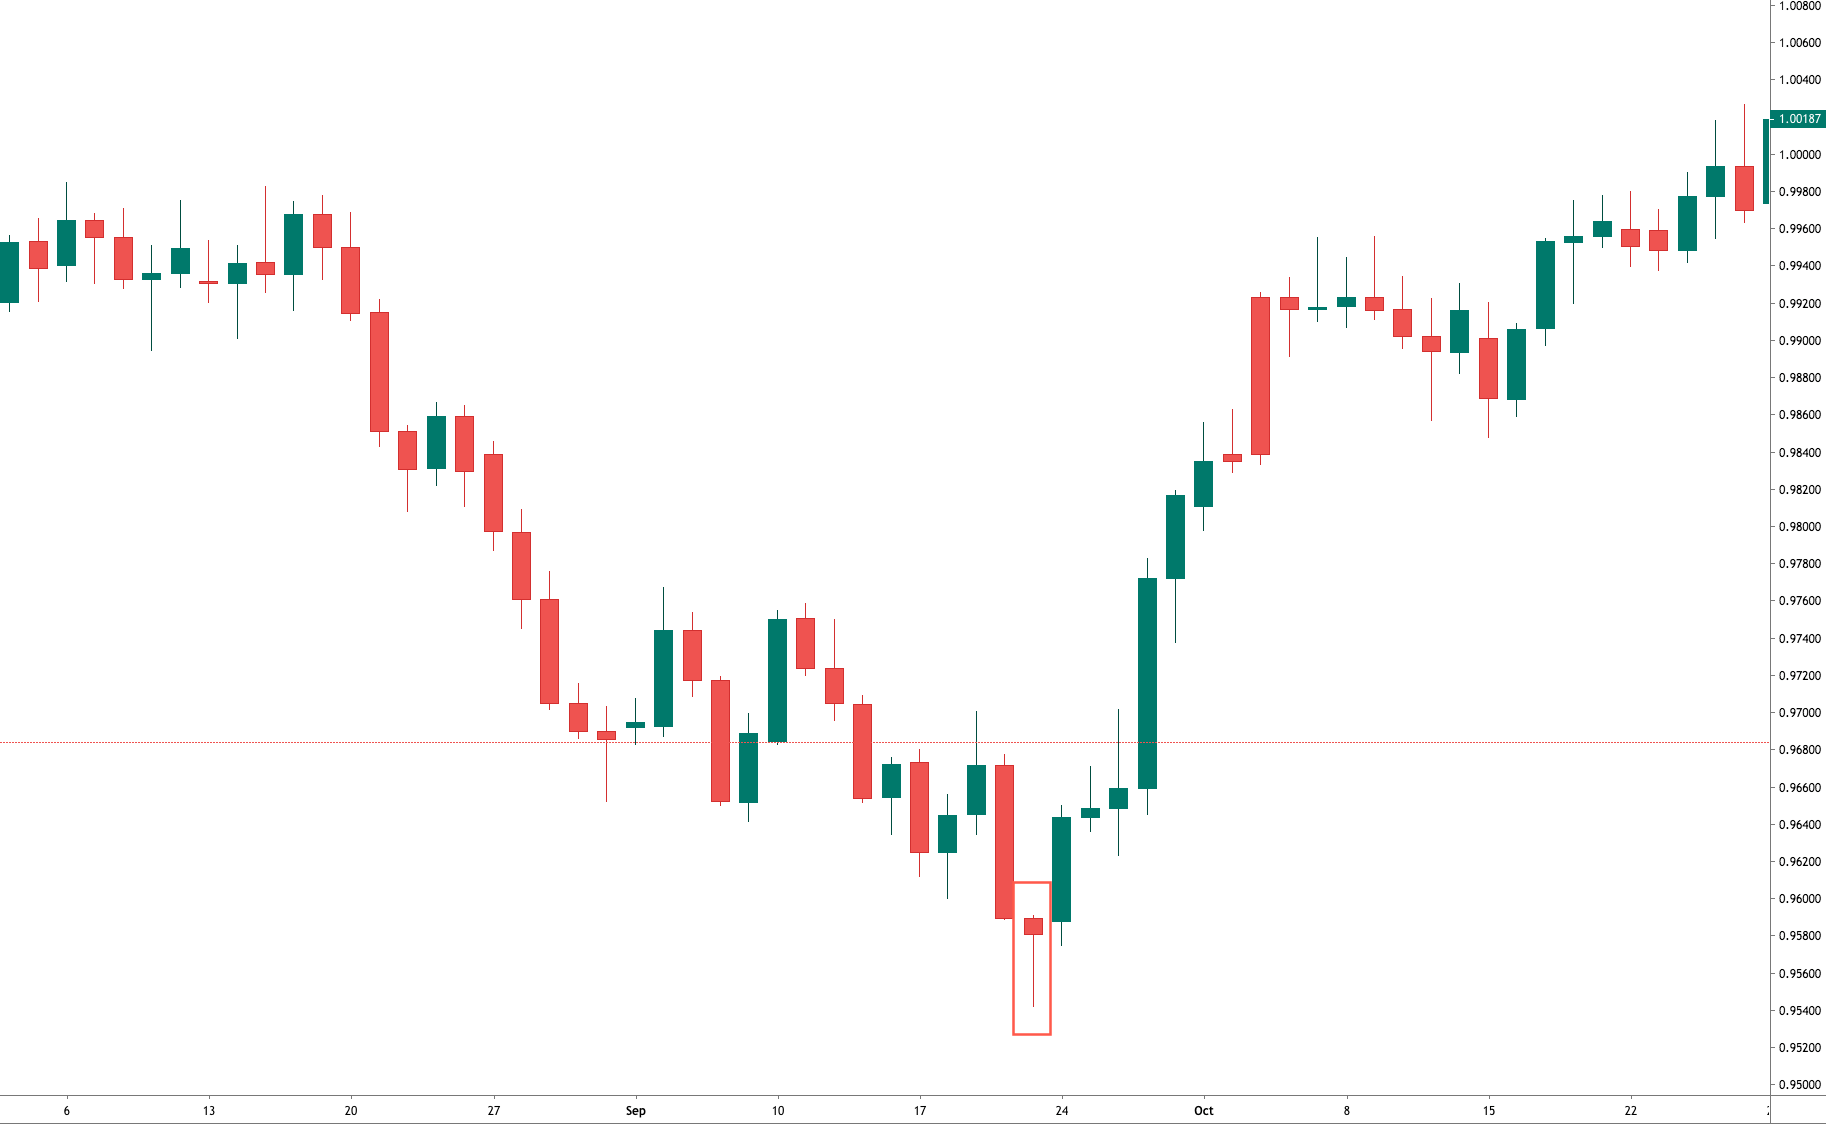
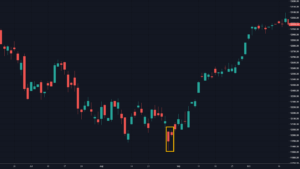
Chart 1 – Hammer in the USDCHF Pair
Criteria for Hammers
- The lower shadow must be at least twice the length of the body
- The real body is at the upper side of the range. The color does not matter much, although a white body would increase the likelihood of the reversal.
- There should be no upper shadow or a very tiny one.
- The longer the lower shadow, the better
- A large volume on the Hammer is a good signal, as a blob woff day might have happened.
Market Psychology
After a relatively large downtrend, the sentiment of the traders is rather bearish. The price starts moving down at the open and makes a new low. Then, buy orders to move the price up. Profit-taking activity also contributes to the upward move. Then intraday stop-loss orders come in fueling the action further up. A positive follow-up candle would confirm the control of the action by the buyers.
The Hanging Man
The Hanging Man is also a figure similar to a Hammer, with its small body and large lower shadow, but it shows up after a bullish trend. The Japanese named this figure that way because it looks like a head with the body and feet hanging.
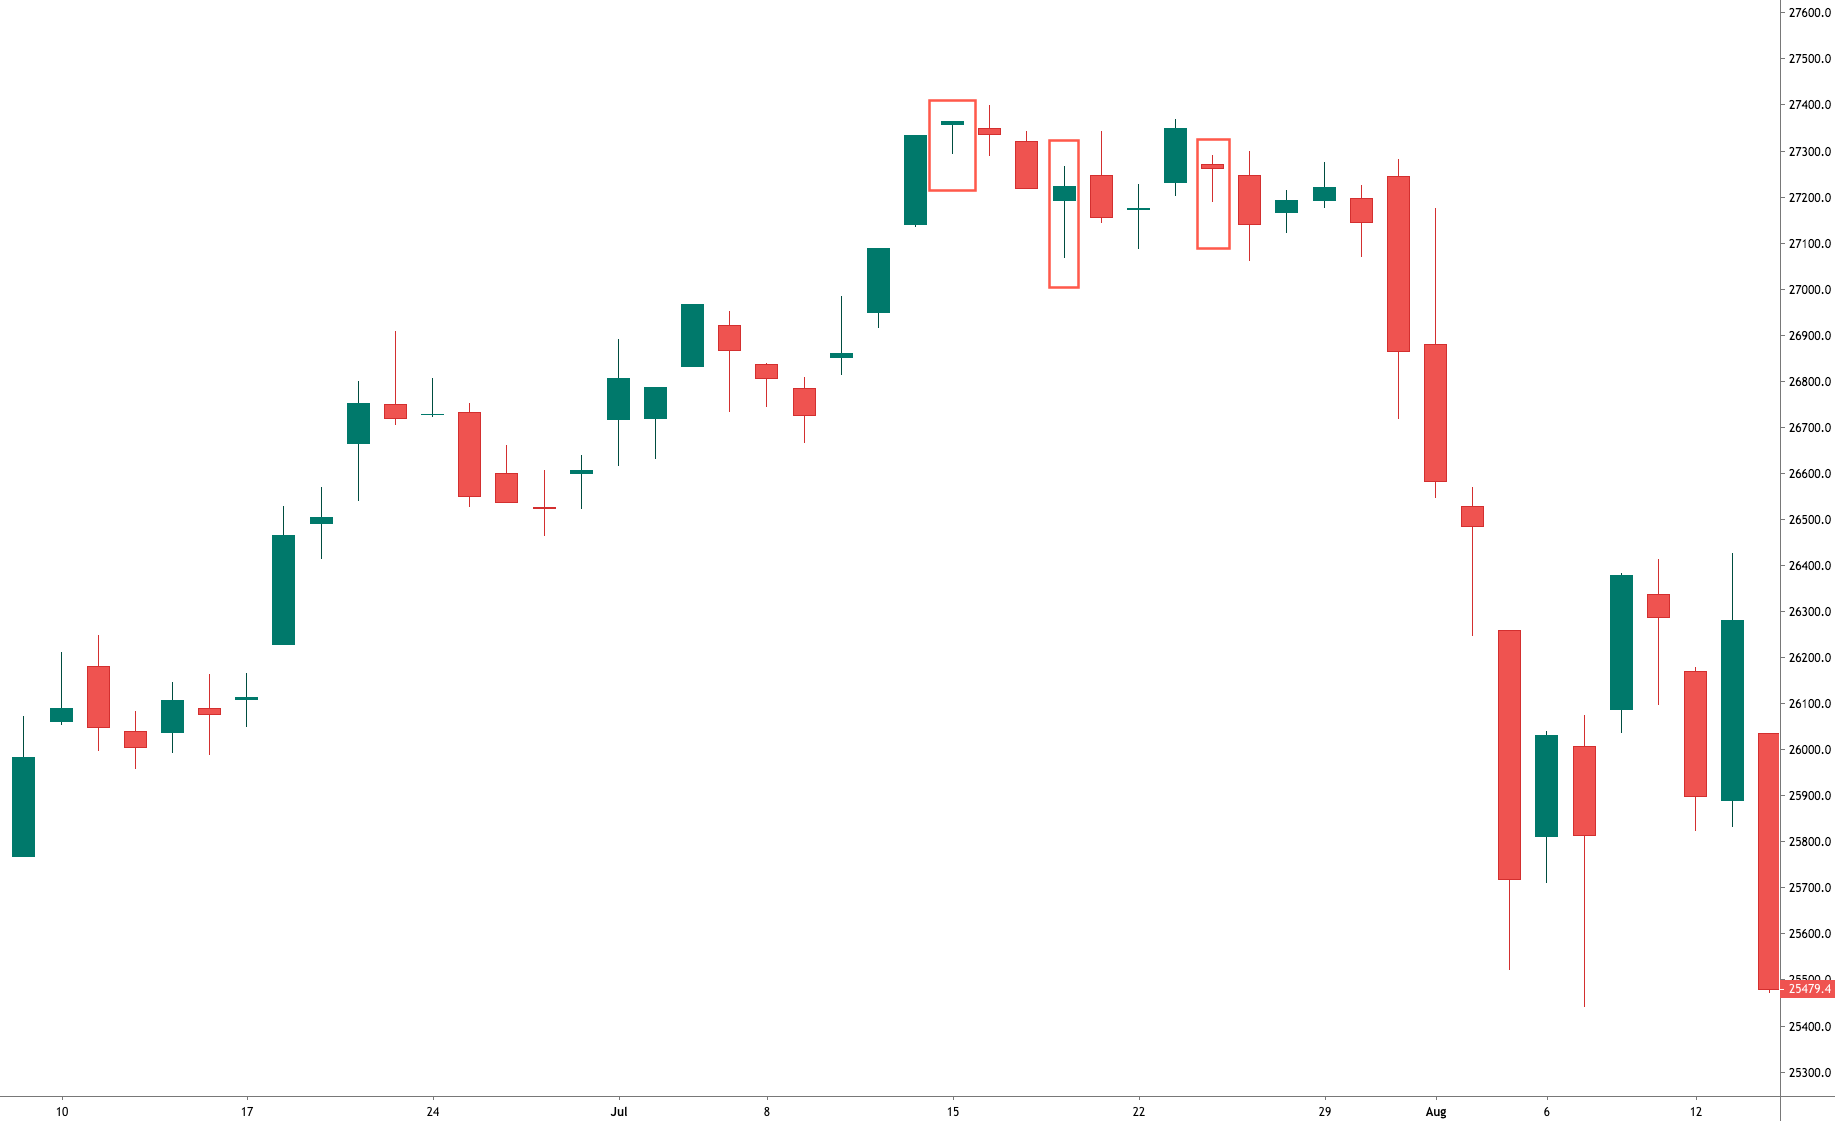
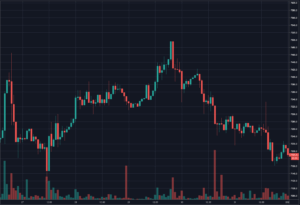
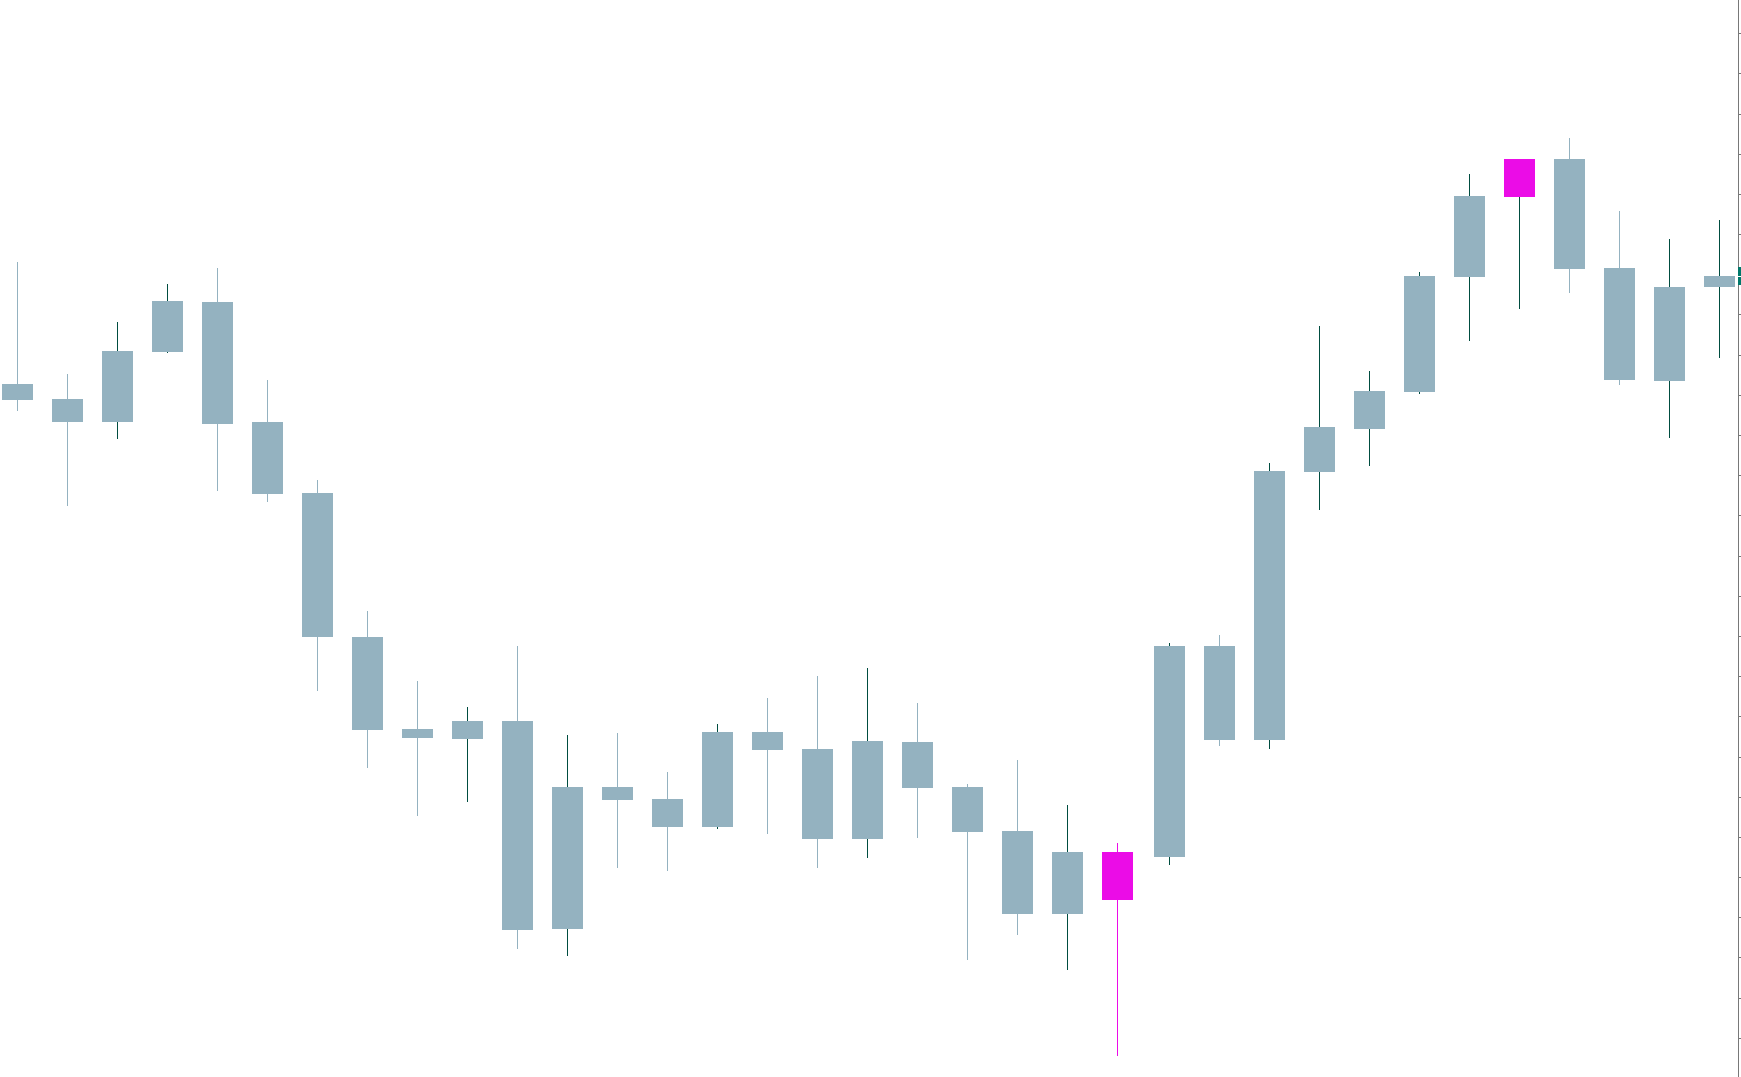
Chart 2 – Three Hanging Man in the DOW-30 Index
Criteria for the Hanging Man
- The lower shadow must be at least twice the length of the body
- The real body is at the upper side of the range. The color does not matter much, although a white body would increase the likelihood of the reversal.
- There should be no upper shadow or a very tiny one.
- The longer the lower shadow, the better
- A large volume on the Hammer is a good signal, as a blowoff day might have happened.
Market Psychology
After a strong trend, the sentiment is quite positive and cheerful. On the day of the Hammer, the price moves higher just a bit, then it drops. After reaching the low of the session, the buyers step in again and push the price back up, close to the open level, at which level the session ends. This would indicate the price action is still in control of the buyers, but the considerable drop experienced in the first part of the session would mean the sellers are eager to sell at these levels, and a resistance zone was created. A lower open or a black candlestick the next day would move the control to the sell-side.
Reference.
Profitable Candlestick Patterns, Stephen Bigalow