The engulfing pattern is a major reversal figure, and it is composed of two inverted candlesticks, as in the case of the Piercing pattern and the Dark Cloud Cover figure. Typically, this figure appears at the end of an upward or downward trend. It is common that the price pierces a significant resistance or support level, then making a gap up or down in the following session, to, suddenly, change its direction and end the day entirely covering the first candle.
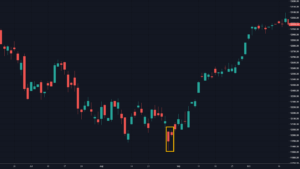
The Bullish Engulfing
The bullish engulfing candle shows at the bottom of the trend. After several sessions with the price controlled by sellers, another black candle forms. The next session opens below the previous session close and closes above the last open, thus, completely covering the body of the black candle made on the previous session.
Criteria:
- The body of the second candlestick covers completely that of the black candle.
- There is evidence of a downward trend, even a short-term one.
- The body of the second candle is white and of the opposite color of the first candlestick. The exception is when the first candlestick is a doji or a tiny body. In this case, the color of the first candle is unimportant.
- The signal is enhanced if a large body engulfs a small body.
- a Large volume on the engulfing day also improves the signal.
- A body engulfing more than one previous candle shows the strength of the new direction.
- Engulfing also the shadows of the previous candle is also good news.
- In case of a gap, the larger the gap, the higher the likelihood of a significant reversal.
Market Sentiment:
After a downtrend, the next day, the price starts lower than the previous close but, after a short while, the buyers step in and move the price up. The late sellers start to worry, as they see their stops caught, adding more buying to the upward movement. As the price moves up, it finds a combination of profit-taking, stop-loss orders, and new buy orders. At the end of the day, this combination creates a strong rally that moves the price above the previous close.

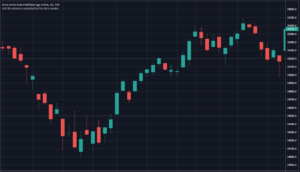
Fig 1- Bearish and Bullish engulfing patterns in the Bitcoin 4H chart
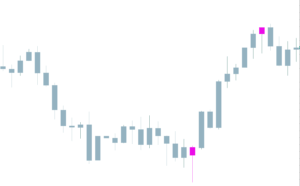
The Bearish Engulfing
The Bearish engulfing pattern is the specular figure of a Bullish engulfing figure. And more so in the Forex market where assets are traded in pairs, making every move symmetrical.
The bearish engulfing forms after an upward trend. It is composed of two different-colored bodies, as in the above case. This time, though, the order is switched, and a bullish body is followed by a black candle. Also, the black body engulfs completely the body of the previous white candlestick. Sometimes that comes after the price piercing a key resistance, to then come back, creating a fake breakout.
Criteria:
- The uptrend is evident, even short-term.
- The body of the second day engulfs the body of the previous day.
- The body of the second candle is black, and the previous candle is a white candlestick, except for tiny bodies or dojis. In that case, the color of the first candlestick is unimportant.
- A large body engulfing a small body is an enhancement, as it confirms a change in the direction.
- A large volume on the engulfing day is also good for the efficacy of the signal.
- A body engulfing more than one previous candle shows the strength of the new direction.
- Engulfing also the shadows of the previous candle is also good news.
- In case of a gap, the larger the gap, the higher the likelihood of a substantial reversal.
Market sentiment:
After an uptrend, the price opens higher but, after a while, it reverses and moves below the previous open and below. Some stops trigger and add more fuel to the downside. The downward action accelerates on a combination of profit-taking, more stops hit, and new short orders. At the end of the day, the price closes below the open of the previous session, with the sellers in control.
—-
References:
The Candlestick Course: Steve Nison
Profitable candlestick Patterns, Stephen Bigalow