The Financial markets are an exciting place for many people, attracted by dreams of infinite wealth. However, these markets are one of the most complicated environments on earth. The fact that millions of people exchange assets in financial markets makes them very difficult to predict, as each of the participants has its own vision, interests, and objectives.
That is why traders are always investigating the best tools to allow them to detect market sentiment in every situation.

Fundamental versus Technical
In the past, fundamental analysis was the only tool that allowed investors to detect whether a value was overvalued or undervalued. That gave them the keys to future trends, and to be able to overtake other investors with less information.
Then, at some point, the theory arises that the analysis of price history shows everything necessary for an informed investment. According to this theory, launched by Charles Dow, the price is already included in the fundamental analysis, since the chart is the trace left by investors about the consensus value of the good.
That said, there is a consensus that fundamental analysis is still necessary to detect the macro trend and to position the buying and selling actions in favor of the primary trend, while technical analysis is essential to generate the timing of trading activities.
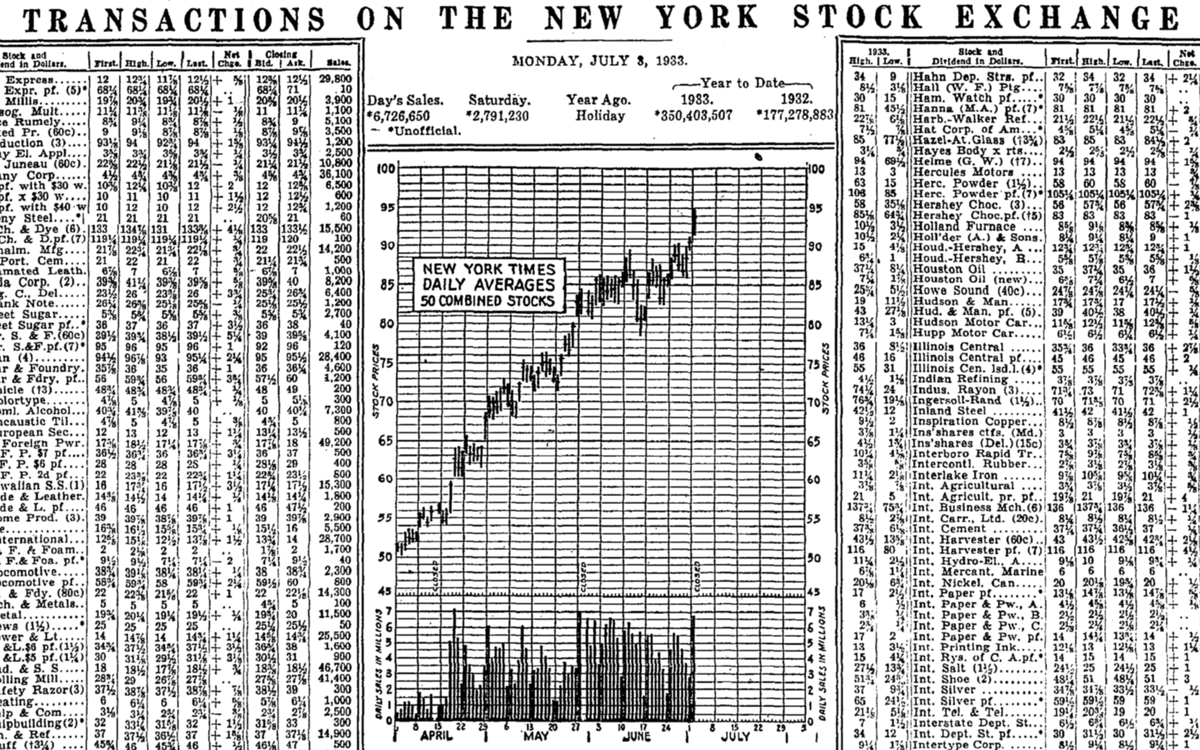
Fig 1- Old NY Stock Exchange price table and Average chart. Source (https://pix-media.priceonomics-media.com/blog/1230/image04.png)
Chartism was encouraged in the early 1970s and 1980s by the emergence of personal computers, which allowed graphs to be automatically generated, instead of manually drawn, and also analyzed in time frames shorter than the daily.
The OHLC Chart
The technical analysis popularized the use of OHLC graphs that not only indicated the closing value of each interval but also gave the opening, maximum, and minimum data. This allowed chartists to observe the range of movements of the period and obtain an assessment of the volatility.
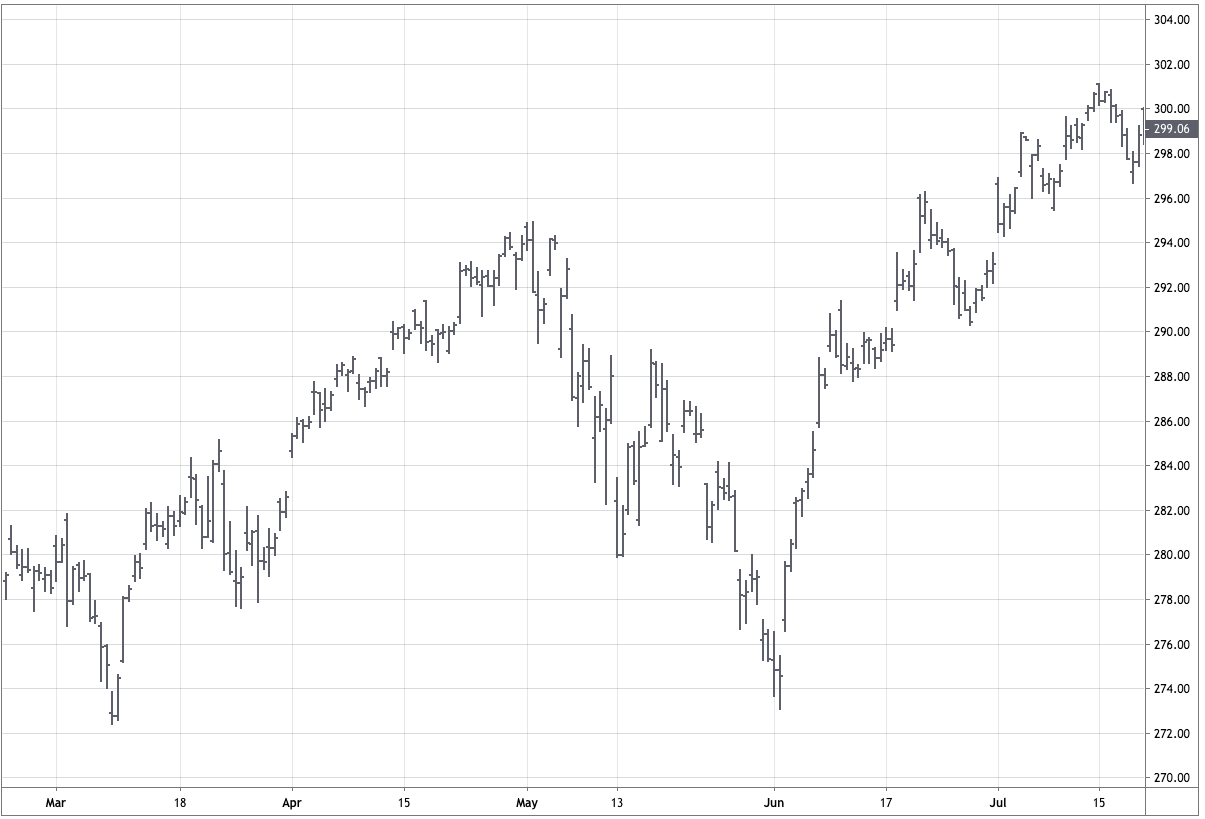
Fig 2- OHLC Chart in its classical B&W style.
The use of OHLC charts was a big advancement in the analysis of the price action. Soon analysts began to define profitable patterns such as reversal bar, key reversal bar, Doble and triple tops and bottoms, head and shoulders pattern round bottoms, Cup and handle, and many more.
Candlestick Charts
A centuries-old hidden way to analyze the markets came from Japan helped by Steve Nison’s studies of candlestick charting methods. According to him, centuries back, Japanese merchants were at the bottom of Japan’s social scale, well below soldiers, artisans, and farmers. But a prominent merchant began rising in status by the XVIIth century. His name was Munehisa Homma. At that time rice was a medium of exchange. Feudal Lords would store it in Osaka’s warehouses to, then, exchange the receipts when it was convenient for them, thus, becoming a de-facto futures market. Homa’s trading techniques, which included analysis through a primitive form of candlestick charts to gauge the psychology of the marker would earn him an immense fortune.
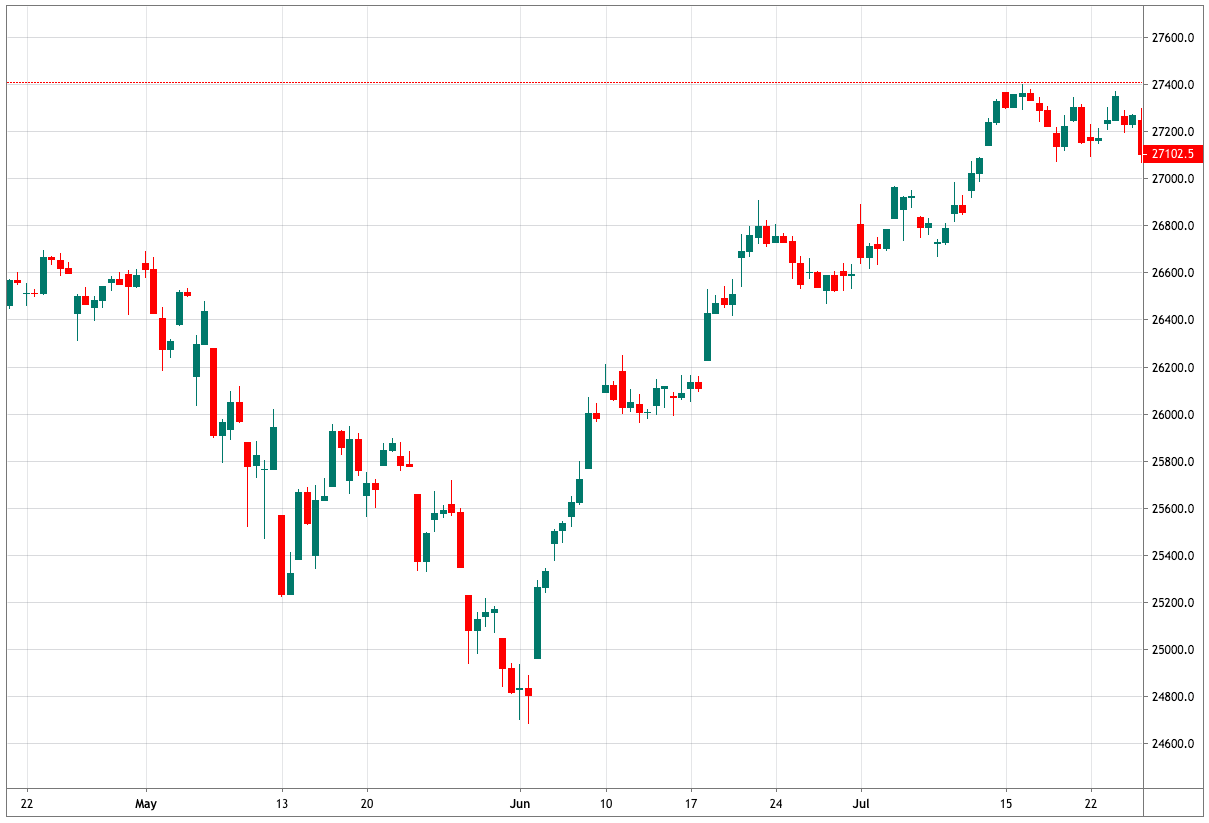
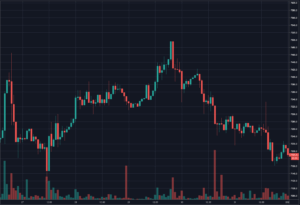
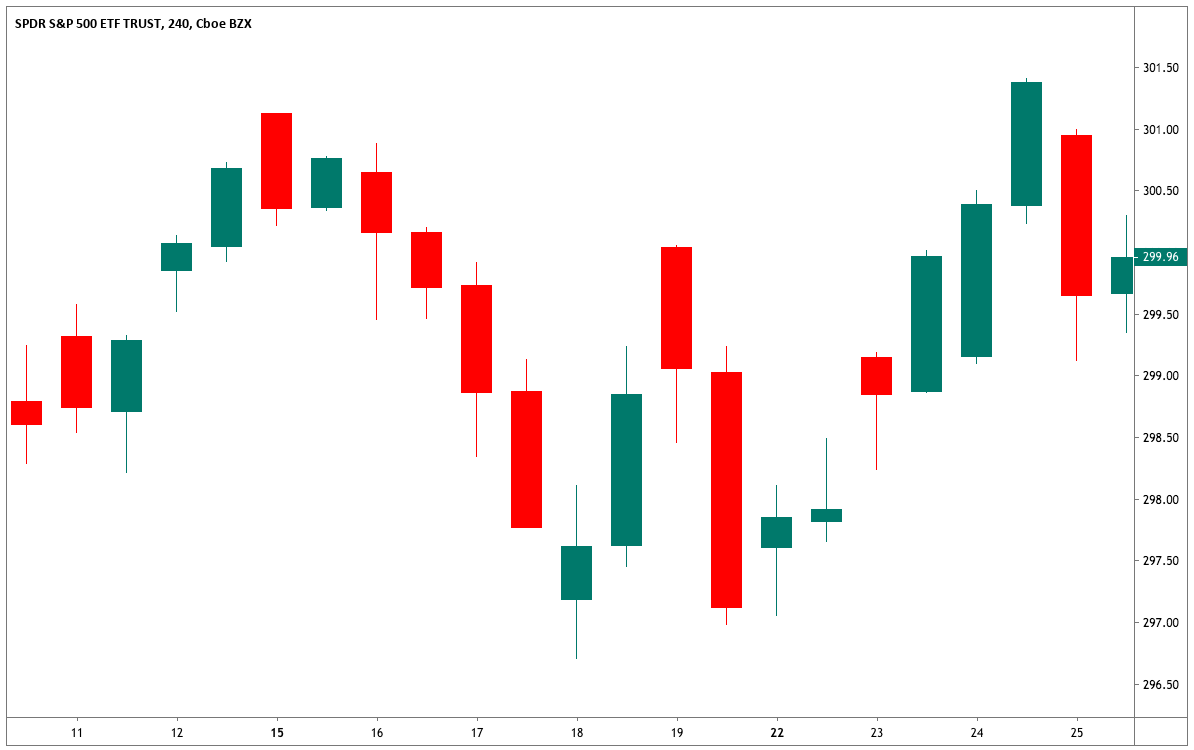
Fig 3- Candlestick Chart in its modern colorful style.
The major advantage of a candlestick chart over an OHLC chart is the ability to assess at a glance the overall trend and, also many hints about the current sentiment or psychological mood of the trader collective. Color is key to assess the current trend. Also, large bodies signify genuine momentum, short bodies and large wicks mean indecision and fight between buyers and sellers to control the price action.
Candlestick Patterns
Many of the western analysis methods can be applied also to candlestick charts, but these Japanese charts have brought a brand new batch of new patterns to assess market turns and continuations. We will try to cover most of them, including obviously all major trading candlestick patterns such as Morning and evening stars, haramis, engulfing, three soldiers, and so on.
To refresh your basic knowledge of candlesticks, we recommend the following articles:
https://www.forex.academy/facts-about-candlesticks-you-never-knew/
https://www.forex.academy/dissection-of-candlestick/
https://www.forex.academy/candlestick-charts-and-its-advantages-in-financial-trading/