With the advancement of technology, retail trading in the financial markets has become popular among investors. Since unnumbered traders from all over the world invest in the financial markets, they use so many of strategies, indicators, and EAs to make money out of trading. Also, many things with the financial markets have been changing as well. However, certain basic things have no, and they may never change. One of the things is the usage of Candlestick charts.

Before getting into this, lets us summarize the different types of charts available for traders. Typically, there are three types of charts that are mostly used in trading.
- Line Chart
- Bar Chart
- Candle Stick Chart
Line Chart
Let us have a look at a line chart.
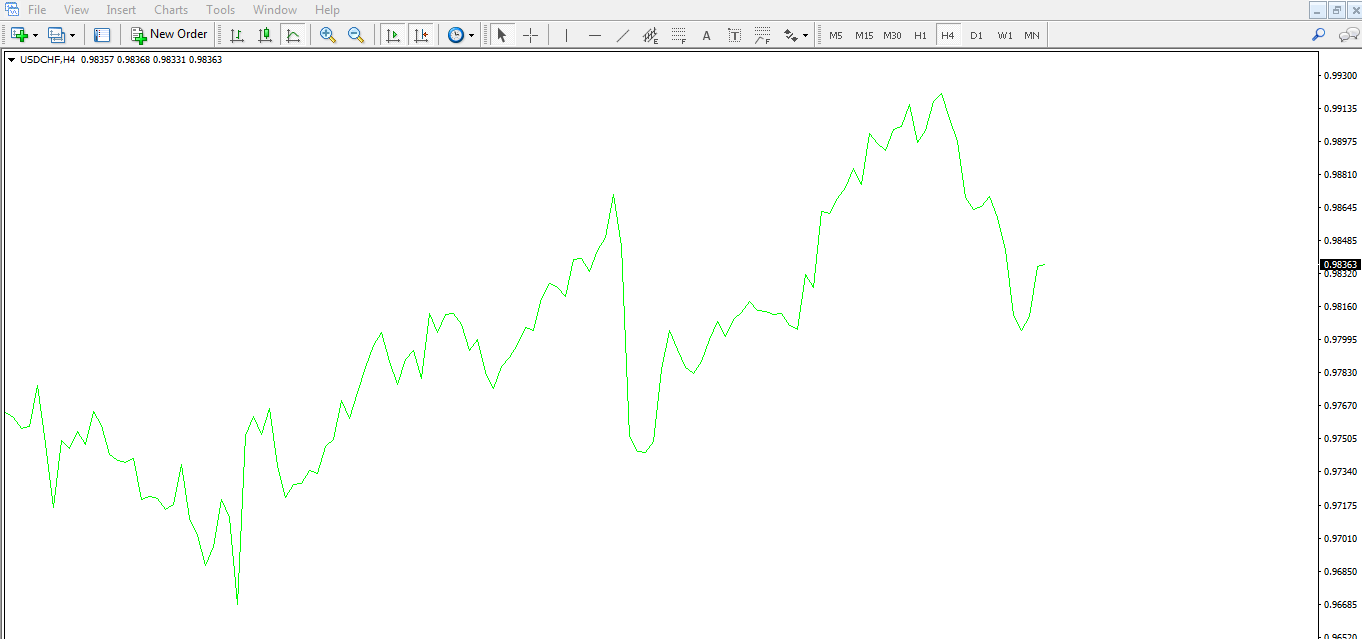
The line chart is generated by using the closing price of the bars. It does not represent the highest high, lowest low or the opening price. Thus, it gets tough for traders to find out the sentiment of other traders. The price may go towards the upside and has a strong rejection from a level of resistance. But the line chart does not show that rejection. Thus, a trader may think the market is bullish whereas the price has had a strong rejection and it may be time for the sellers to take over.
Let us flip over the same chart to a Bar Chart.
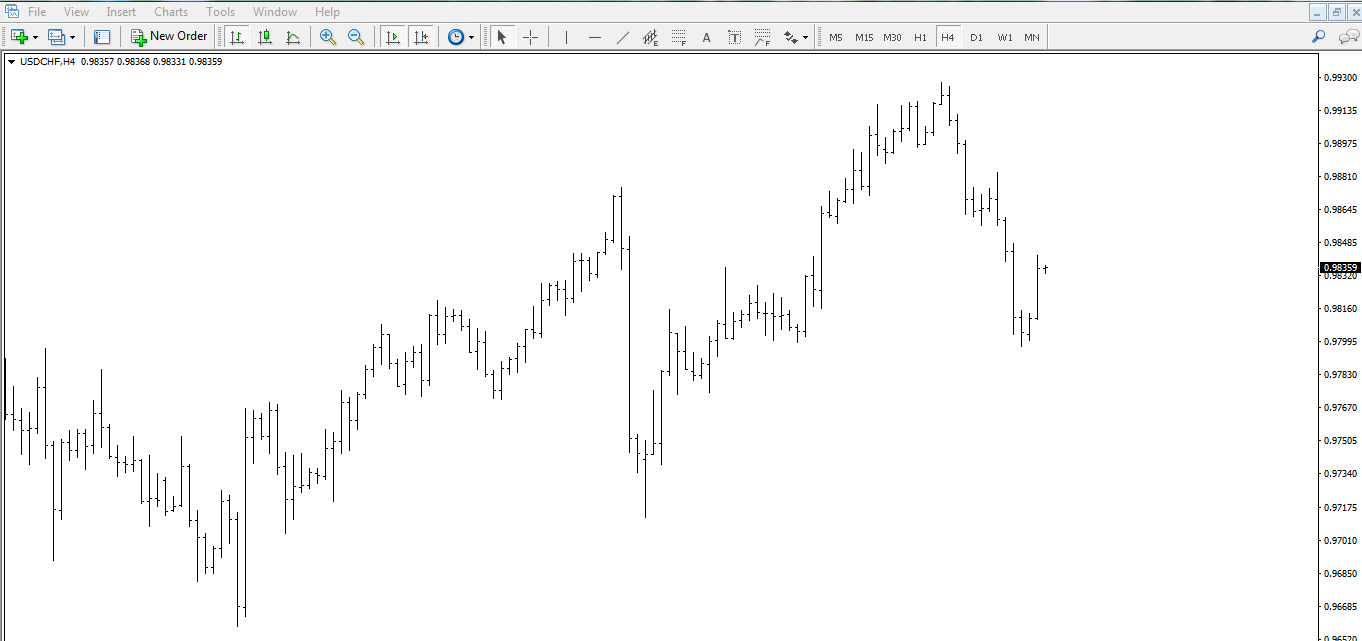
The Bar Chart is more informative than the Line Chart. It shows the opening price, closing price, highest high and lowest low of the period it has tracked. It certainly gives us a clearer picture than the Line chart. An experienced trader may not have any problem to find out the trend, rejections, market psychology by using the Bar Chart. However, we may have a better option. Do you know what that is? It is the Candle Stick Chart.
Here it comes.
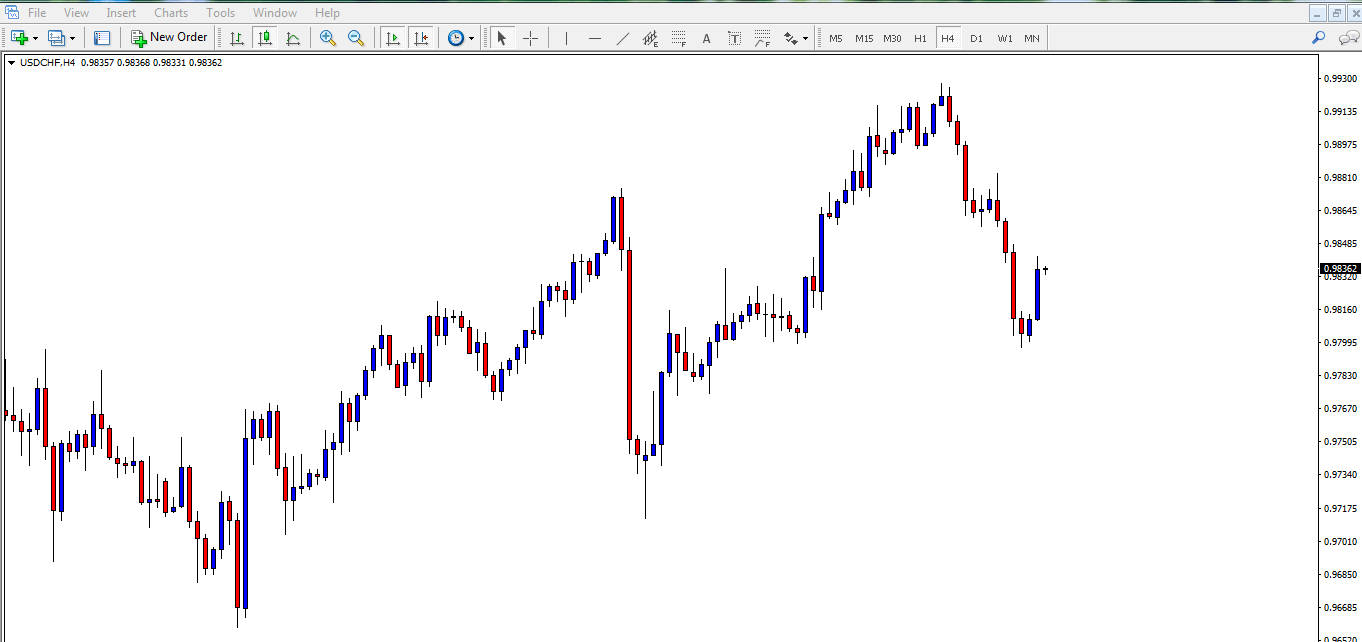
A picture is worth a thousand words. Does not give us the clearest picture of market psychology? It does because it represents the market with color including closing price, opening price, the highest high and lowest low. Moreover, it shows us rejection or bounce (upper shadow/lower shadow) as well. Candlestick charting is one of the most important tools in modern days trading.
There are other things to be integrated with Candlestick Chart such as Support, Resistance, Fibonacci Levels, Pivot Points, Trend Line, and Channels, etc to be able to trade effectively. To be a long racehorse in trading, a trader must have a good understanding with all those. We will get more acquainted with Candlesticks, Candlestick Patterns and their usage, integration with other trading factors in our fore coming articles. Be with us. See you in our next article.