Individuals eager to enter the world of trading usually feel perplexed when they start analyzing the charts, not fully understanding the movement of prices and what causes it. After a while, they typically start making connections between different factors in the market, beginning to grasp this association. Correlations, the implication that connections can be drawn between the behaviors of two distinct things, are one of the inherent parts of different trading markets. Nowadays we can see how various events affect the changes we see in a specific market and how different markets can impact one another, providing proof for the existence of both inter- and intra-connectedness in terms of market cause-and-effect relation. We can now see and understand how correlations work and the way they cause things to move. Often we find how pulling one string affects other parts of the web, which is why it is necessary to see the extent of this impact and whether it can have practical applications for traders. Today we are reviewing different types of correlations, finding real-life market implications, and evaluating their effectiveness.
Correlation Degrees
Correlations can either be positive or negative and together these two polarities form a spectrum consisting of several different degrees of correlation. As can be seen from the table below, both positive and negative correlation can be either perfect, high, or low. With the positive (left) side, we understand that two things are moving exactly the same, unlike for the negative (right side of the table). With similar indices, we can often detect a positive correlation, such as the case of the SPX and the SPY (ETF) which, due to their similarity, do not only have a positive correlation but a number of correlations as well. On the other hand, examples such as the correlation between DIA (diamonds) and DOG (inverse ETF) reflect a negative correlation owing to the fact that they move exactly opposite to each other. Therefore, we can conclude that a positive correlation is the one where two things are moving together, while the negative one implies that two items are moving in the opposite directions, as portrayed in the graphs below.

Many traders assume that, since there are two extreme points at both ends of the spectrum, the middle stands for a perfect balance between the two. However, as correlations simply work differently, the mid-point actually signals something completely different. For example, in the stock market, there is a number called beta, which essentially stands for a measure of volatility. In this respect, the S&P 500 is esteemed 1, so if anything is considered to be 2, it would signify a two times higher degree of volatility in comparison to the afore-mentioned index. Hence, if anything was measured to be 0.5, it would imply that it is half as volatile as the S&P 500. In the early 2000s, Netflix had a negative beta and, as it went down each time the S&P 500 went up and vice versa, it was impossible to measure volatility in relation to this index because Netflix never followed what the other was doing. In statistics, there is a term called R-value which reveals how things are correlated and, going back to the previous table, we can see that there are two perfect correlations on each side, positive and negative, but the middle, however, shows no correlation. This further means that there is no perfect balance in between the two extremes, yet that there is a void where no correlation exists just like the previous example involving Netflix shows.
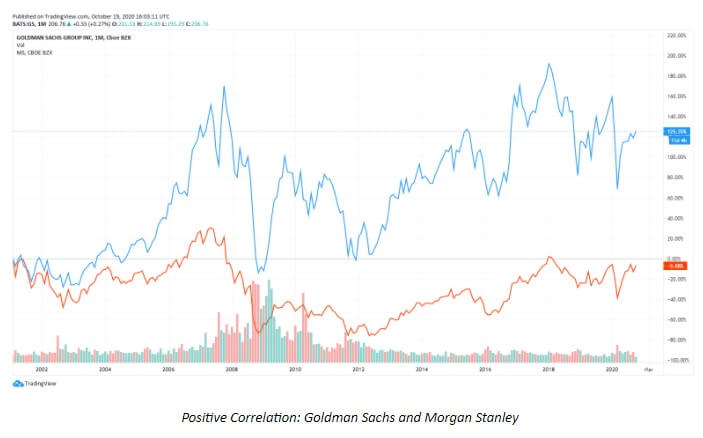
In terms of positive correlations, we can find many examples of stocks correlating with the S&P500. One example where there is an indication of a similar movement is displayed below. Although the correlation between Goldman Sachs and Morgan Stanley (both of which are in the same line of business – brokers, trading, and asset management, among others) is not a perfect one, we can definitely find proof of it being a positive correlation despite the existing differences. Although these differences are obvious, we see that these two similar companies also have a tendency to move in a similar fashion.
Although most stocks are said to have a positive correlation with the S&P 500, there is still evidence of some with a negative correlation. The example below shows exactly that type of correlation, where we can see how FAS and FAZ are inversely or negatively correlated. The chart below is very close to a perfect negative correlation where the movements go in almost entirely opposite directions. Where we see the FAS going up, the FAZ is going down and vice versa. This almost perfect opposite behavior is completely understandable since FAS stands for a financial ETFx3 to the upside, whereas FAZ represents a financial ETFx3 to the downside (Direxion Financials).

Major Correlation Causes
Many sources claim that correlation does not equal causation, implying that things that are correlated need not be the cause of each other’s existence, yet there is proof that certain factors lead to specific occurrences in different markets. We recognize three of such determining factors where correlation is quite vivid and, consequently, undeniable: 1) market correlations, which is the most prominent in the currency market; 2) commodity correlations due to which specific commodities affect certain currencies; and, 3) currency correlations where one currency is likely to go down because the other one goes up for example.
Market Correlations
Whenever the topic of market correlations comes up, it is necessary to bring up the measure between risk and reward as well. Today we understand how some assets are considered to be very safe, while others are seen as risky. These projections stem from the analysis of volatility and risk of loss, so we can call an asset risky whenever it is likely to lead to a loss. Those assets which are perceived as safe always entail some form of security, e.g. government bonds that are both paid and guaranteed by the US government and that come with a 3—10% return on a 30-year bond. With such assets, people feel certain that the money in which they have invested is guaranteed and they typically leave a sense of stability overall (as in the example of the US government, which is unlikely to run out of business, that poses as a sign of security for the bonds). Stocks, on the other hand, can easily increase by 30—40% and drop the same percentage immediately afterward, which is why they are considered to be riskier assets.
In the world of bonds and stocks, people have always used the ability to allocate their funds from one to the other. As bonds come with a greater percentage return whenever things are going well and a significantly lower percentage return when things are not so well, people turn to them whenever the circumstances seem to be unsafe. Therefore, each time people see that the economy is booming, they will invest in stocks and not in bonds, which eventually leads to an increase in stock prices and a decrease in bond prices. However, the moment people feel concerned due to some external factors or events, they will immediately sell their risky assets and allocate their money to safe assets. People will then be piling money in bank deposits, bonds, or utility stocks, which are considered to be less risky, and this is the one reason why assets’ value increases. These surges and reductions in prices almost always stem from people’s decision where to invest their money, which is noticeable in the currency market as well.
When the COVID-19 pandemic started, the US and world economies shut down and we have witnessed major GDP drops across the globe. It is interesting to note how the JPY, the official currency of Japan, skyrocketed by 11.6% in just 4 weeks. To make a comparison, forex traders are more than satisfied with a half a pip growth in one week, so this sudden change had a message to convey. The only cause of such a rise was people looking to buy the currency in question, which seemed like a wise decision in times of crisis and unpredictability. This was an example of a risk-off move where people are eager to buy safe investments for the sake of exiting the riskier assets. Such conversions always affect currency prices, so if people are willing to buy US government bonds as a safe investment, the money will flow into the US and the USD as well. Aside from the US government bonds, ranked the first owing to the US economy is the largest one in the world, China’s and Japan’s bonds are also considered to be the safest assets and respectively hold the second and the third place in terms of their economies. People will always look to invest in these countries’ assets because they are believed to be the least likely to collapse, making people’s investments as secure as possible. Australia, for example, may not be able to pay off all the bonds due to a lack of money or wealth, which is what people may feel worried about when choosing where to invest their money.
Risk On/Risk Off
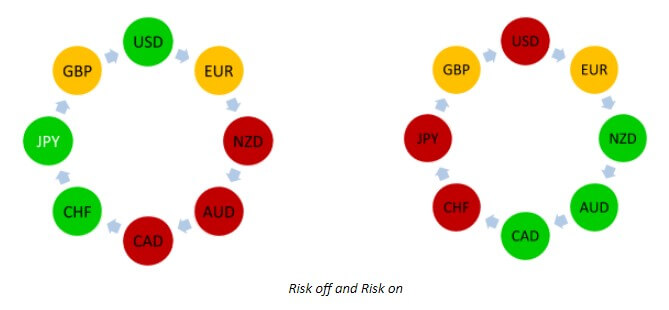
From the perspective of history, the JPY, the USD, and the CHF have traditionally been viewed as currencies of safety, while the NZD, the AUD, and the CAD are considered to be risky currencies. The shapes below explain how the purchase of currencies works in different situations. A typical risk-off move occurs when people look to buy stability and sell what is risky. Whenever people are buying stocks, economies are growing, and there seems to be less worry about risk overall, we are seeing a risk-on move where growth currencies boom. They are called growth currencies because their economies are much smaller, so they can achieve much higher growth rates during times of prosperity. During these times, currencies such as the USD, the JPY, and the CHF, which are representative of their strong economies, would normally not do so well. The EUR and the GBP are usually always somewhere in the middle, more or less unaffected by the same factors as other currencies.
These moves and changes in currency preferences, however, need not always play out as we expect them to. Theory and real-life applications often differ in the world of trading, so traders need to have in mind that textbooks should only serve as guidance rather than absolute truth. The same discrepancy can be seen in any other line of business, where people often claim to not have been prepared for everything they encountered until they started building a business. Any resource we get hold of is meant to tell us how things are supposed to unravel, yet these prescribed scenarios should never be seen as carved in stone. For example, whenever there is panic in the market, the EUR is always found in the middle and the CHF is always perceived as a currency of strength. However, when the Eurozone was on the verge of collapse in 2012/2013, these two currencies were found in a completely different set-up.
The Eurozone attempted to take countries of different economies, currencies, and histories and blend them into one. Before any of these changes, the event of one currency dropping in value was able to affect that country alone, which allowed them to export their goods and services more easily due to them being cheaper and thus more appealing to other countries. When different European countries agreed to come together in 1998, many were doing exceptionally well, pouring money into the Eurozone. When Greece and other countries showed less preparedness to provide the same, the member countries with stronger economies began to complain, not wishing to keep funding the underperforming economies. At that time, the Eurozone did not have a functioning measure that would tackle these issues, so many people started to raise questions regarding the future of the EUR, which consequently became the riskiest currency. Then this worry affected the financial markets and the EUR lost its previous status.
The CHF, the usual currency of safety, which is also located right in the middle of the Eurozone, made people feel worried about what would happen to Switzerland and its official currency despite its long-held favorable status. The unsettled issues and rising concern made the currency fall from grace, leaving a need to allocate large sums of money in some other direction. Unexpectedly and suddenly, people showed interest in New Zealand and the NZD became the currency of favor for a while. As the Eurozone was affected by its internal troubles, people desired to look outside the continent and this is an excellent example of how external factors play a big part in how events play out. Therefore, stories, news, and history in the making are going to affect currencies and make them move outside their usual patterns. Today we see the USD as the currency of stability and safety, but this may too change because of the risk-on and risk-off moves people make. This is an extremely important correlation and traders should always acknowledge its impact. In addition, it is vital to remember that the decision on which currencies to pair in the event of equity markets going down is easy to make when there is knowledge on which currencies act as the currencies of safety.
Commodity Correlations
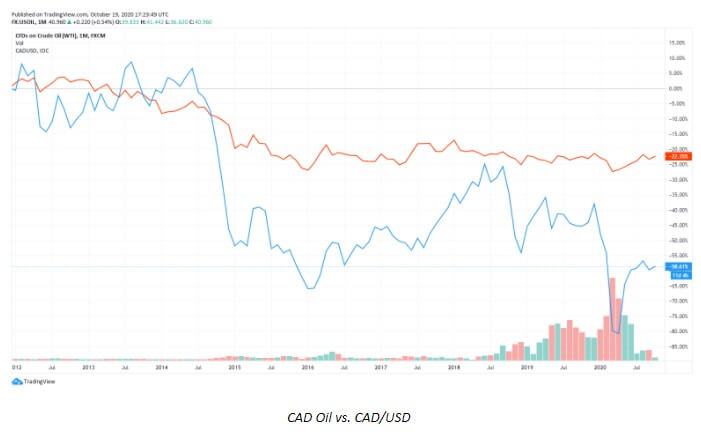
Canada is an excellent example of a resource risk economy, which further entails that a great proportion of its economy is dependent on its resources. Due to this reason, the price of resources is an extremely important factor for this country. Oil, in which Canada is abundant, is known to have affected their economy through history. For example, in 2005 when the price of oil shifted to $150/barrel only to go back down and up again impacted Canada to a great extent. Such price alterations meant that the country had to close down oil production and put a lot of people out of work, which increased unemployment levels, decreased taxes the government could collect, and ultimately made their bonds a lot riskier. This story exemplifies how relevant these commodity correlations are, as commodity prices inevitably influence people’s buying preferences and the entire strength of an economy. It is, however, interesting to note that, while there always seem to be high correlations between the CAD and the price of oil, between 1986 and 1991, the price of oil increased while the CAD remained unchanged, which only points to a conclusion that these correlations are not always present.
Some other correlations are vivid in the gold market, especially in connection with the three currencies that are highly correlated with the price of gold: the CHF, the AUD, and the NZD. Today, the CHF is the only remaining currency still pegged to the gold standard, which means that any desire of the Swiss government to increase wealth needs to be carried out through the acquirement of more gold. Whenever a country buys great quantities of gold, whose price increases around the same period of time, the country in question immediately becomes that much richer and is much more likely to be able to pay up on its bonds. This has a direct impact on the way the currency and the country are perceived by people, who are then increasingly more likely to see them as stable and safe and are, thus, more willing to purchase their bonds. Alike the CHF that is backed up by gold, Australia is also closely connected to gold due to its mining. Furthermore, the NZD which is tightly connected to the AUD is then also likely to be impacted by any changes occurring with the price of gold and the AUD. Therefore, should the AUD go up as a result of the changes in the price of gold, the odds of the NZD changing are higher and vice versa. The AUD, the NZD, and the CHF all have a positive correlation with the price of gold, which further entails that they will typically rise when the price of gold does as well.
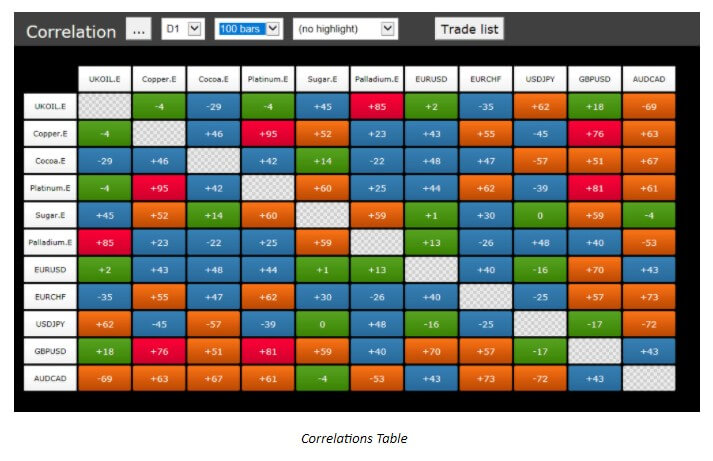
We can find these correlations with other currencies as well, for example, the South African rand and the Swedish krona have both demonstrated high correlations with the price of gold although we typically do not trade them. The USD also shows proof of such correlation with gold, although a negative one, which signifies that the price of the USD will generally fall whenever the price of gold rises. Moreover, whenever we consider the prices of oil and gold, we are able to develop an insight into what is happening with the CAD, the AUD, and the CHF. Some websites even offer tables with information on different correlations, so as the table below suggests, copper is mildly correlated with the EUR.
Currency Correlations
When we discussed another type of correlation above, we explained how the AUD is highly positively correlated to the NZD because of the close proximity, which also means that the two will be each other’s greatest trading partners. Another example of geographic closeness is that of Canada and the United States of America, and such ties will always imply that whatever happens to one country is probably going to affect the other one as well. With Australia and New Zealand, it is interesting that their common trading partner apart from one another is China, which is a very big part of their GDP and export. Again, if anything occurs in China that should impact its economy, both Australia and New Zealand will feel the reverberation of these events.
As the Eurozone is a very peculiar unit, when the coronavirus took over the world by storm, the entire union took on a meticulous plan on how to tackle the challenge. There were signs of problems in Italy and Spain early on, yet the effort to shut everything down and make everyone comply with the rules led to lasting changes for the better. Unlike the US, they crushed their economy right on the start only to come out later on even stronger. With the United States, the economy was always semi-closed, so the number of people affected by the virus kept rising while no effective change was recorded. Since the Eurozone’s economy improved after they had it closed off, this also helped the neighboring countries and their currencies – the CHF and the GBP, which are all going to be positively correlated, moving together in the same direction.
Examples of such currency correlations are numerous, so for example the EUR and the USD have often shown signs of negative correlations, meaning that when one goes down, the other one will go up and vice versa. Traders can find information on these currency correlations on different websites and even check for various time frames to draw more advanced conclusions (see the table below). Nevertheless, apart from such correlations calculators, it is important to mention how certain experts loudly criticize the general approach of different educational sources to currency correlations due to the difficulty and impracticality of their application in real trading.

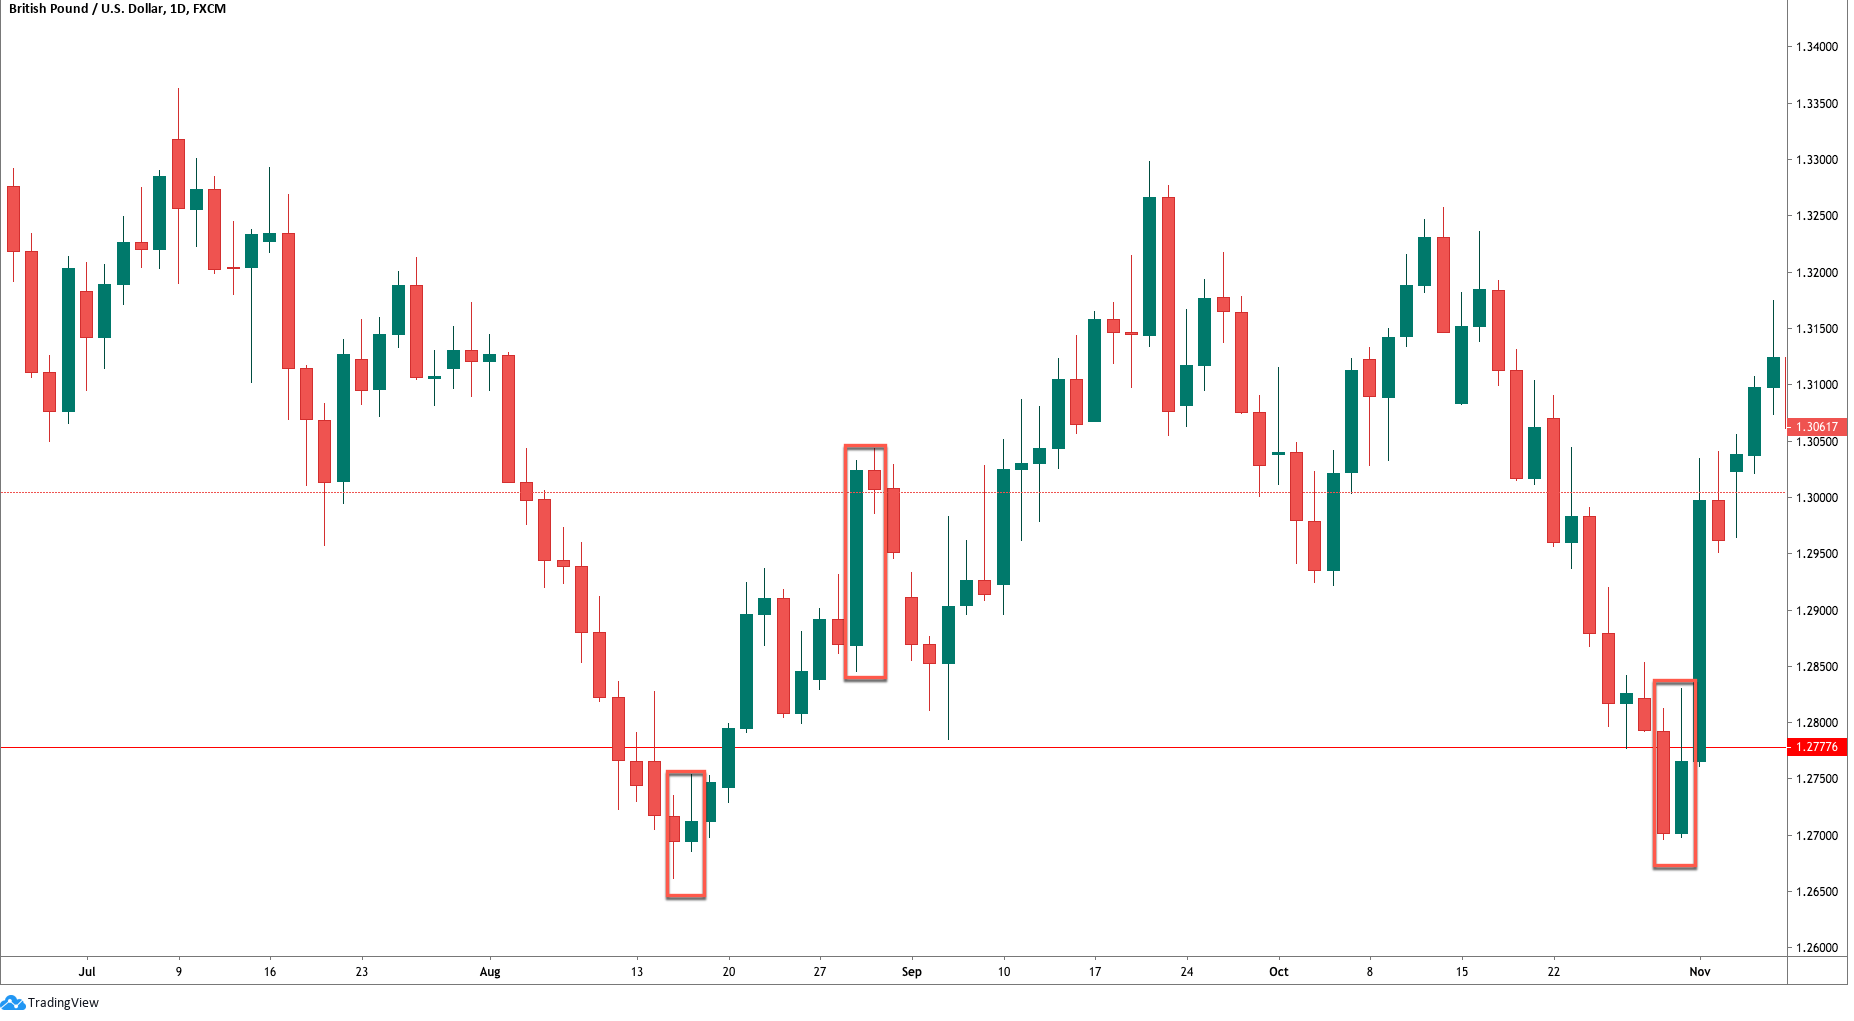
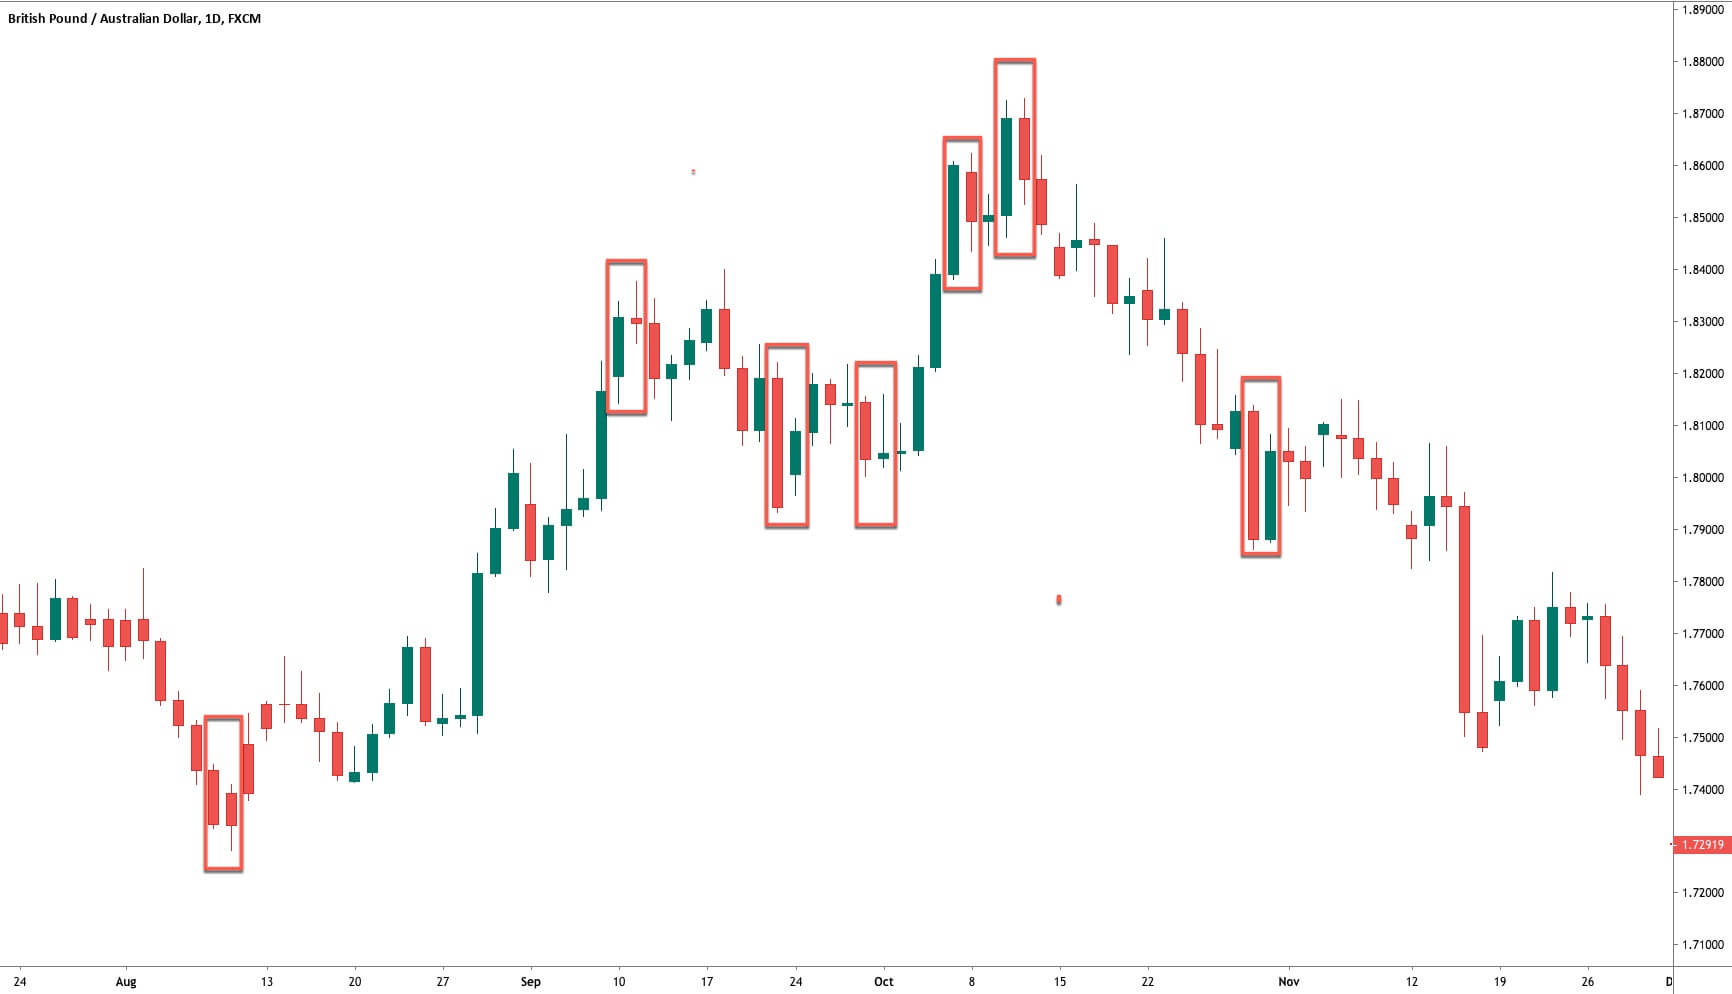
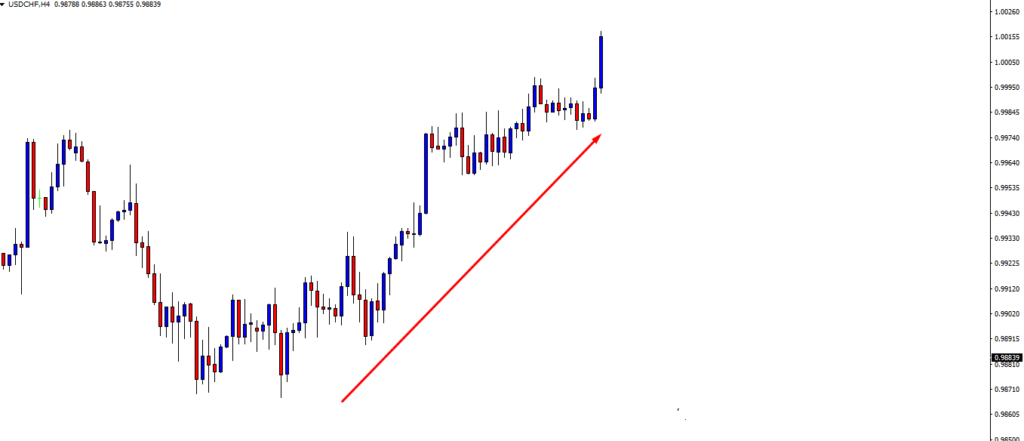
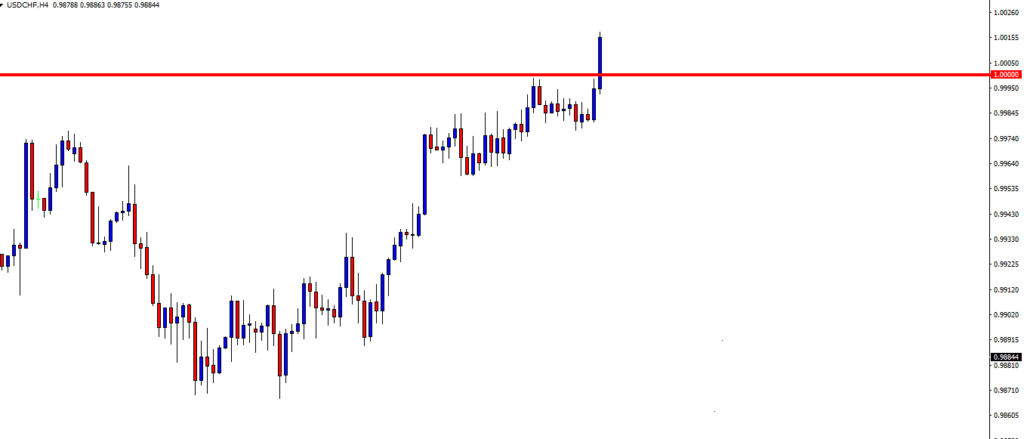
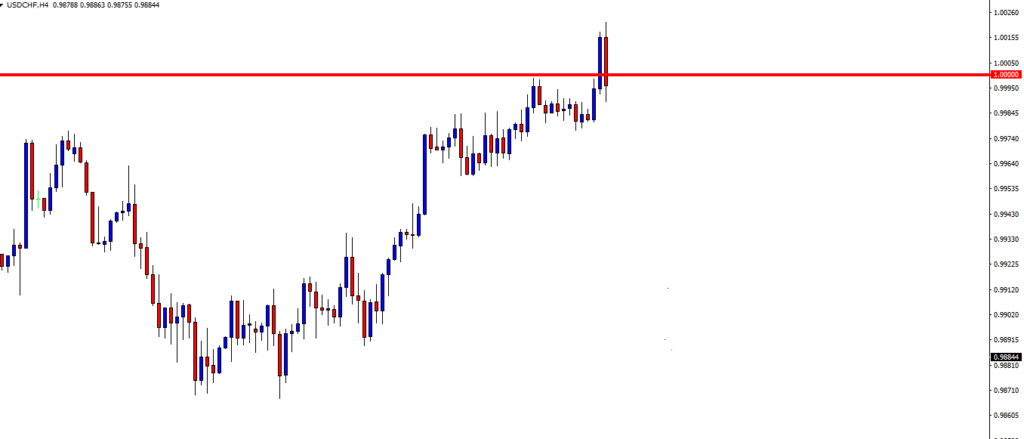
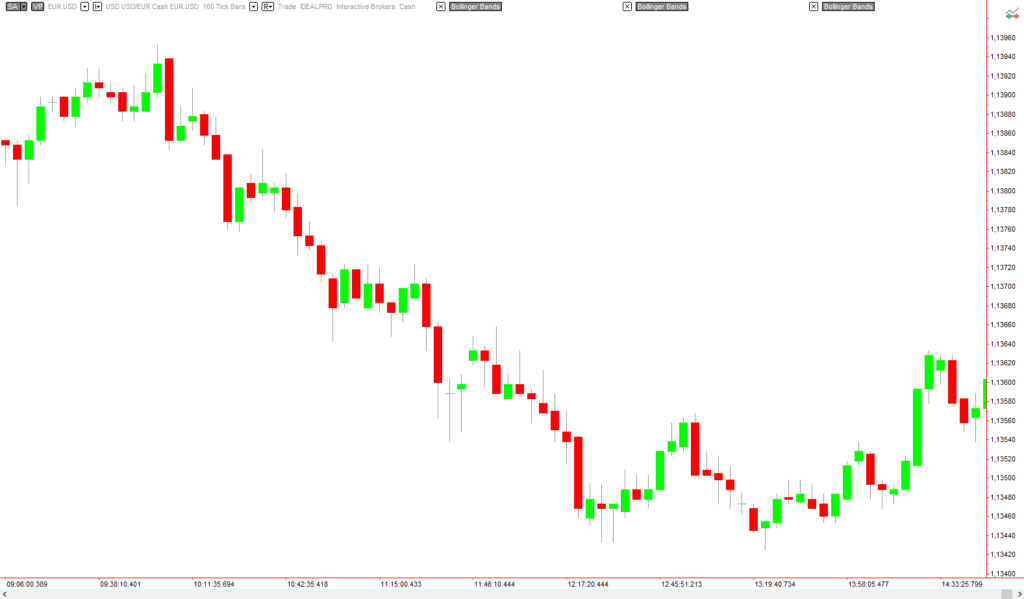
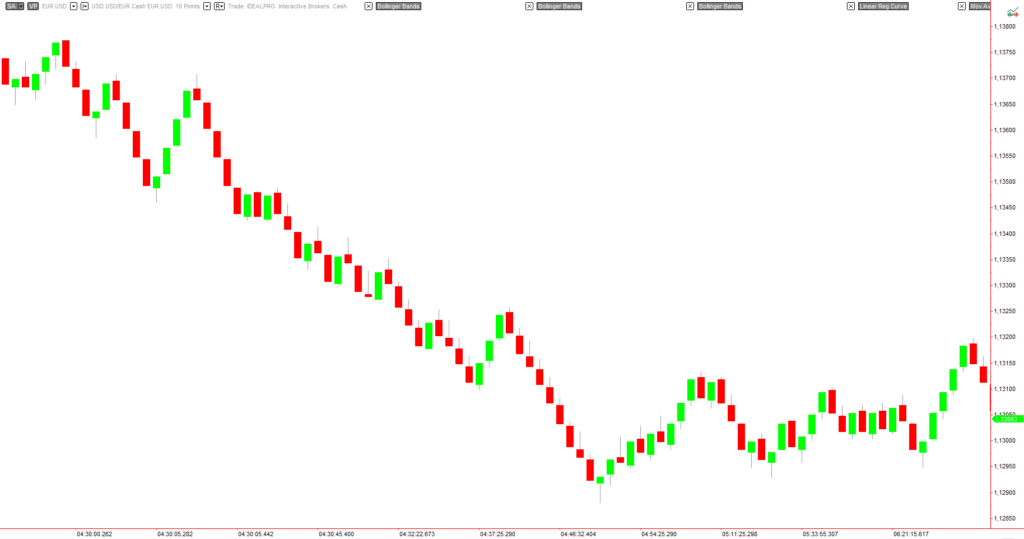
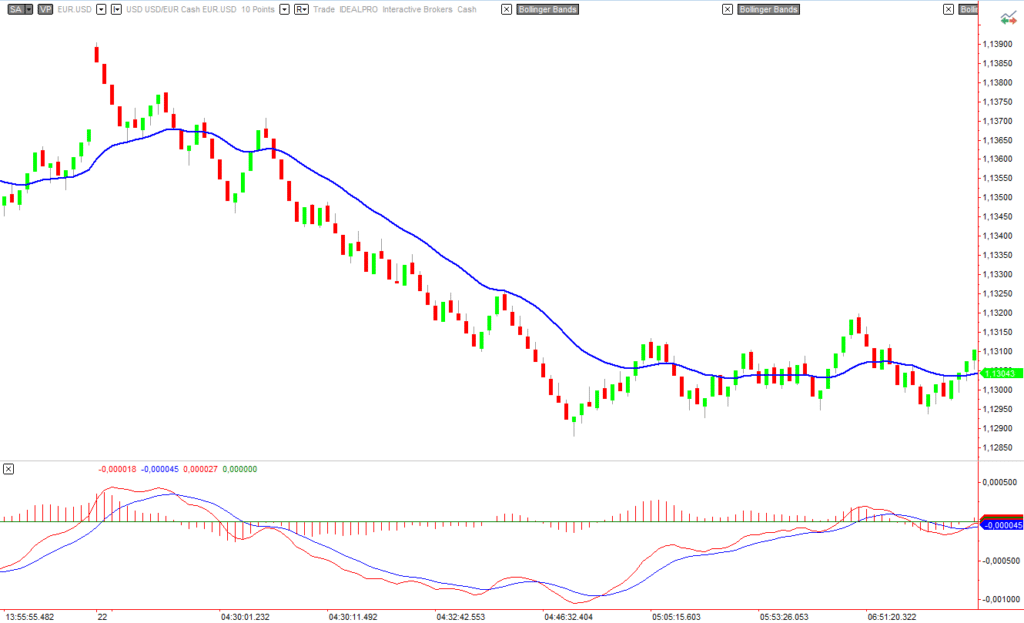
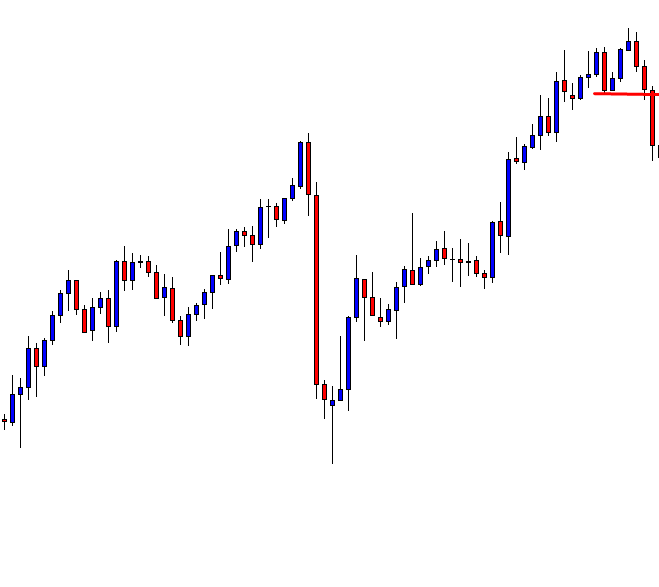
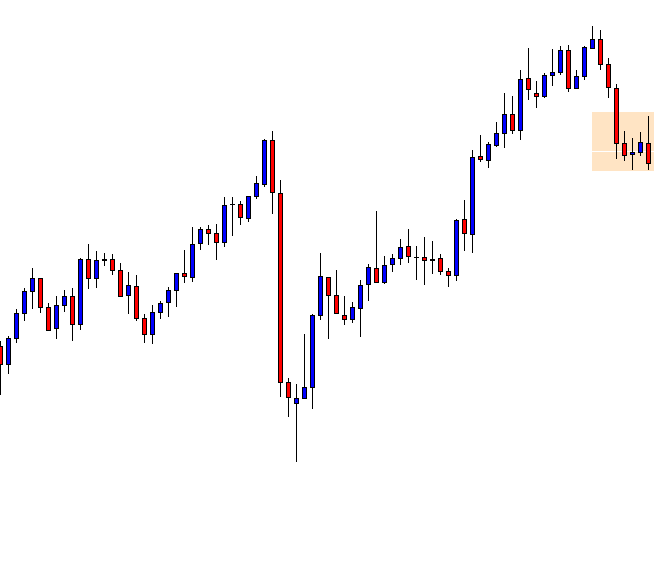
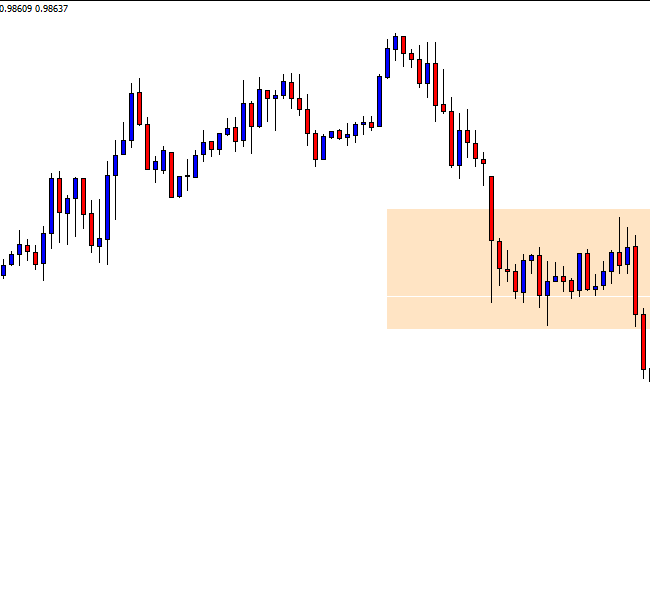
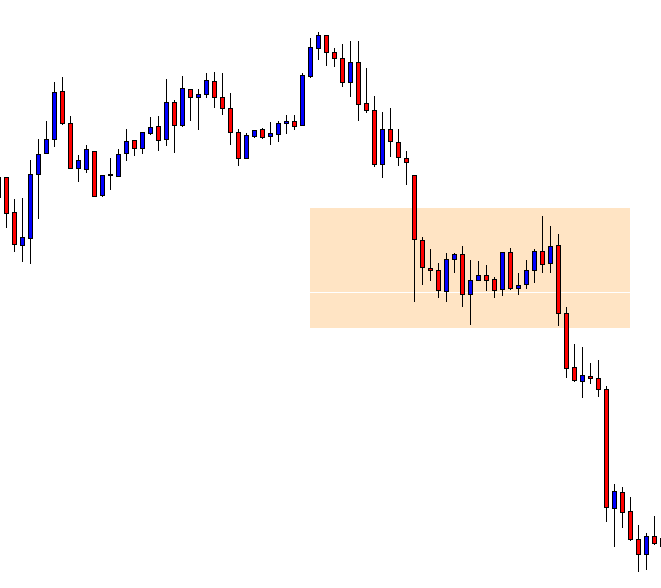
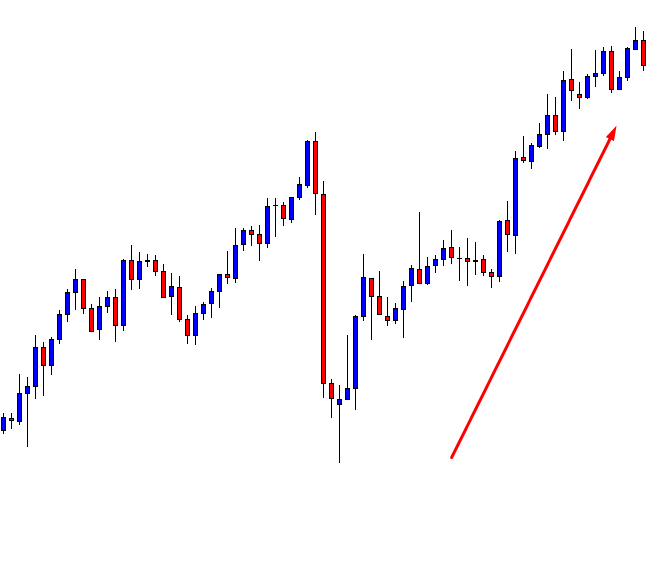
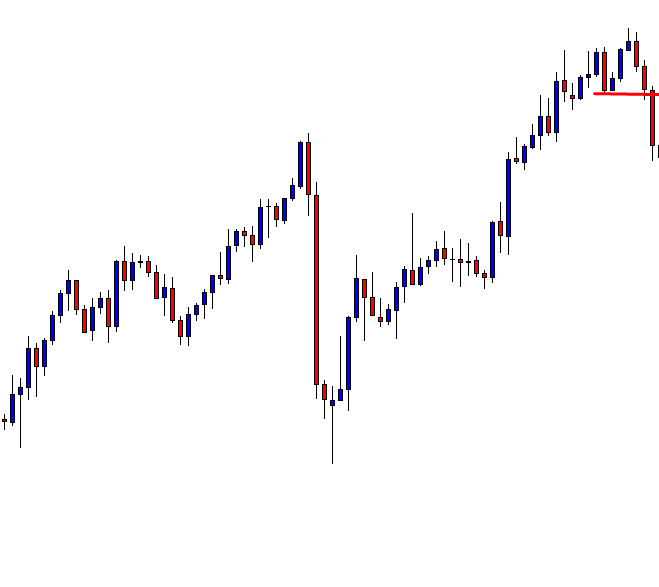
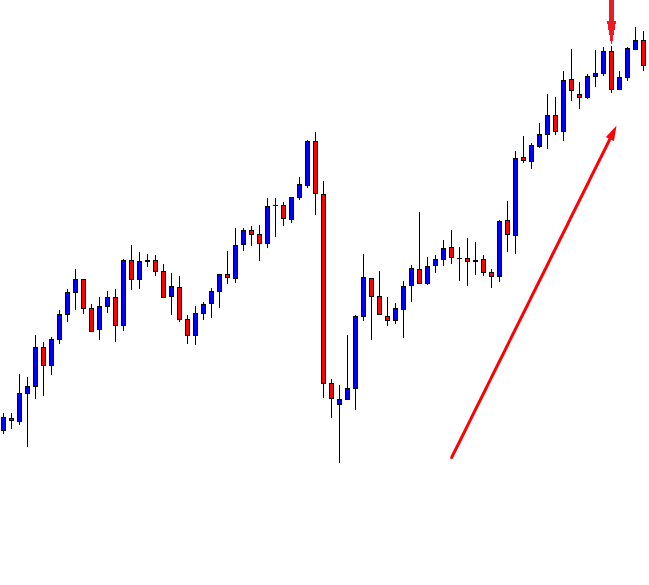
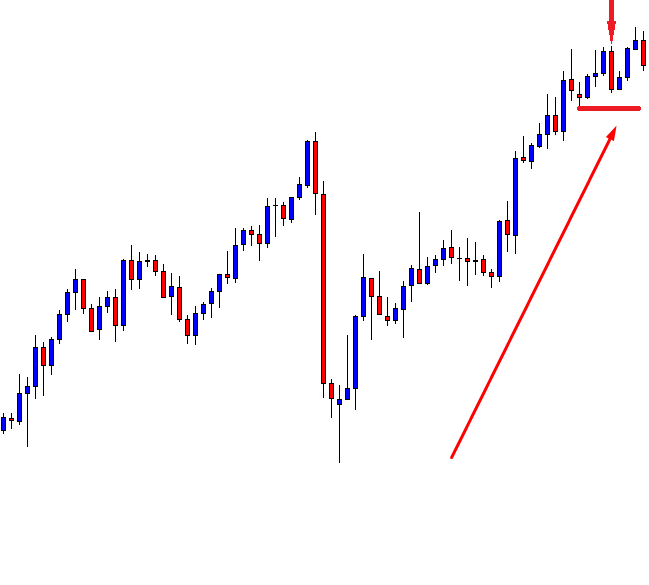
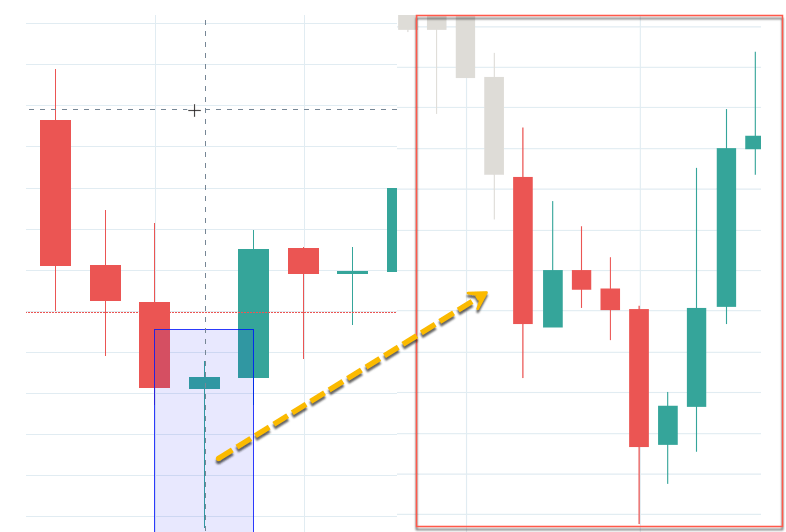
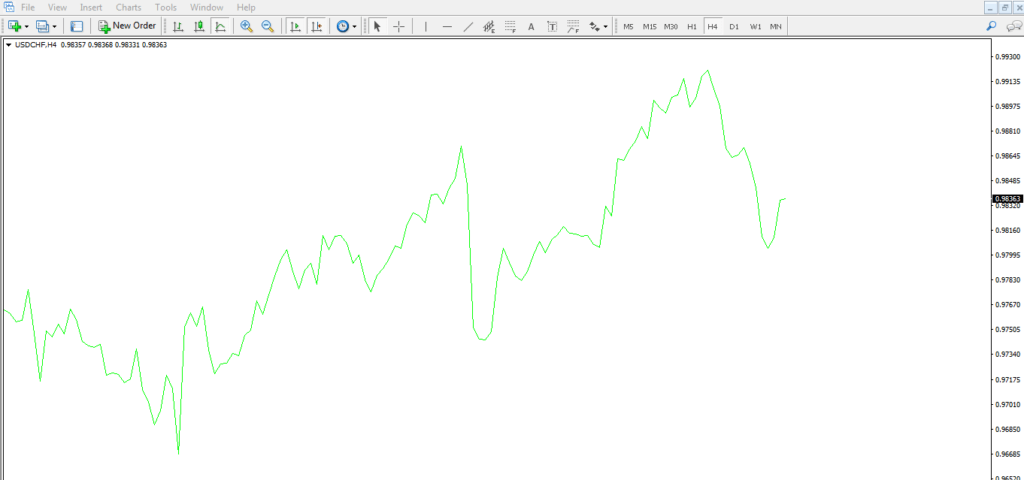
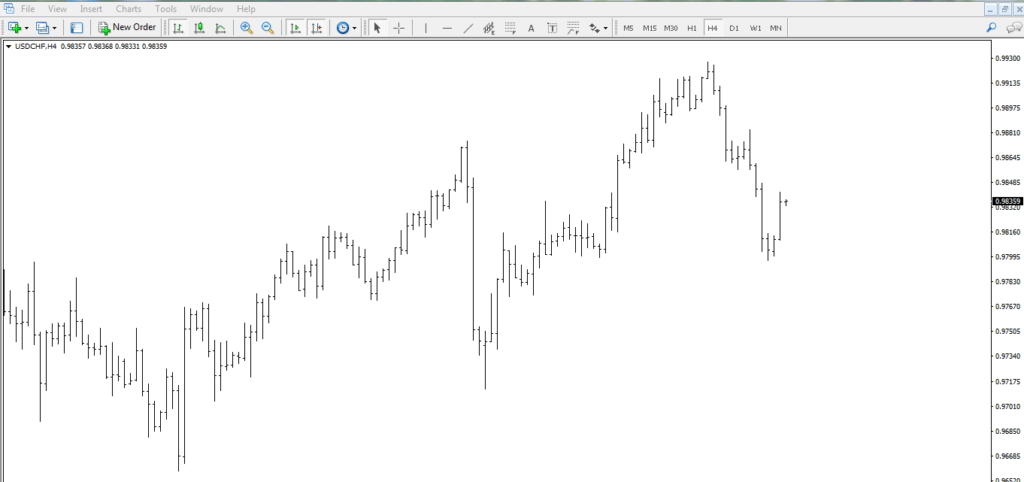
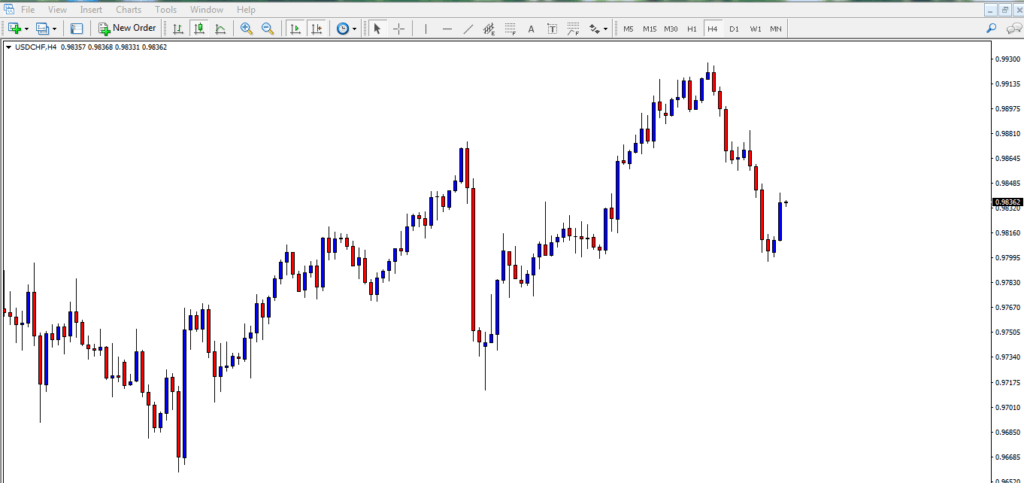
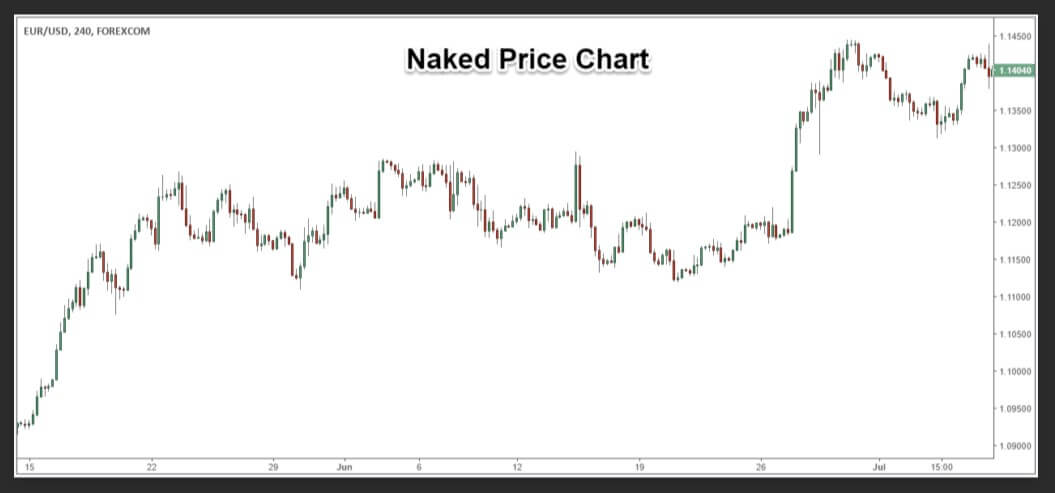
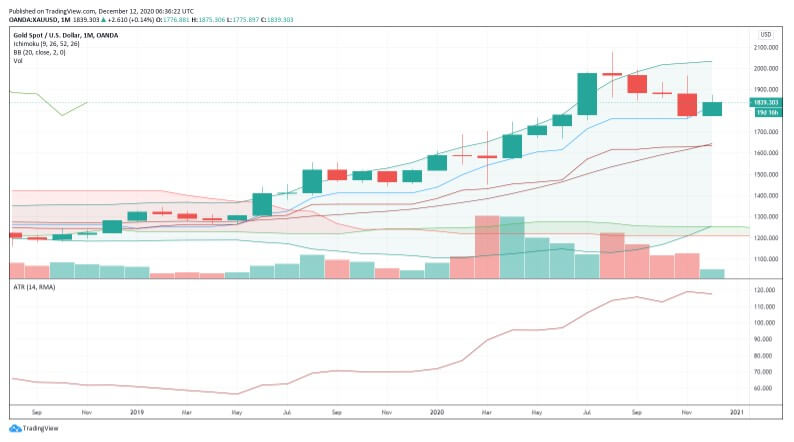
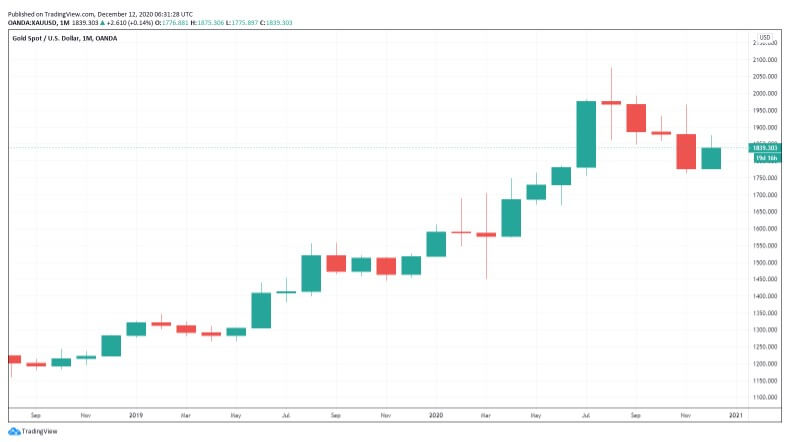
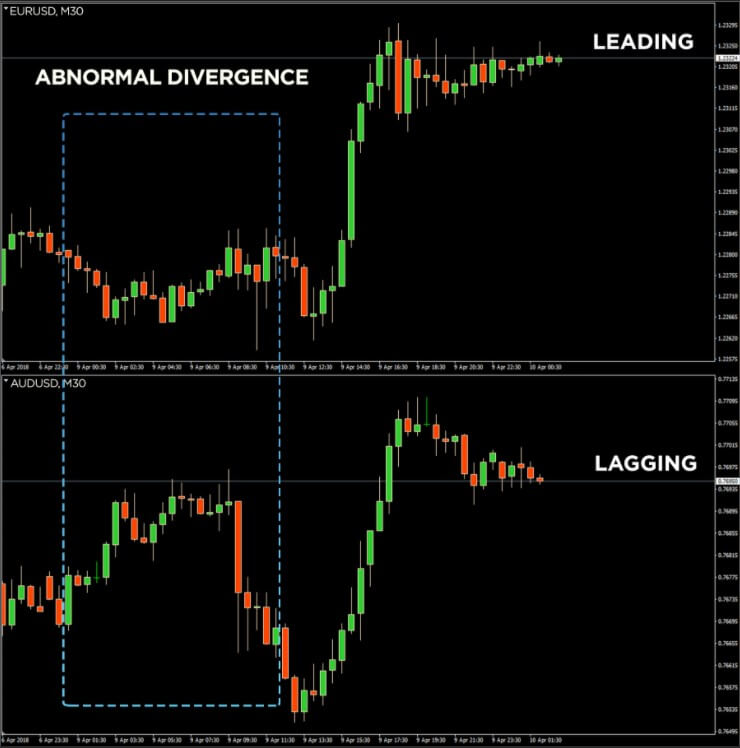
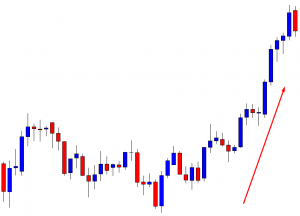
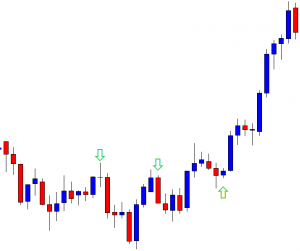
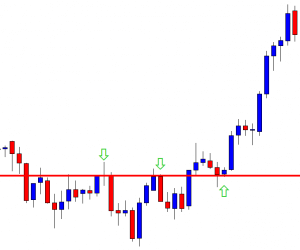
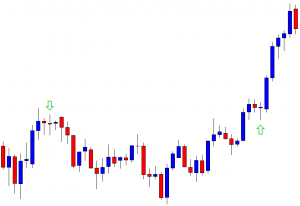
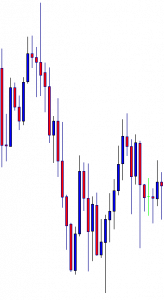
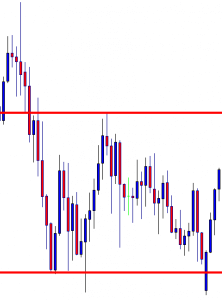
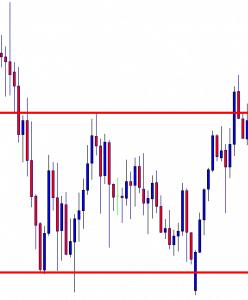
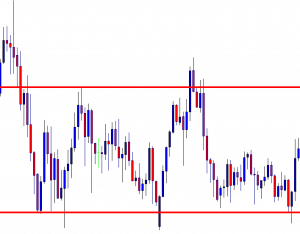
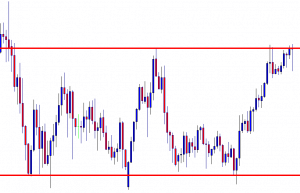
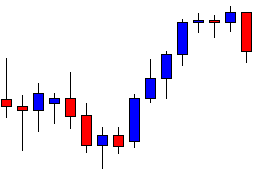
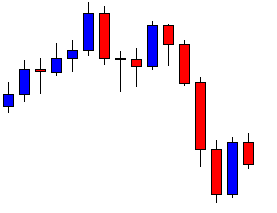
While many assume that a currency that is currently strong will be equally strong against many other currencies and not just one, some forex experts claim that such knowledge is impossible to use in everyday trading. These individuals also find it hard to believe that several currencies moving in the same direction can be taken as a predicament of some future movement. They claim how traders are keen to receive a signal that would warn them about some market changes but how these signals are unlikely to be found in currency correlations themselves. Therefore, whenever traders find two currencies moving together in a correlating fashion in the chart, they are prone to assuming that they will also change direction at the same time due to this inter-connectedness. However, since they are moving exactly the same, the chances of traders receiving the early entry signal they may be eager to get are probably very slim. What is more, this group of experts insists that there are no two charts that show true correlations, which is why they are inviting all traders to compare any two charts they believe are correlating and assess them candle by candle. They argue that all traders will be able to see a different picture details as well as understand that the two currencies are not truly correlating once they start considering all (ponder on the following two images).
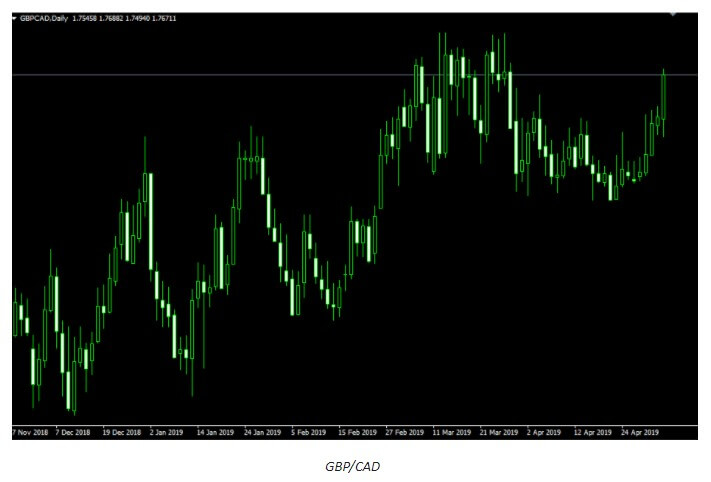
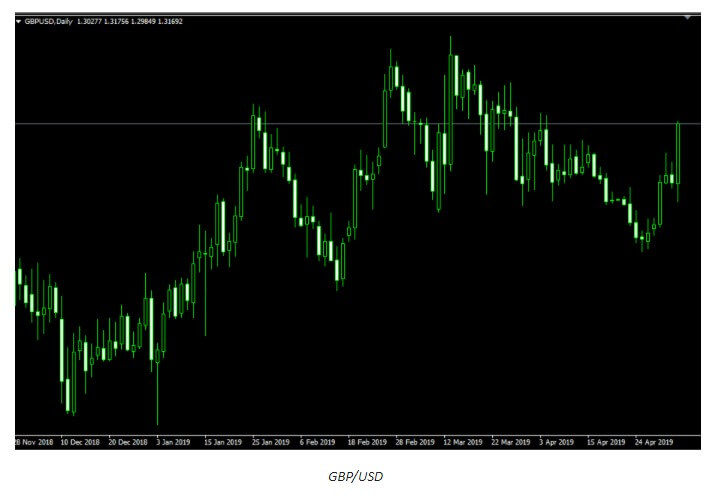
It is paramount that traders understand that many a time what they see in a chart is not an indication of any correlation but a special circumstance where one strong currency is leading the pair. What often happens is that one currency has greater importance than the other one in terms of how this currency controls whether the pair moves up or down. The examples above show how the GBP just mattered more and, whenever this happens in real trading, you will see two charts that look very similar and think that currencies may correlate as a result. Out of the eight major currencies, the EUR and the JPY are the easiest to spot whenever they are in such a position of power. These circumstances cause many charts involving the two currencies to look the same, but it does not mean that they are correlating. What traders can do in such situations is check another related chart; so, if the EUR/AUD and the EUR/NZD pairs appear to be the same, traders should look up the AUD/NZD chart. It is, therefore, crucial that we look into matters more deeply and analytically so as to prevent ourselves from taking currency correlations literally.
While some forex expert traders claim that currency correlation is a phenomenon that simply does not exist, they admit to pairs being able to run together. What they do contribute to this statement is that pairs, however, need not run together at all times. If currencies could be controlled, everyone would have been using this information by now and, since we have no tangible proof of currency correlations, the best approach to take is to work on individual trading systems that are sure to bring traders the signals and trades that can weather through any market despite the natural market oscillations and changes.
Conclusion
The excitement over correlation varies from trader to trader although it is impossible to deny how different external factors have a tendency to impact various markets. What traders need not focus on is any specific currency; however, the knowledge on risk-on and risk-off moves are rather important because they determine various market movements. If you are eager to get a good trade, simply consider the risk you are leveraging and understand how specific correlations with related markets can assist your trading. Nevertheless, besides connecting these dots, the only thing you can truly feel you can trust and the only thing you can test both backward and forward is your own system. Traders often exhaust themselves looking for information outside their systems, when in fact it is the algorithm and individual set of values and skills that will determine one’s success. Anything else has a much higher chance of sabotaging your efforts and your system, taking you away from something that can work well. Therefore, if your system is telling you to make a specific move and enter a trade, do not go against it just because of the idea that some presupposed correlation is going to lead to a better or worse scenario. Rely on the entire knowledge of markets and the histories of countries and currencies but always trust your system on how to manage your trades and all market ebbs and flows.





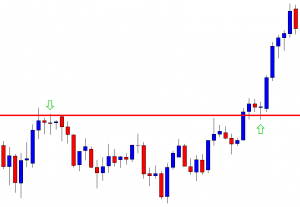



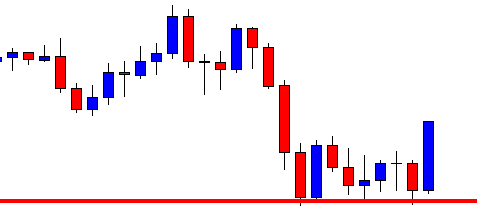
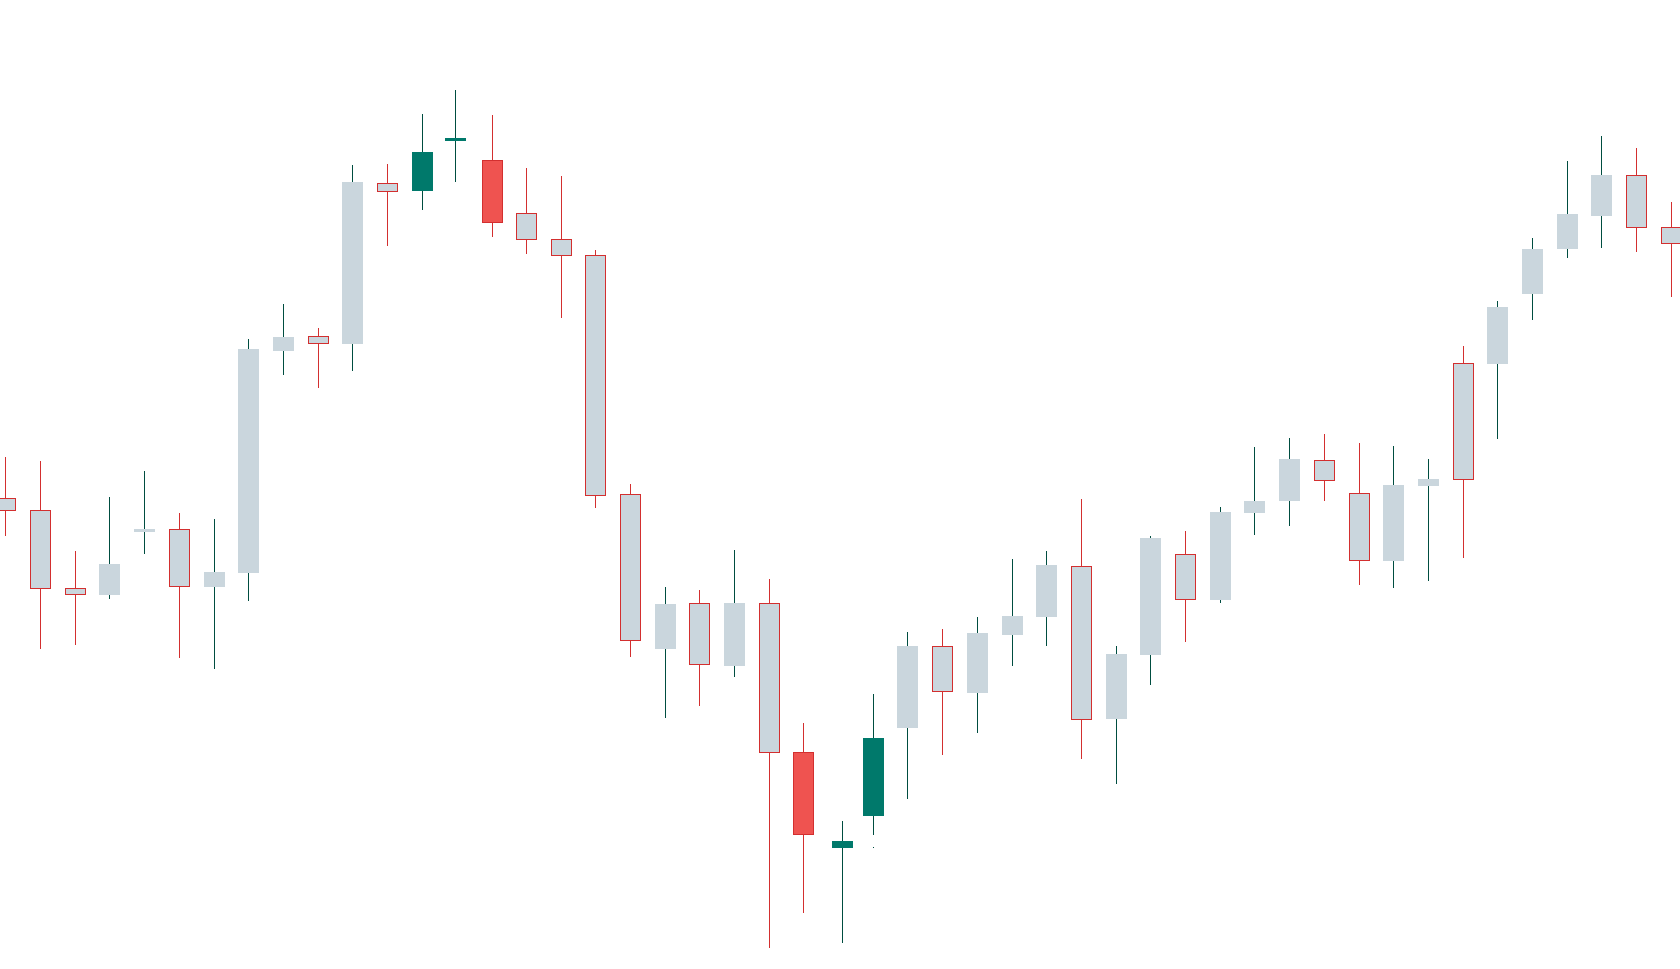
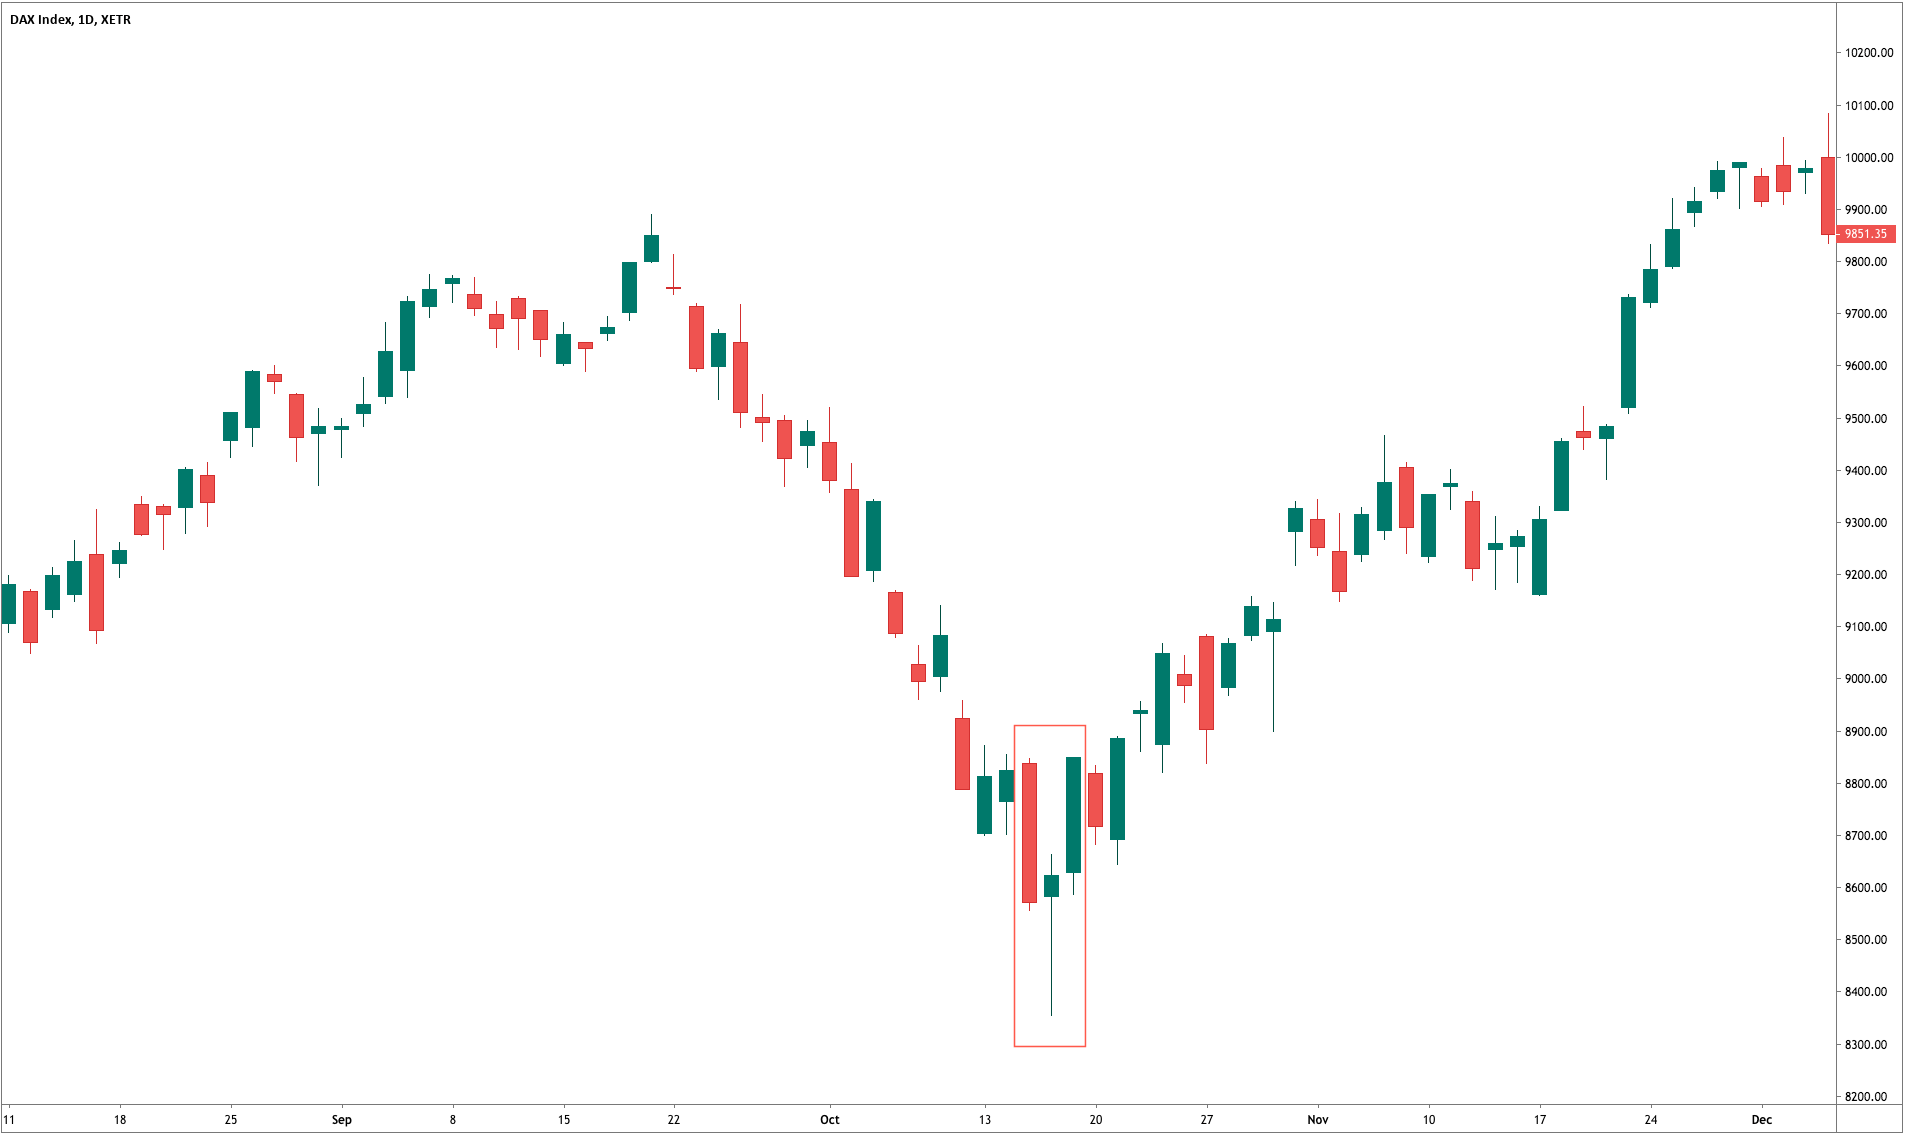
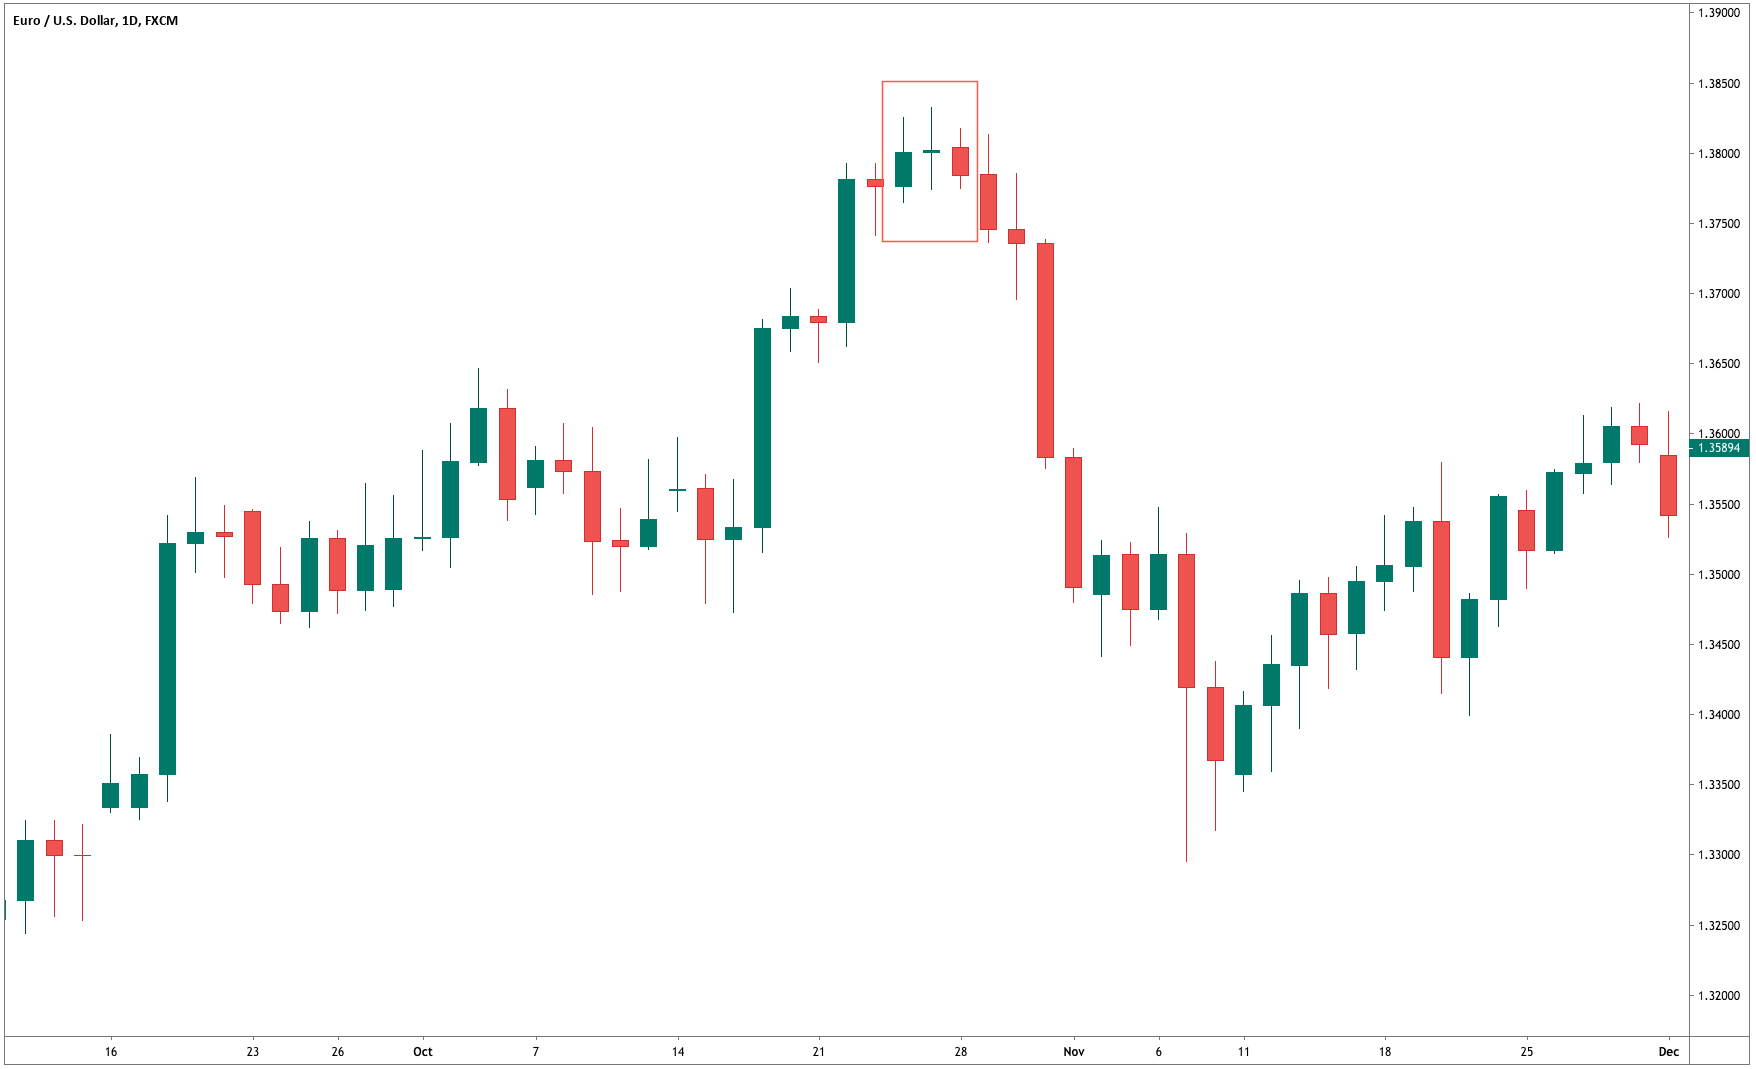
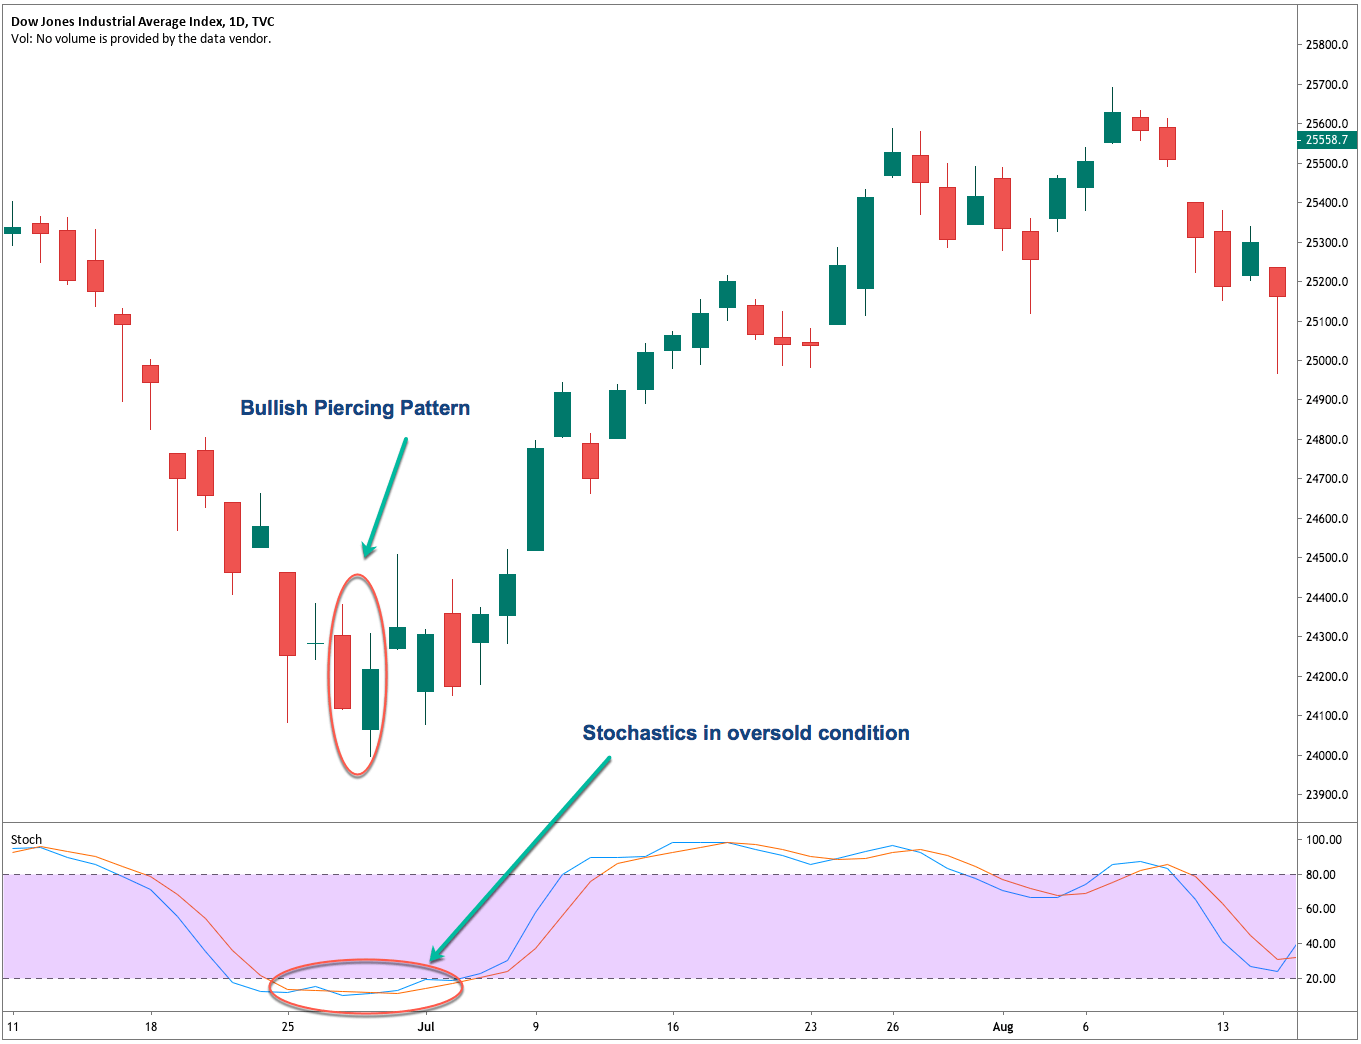
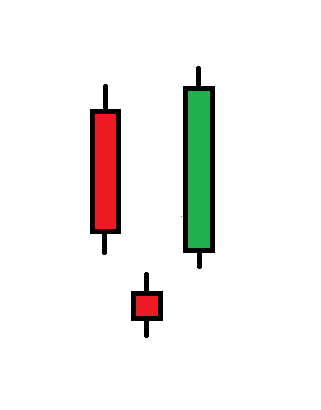
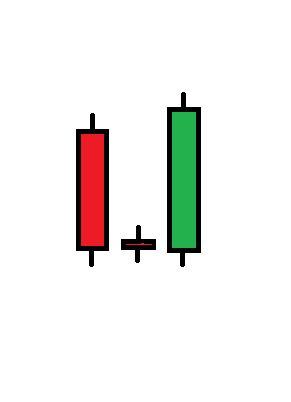
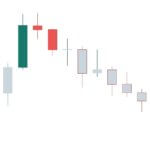 As the case of the Morning Star, a gap up on the second small-bodied candle followed by a gap down on the third black candle is further confirmation of a reversal, but that seldom happens in the Forex Market. Also, the third candlestick is asked to close below 50 percent of the body of the first white candle.