A candlestick is a type of price that financial markets’ charts use to display the high, low, opening, and closing prices for a particular period. It is the most commonly used price chart among financial traders nowadays. It does not only show the high, low, opening, and closing prices but also represents the true psychology of the traders. This is the main reason for the candlestick/candlestick chart being the most popular chart in the financial markets.
Let us demonstrate two typical types of candlesticks to find out how they look and how they are formed.
Let us start with a Bullish Candlestick.
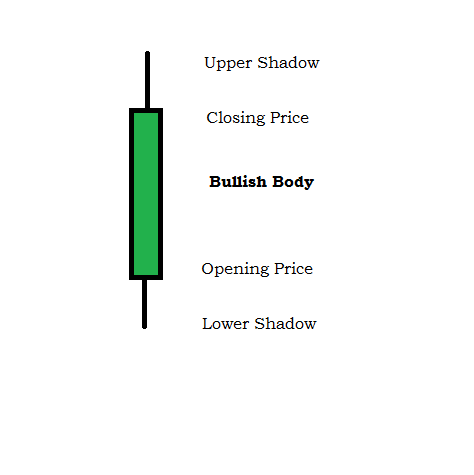
In a Bullish Candlestick, the price opens at the downside; goes down and goes up again. This is what creates the lower shadow. The price continues to go upwards and goes all the way up to where the upper shadow ends. It comes down and closes at the Closing Price. This is what creates the Upper Shadow. Eventually, Opening Price and Closing Price creates Bullish Body. A Bullish Candlestick is usually represented by Green or White color.
Let’s have a look at a typical bullish market in Candlestick Chart.
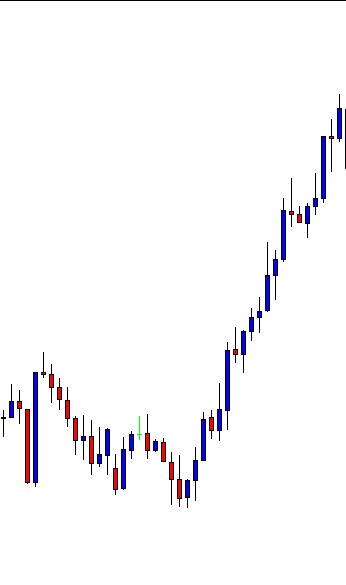
The chart shows that the market is bullish. Most of the candles are bullish candlesticks. Thus the price heads towards the North. However, not all of them have Upper Shadow, Lower Shadow, or a thick Body that we have demonstrated in this lesson earlier. The market produces several types of Candlesticks, and they convey different messages to the traders.
A Bearish Candlestick is just the opposite. Let us have a look at that.
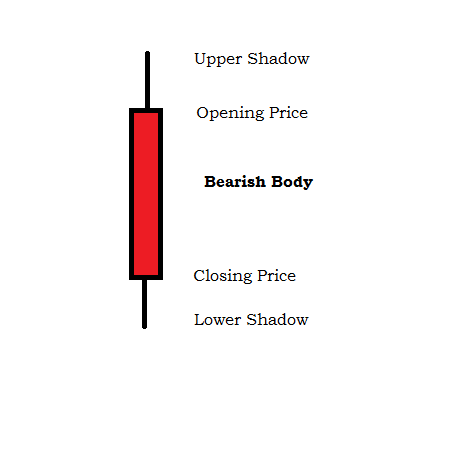
As we see here, that the price opens at the upside. Goes up and comes down to create the Upper Shadow. Comes all the way down and closes the price a bit further up. This is what creates the Lower Shadow. Difference between the Opening and Closing Price creates the Bearish Body.
Let us have a look at a bearish market in Candlestick Chart.
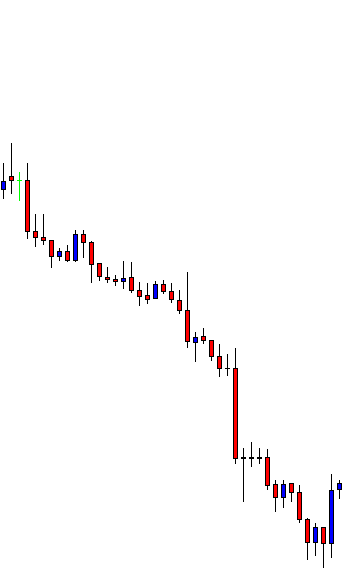
Same goes here. Not all the candlesticks are as typical as we have demonstrated in our lesson. However, the message is clear here. The price is bearish because of the dominance of Bearish Candles.
Not all the candles with a bearish body (or bullish body) declare the supremacy of the bearish market (or bullish market). By being able to read them well, traders can predict the market’s trend, trend continuation, and trend reversal.
In our fore coming articles, we will learn different types of candlesticks that the market produces; how they look like; what message they convey to the traders; how to read and make a profit out of them.