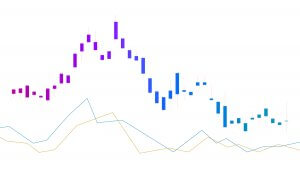
In today’s example, we are going to demonstrate an example of a fundamental character of support/resistance. We know the importance of support/resistance in trading. Thus, if we get a clue about spotting support/resistance well ahead, it comes out handy. Let us find out whether it is possible or not.
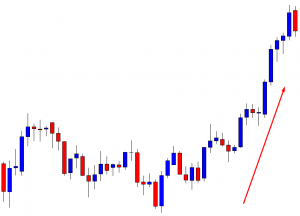
This is a daily chart. The chart shows that the price heads towards the North with good bullish momentum. It makes bearish correction and keeps resuming its bullish journey. With naked eyes, we see that the price finds its support at three points. Let us investigate the chart with some drawings on it.
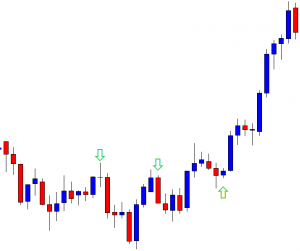
We have spotted out three points where the price gets rejection twice. When the price makes a bullish move, at its second wave, it finds its support at the third arrowed point. It works with a simple equation. Can you guess what that is?
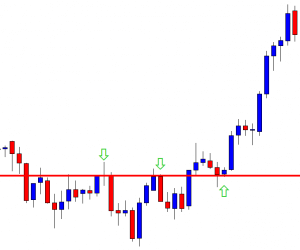
Let us draw a line. We see that the price gets rejection at the same level twice. It means it is a level of resistance when the price is bearish. The price breaches the level later and finds its support at the same level. It produces a bullish reversal candle and heads towards the North. Once the price makes a bullish breakout, the buyers shall wait for the price to make a bearish correction. If the level produces a bullish reversal candle, the pair may head towards the North by offering a long entry. This is what happens here. Let us see the same chart by zooming out.
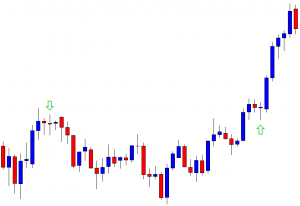
This is the same chart. We have spotted out two significant points and spotted them with two arrows. I assume this time you guess what I am going to say. Yes, the price makes a bullish breakout and finds its support at the breakout level. This is the level, which is a level of resistance in this chart. Since it gets broken and the chart produces a bullish reversal candle, the buyers may go long in the pair again. Let us draw a line here.
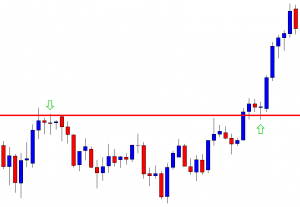
See how the price reacts here. Upon producing a Morning Star, the price heads towards the North with good bullish momentum. The price makes even a stronger move this time.
The plan of a buyer should be eyeing on the level to get a bullish reversal candle where the price finds its resistance when it is bearish and vice versa. This makes traders’ life easy, and in the end, it helps them make a better trading decision.


