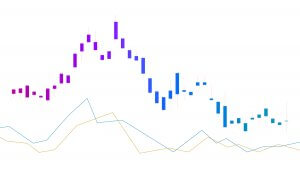
In today’s lesson, we are going to demonstrate an example of a chart offering an entry upon producing a bullish reversal candle followed by a breakout. The chart produces a bullish reversal candle earlier too, but that did not make the price move towards the North. We’ll try to find out why it does not head towards the North at its first attempt. Let us get started.
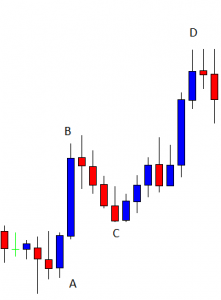
The chart shows that the price heads towards the North upon producing an ABC pattern. We may notice that we have four significant points here, such A, B, C, and D. The price most likely reacts at these levels again. Let us proceed to the next chart.
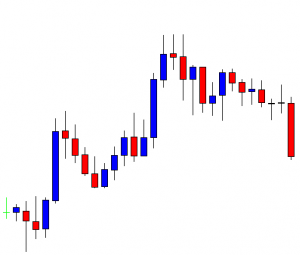
The price heads towards the South at a moderate pace. The last candle comes out as a bearish Marubozu candle. It seems that the price may remain bearish for a while. Let us proceed to the next chart to find out what happens next.
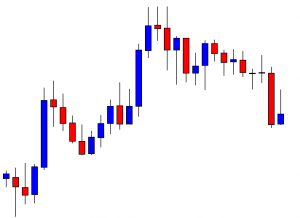
The chart produces an inverted hammer. It is a sign of a bullish reversal. However, considering point B, the price makes a bearish breakout at the level. Thus, the pair may continue its bearish move. The sellers may look for short opportunities in the minor chart.
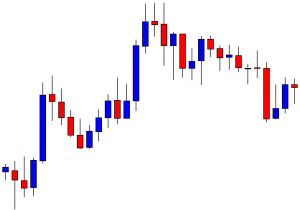
The next candle does not make a bearish breakout. It comes out as a bullish candle. The last candle comes out as a Doji candle. Ideally, neither the bull nor the bear dominates in the pair. The sellers are to wait for the price to make a breakout at the last swing low. The buyers are to wait for the price to make a bullish reversal candle closing above consolidation resistance. Let us see what the price does.
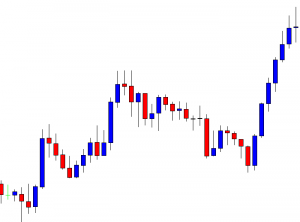
The price comes down. It produces a bullish engulfing candle. Some sellers may have to encounter a loss here. Upon creating the bullish engulfing candle, the price heads towards the North with good bullish momentum. Now a few questions may be raised here.
- Why does the price not head towards the North but comes down?
- Why does the price not continue its bearish move but produces a bullish engulfing candle?
- Why does not price head towards the North at its second attempt?
Have a look at the chart below with some drawings in it.
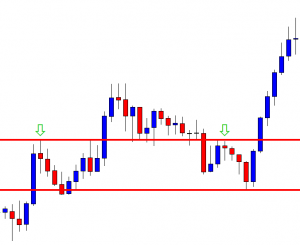
At its first attempt, the price does not make a breakout at the level of resistance drawn. The price reacts at this level several times. Thus, this is a crucial level, which is to be counted by the buyers before taking long entries. The price finds its resistance here and makes a bearish move. It finds its support at the drawn line, where the price reacts to it earlier as well. The reversal candle comes out as a Doji candle, and the chart takes four candles to make the breakout. This is one of the reasons that the price does not continue its bearish move.
At its last attempt, it produces a bullish engulfing candle, the candle is produced at a key level, the price makes a breakout at the last swing low, and the breakout candle comes out as a strong bullish candle. These factors attract more buyers and make the price move towards the North with good bullish momentum. We need to remember such factors every time we take entries as far as price action trading is concerned.


