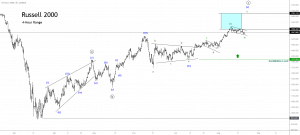
The NZDJPY cross continues its recovery after the massive sell-off that made it lose over 18.6% in the first quarter of the year when it plummeted until 59.49. From this yearly low, NZDJPY raised near to 17.9% to date.

Market Sentiment Overview
The market sentiment of NZDJPY exposed in its weekly chart reveals the market action showing bullish reversal signals after surpass and consolidate above the 26-week moving average.
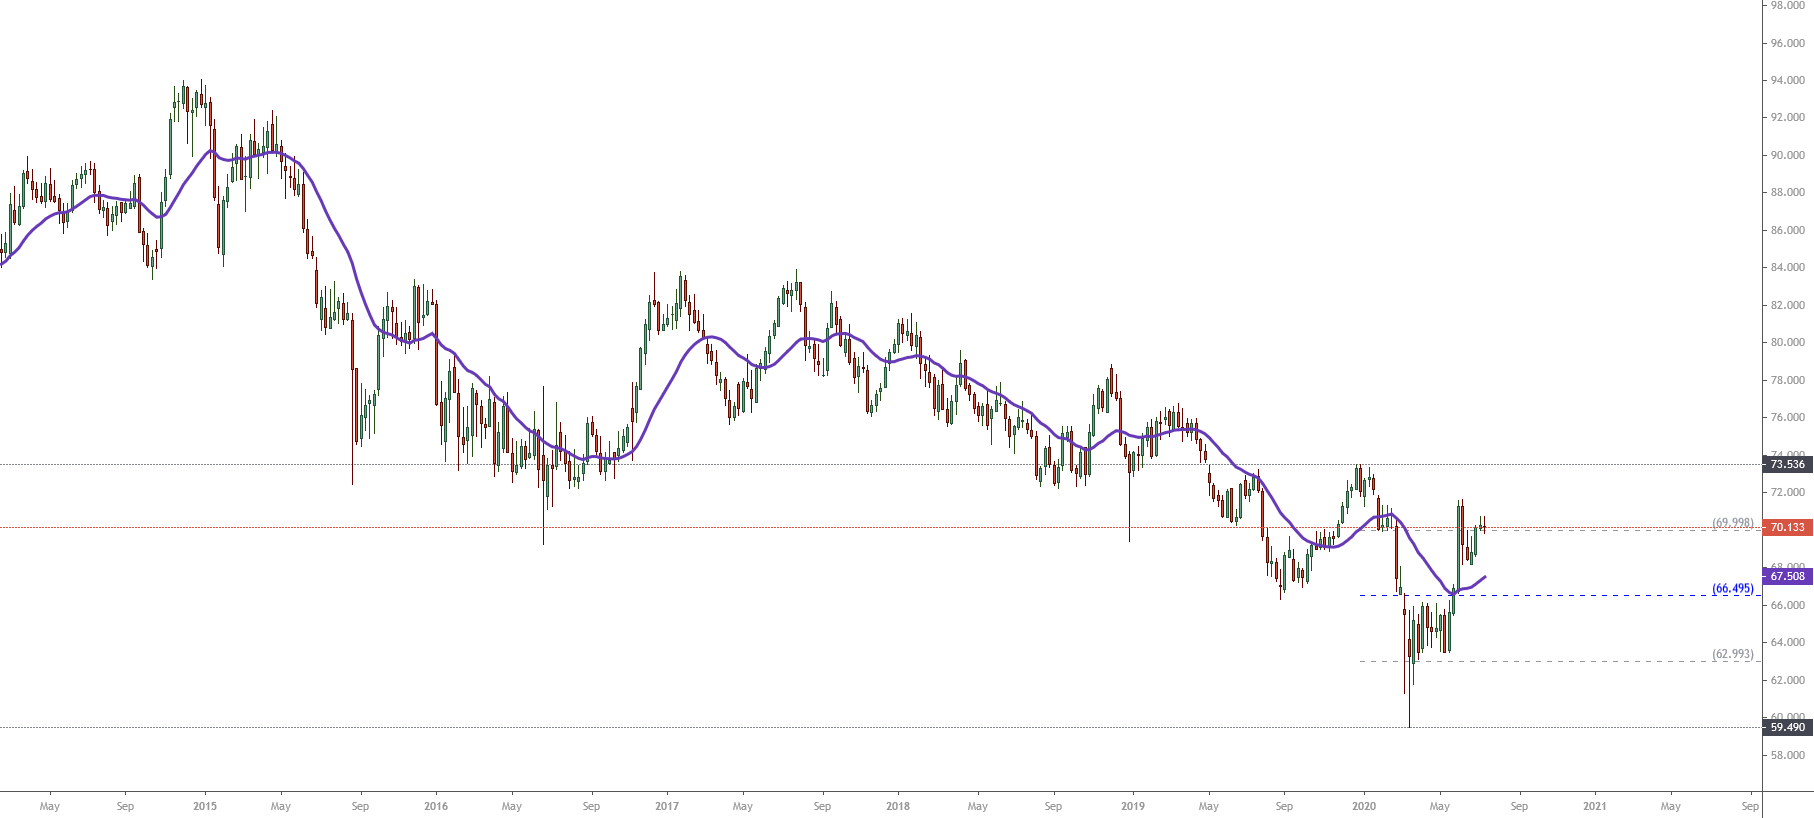
At the same time, we observe that, last week, the price closed in the upper zone of its 52-week range. This context leads us to conclude that the market participants might continue pushing the price higher.
The following figure shows the net positioning of the New Zealand Dollar and Japanese Yen futures. In the chart, we observe that institutional participants maintain a bullish pressure on the kiwi. At the same time, big participants on the Japanese currency continue having a net positioning to the long-side under 50% of the 52-week high and low range.
Consequently, considering the market sentiment on both the NZ Dollar and Japanese Yen futures, we could expect more upsides for the NZDJPY cross.
The Elliott Wave Outlook
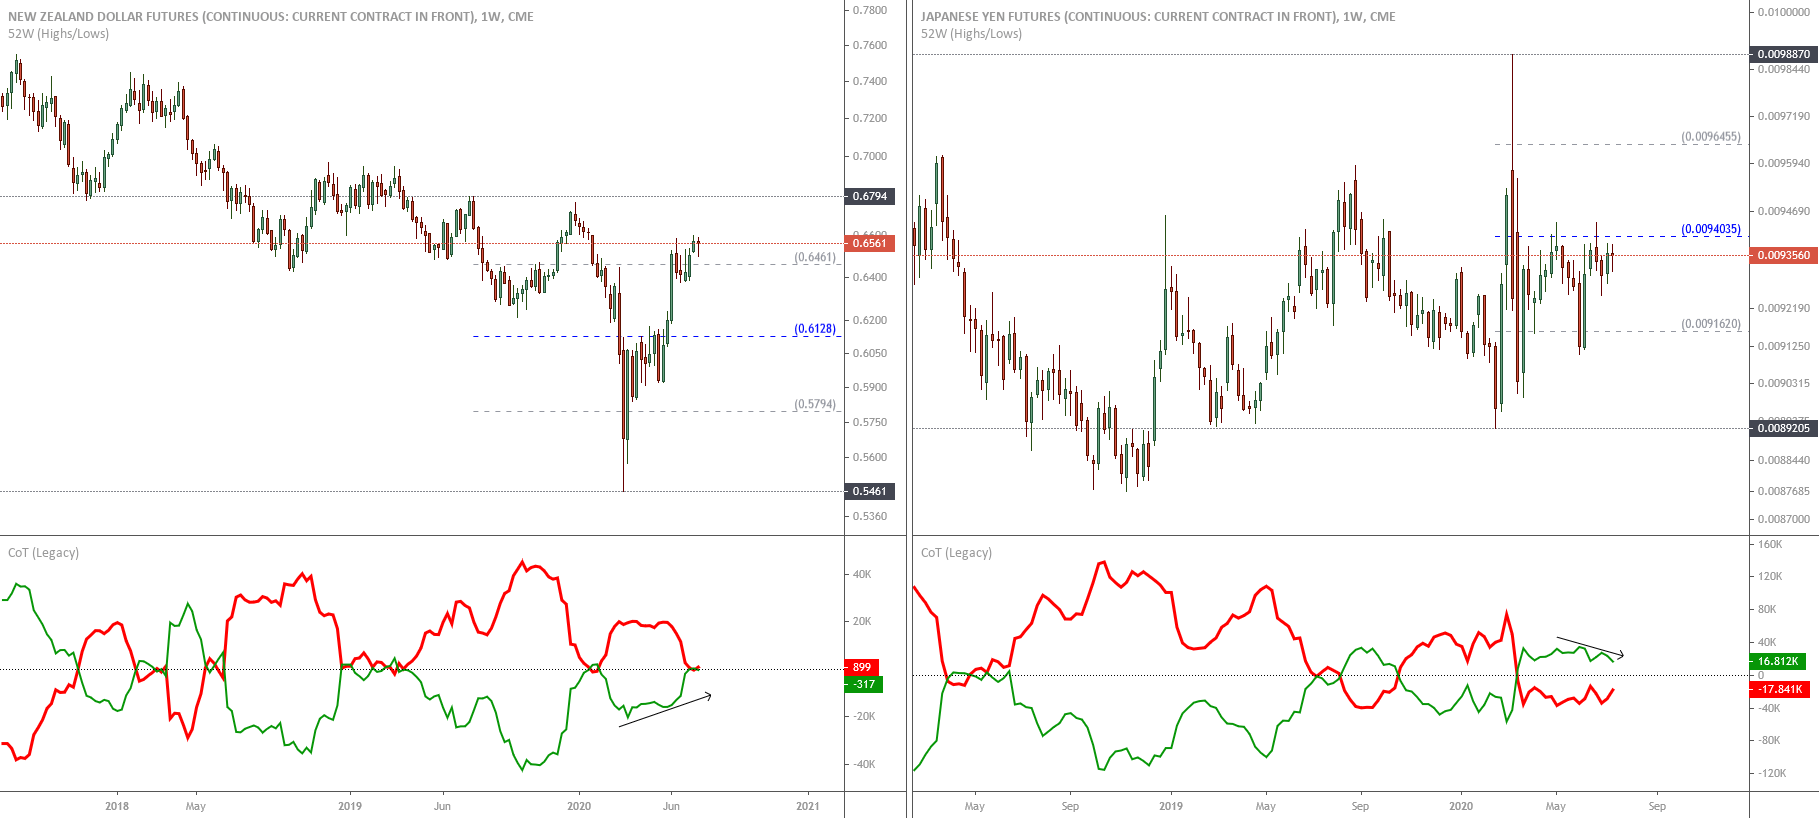
The long-term Elliott wave perspective of the NZDJPY cross illustrated in the following chart shows a bullish structural series in progress. The upward sequence began on March 18th when the cross found fresh buyers at 59.49, where the price action developed a V-turn bounce movement.
Once the NZDJPY cross started its bounce movement, the price began to develop an impulsive sequence subdivided into five internal segments of the Minuette degree identified in blue. According to the Elliott wave theory, the structural series drawn by the NZDJPY cross corresponds to a leading diagonal formation, which tends to appear in the first wave of an impulsive sequence or corrective structure. This pattern usually follows an internal structure subdivided into 3-3-3-3-3 or 5-3-5-3-5.
After the leading diagonal completion on April 30th, high at 66.103, when the cross ended its wave ((i)) of Minute degree identified in black, the price made a higher low at 63.46 on May 17th corresponding to its wave ((ii)). Once this second wave ended, the NZDJPY cross began to rally on the wave ((iii)), which remains incomplete.
Currently, the NZDJPY cross advances in its wave (iv) of Minuette degree in blue of the incomplete third wave of Minute degree.
Our outlook for the NZDJPY cross, based on the Elliott Wave perspective, anticipates a limited decline into five waves, which could complete the wave (iv) of the Minuette degree in blue. Once this sequence ends, the market action should find fresh buyers expecting to continue pushing the cross higher. This way, the NZDJPY cross should complete the wave ((iii)) of Minute degree.
Considering that the next movement will correspond to wave ((iv)) of Minute degree, we could expect the price moving mostly sideways before starts climbing on its fifth wave of Minute degree.
Finally, considering that the market sentiment reveals an increasing bullish momentum for the New Zealand Dollar, and the Japanese Yen exposes a neutral bias that seems to start turning bearish, long-term, NZDJPY could experience more rallies.
In consequence, our preferred positioning for the NZDJPY cross still remains on the bullish side. Any time the price drops could be an opportunity to join the long side.