
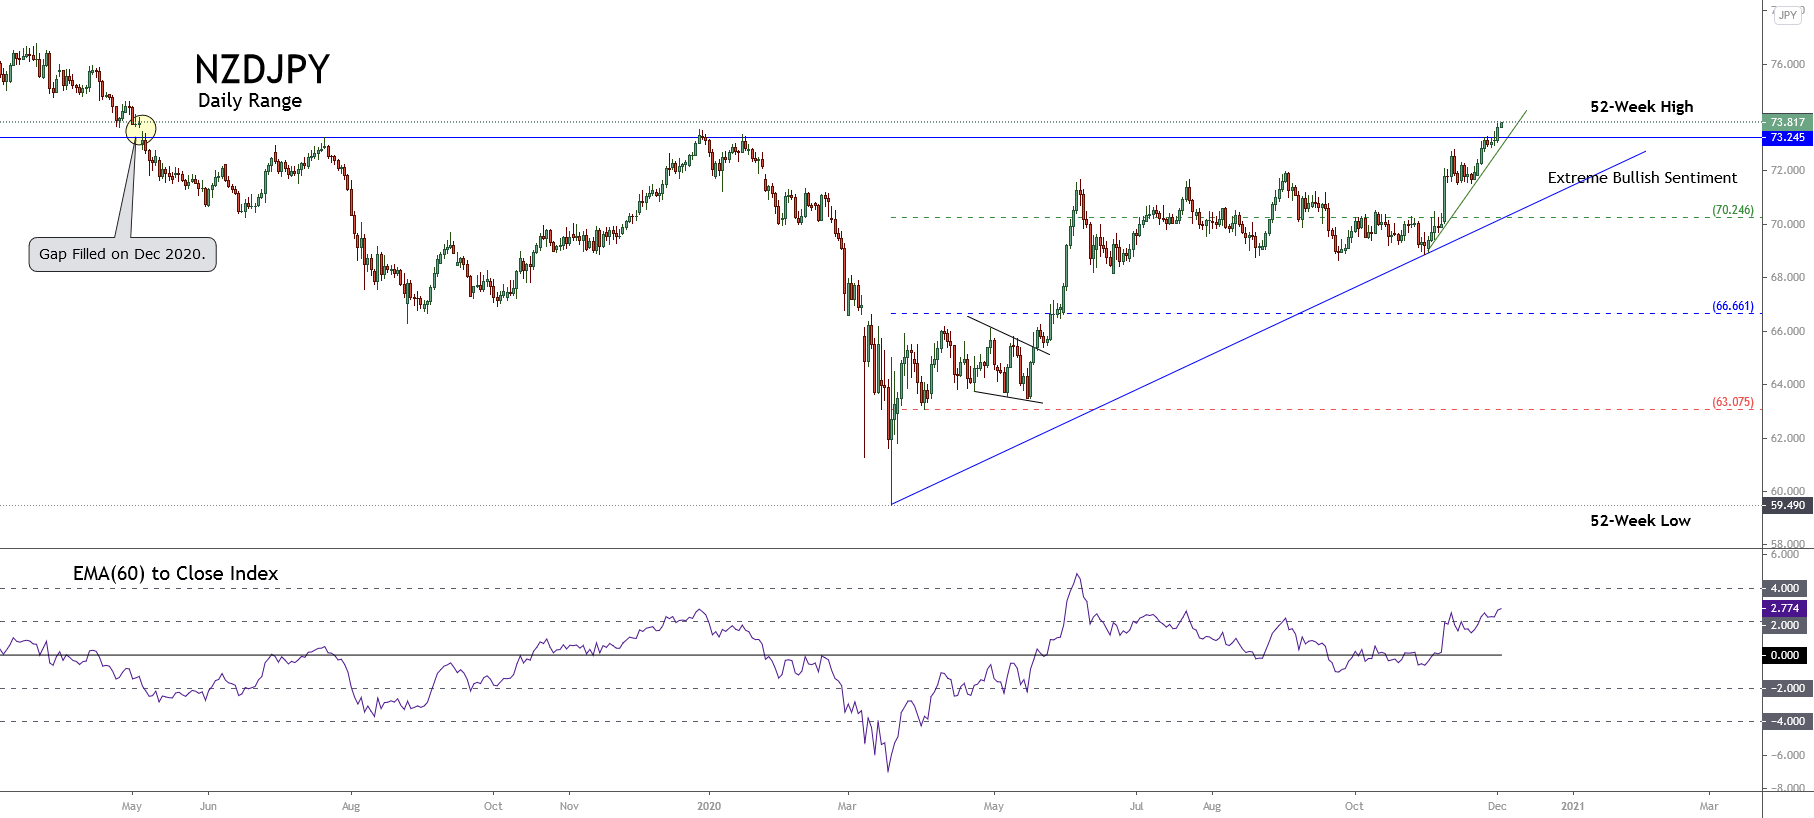
The NZDJPY advanced 5.70% in November, consolidating the price in the extreme bullish sentiment zone. Likewise, as illustrated in the following daily chart, during December’s kickoff trading, the cross reached the yearly high of 73.831, filling the gap that opened on May 06th, 2019.

Technical Overview
The previous chart also exposes the cross advancing in a mid-term uptrend drawn in blue, which remains active since last March 18th, when the price found support at 59.490. Likewise, we distinguish an accelerated short-term bullish trend plotted in green, which began in early November.
The 2.774 reading observed in the EMA(60) to Close Index leads us to suspect that the impulsive bull market developed in the NZDJPY cross seems to be in an exhaustion stage. Therefore, the cross is likely to develop a reversal movement in the following trading sessions.
Nevertheless, before taking a position on the bearish side, the price action must confirm the reversal movement.
Technical Outlook
The following 12-hour chart presents the mid-term Elliott Wave view or the NZDJPY cross. The drawings reveal the cross advancing in an incomplete fifth wave of Minuette degree, labeled in blue that belongs to the fifth wave of Minute degree, in black.
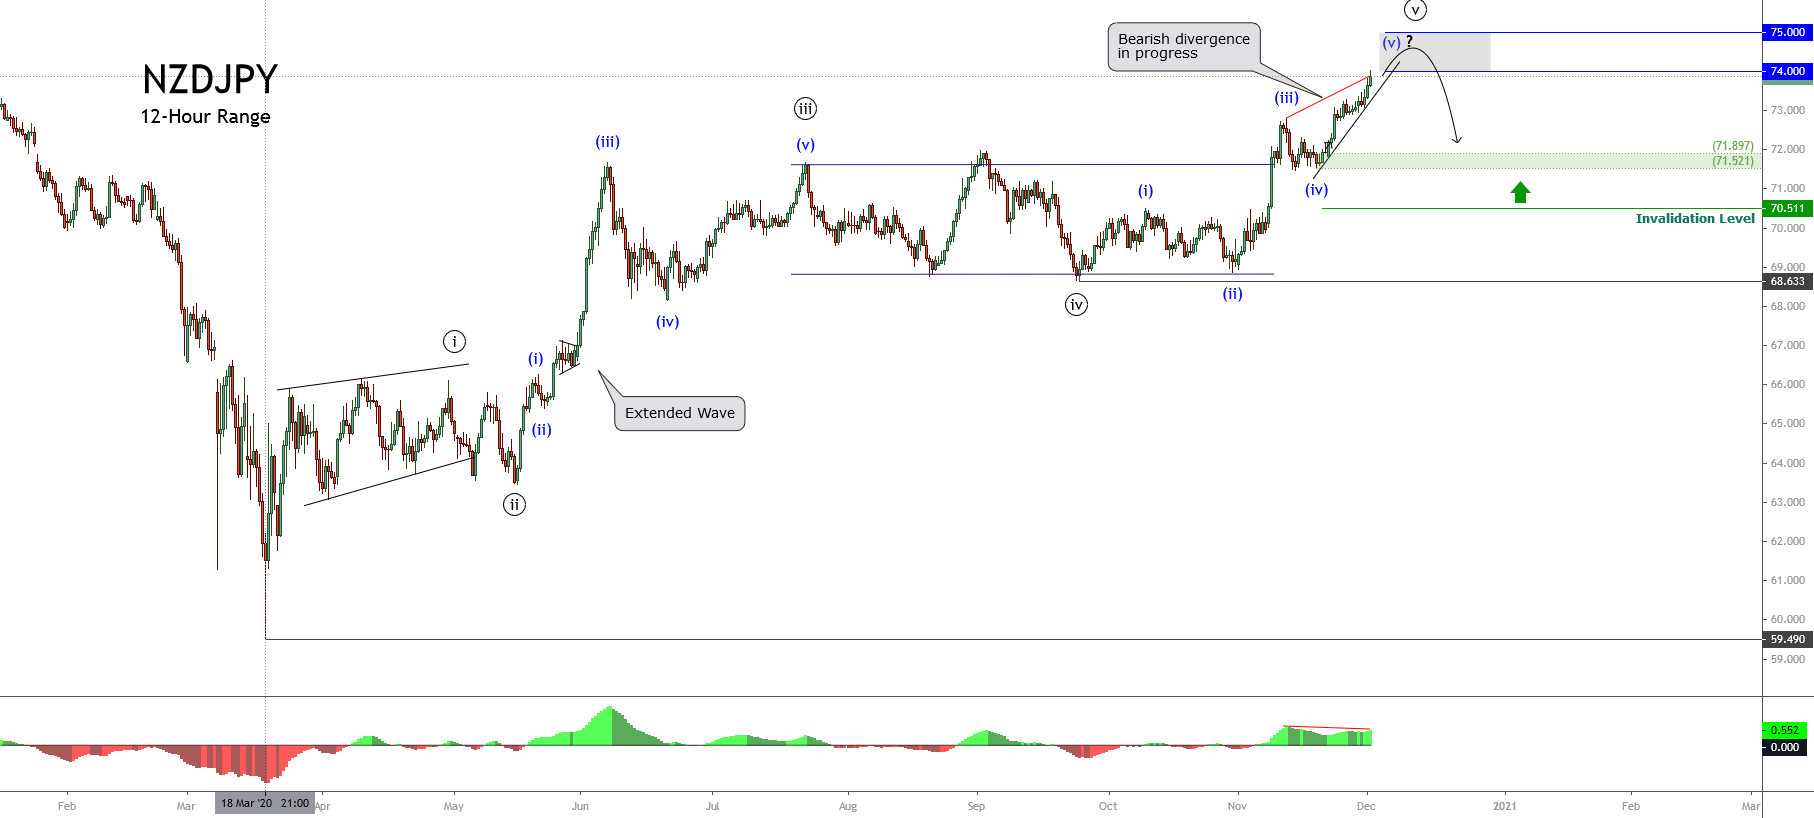
NZDJPY’s price movements reveal an impulsive five-wave sequence of Minute degree identified in black, which began last March 18th, when the cross found fresh sellers after the massive sell-off developed in the global stock market.
Likewise, once the extended third wave (in black) ended, the cross developed a sideways movement as a flat pattern, which found fresh buyers at 68.633. In this context, considering the Elliott Wave theory and that wave ((iii)) was the extended wave, the next impulsive wave ((v)) (in black) can’t be extended and should look similar to wave ((i)), also in black.
On the other hand, watching the fifth wave’s internal structure (in black), the wave (ii) (in blue) looks like a complex correction, and the third wave is the extended movement. In this context, the current wave (v) (in blue), which is still in development, shouldn’t be an extended rally.
Consequently, the cross could complete its fifth wave of Minute degree in the area defined by the psychological levels between 74.00 and 75.00. Finally, until the cross shows evidence of a reversal, such as a bearish engulfing candle, we should consider the cross’ trend as bullish.