
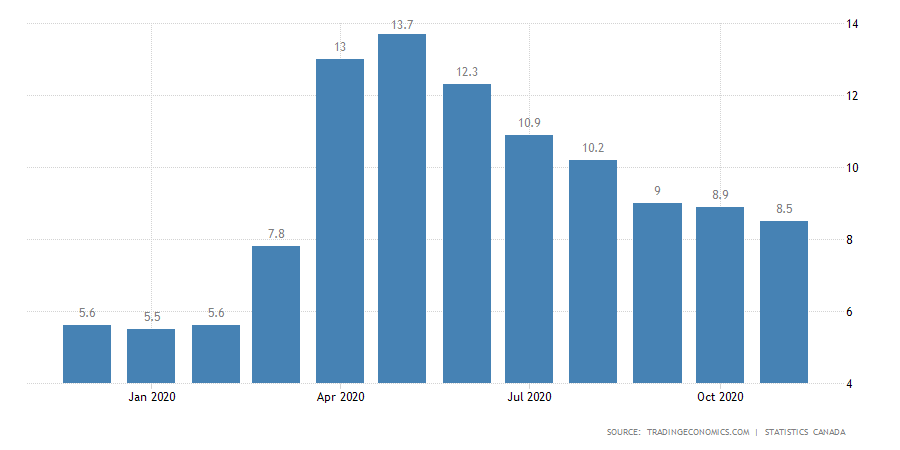
In the last trading week, the NZDCAD cross 90-Day market sentiment declined from the extreme bullish to the bullish sentiment zone. The move was helped by the Canadian unemployment rate figures, which declined to 8.5% in November, beating the analysts’ expectations of 8.9%.

 Source: TradingEconomics.com
The last unemployment rate reading represents an improvement in the Canadian labor market, which showed a slight decline to 8.9% in October. On the other hand, during the current year, the data gathered from Statistics Canada stated that the record unemployment high was Mays figure of 13.7%, its highest level in more than four decades.
Technical Overview
The following 8-hour chart illustrates the market participants’ sentiment unfolded in the 90-day high and low range, revealing an aggressive decline in the Friday 04th trading session where the cross dropped over 1.7%.
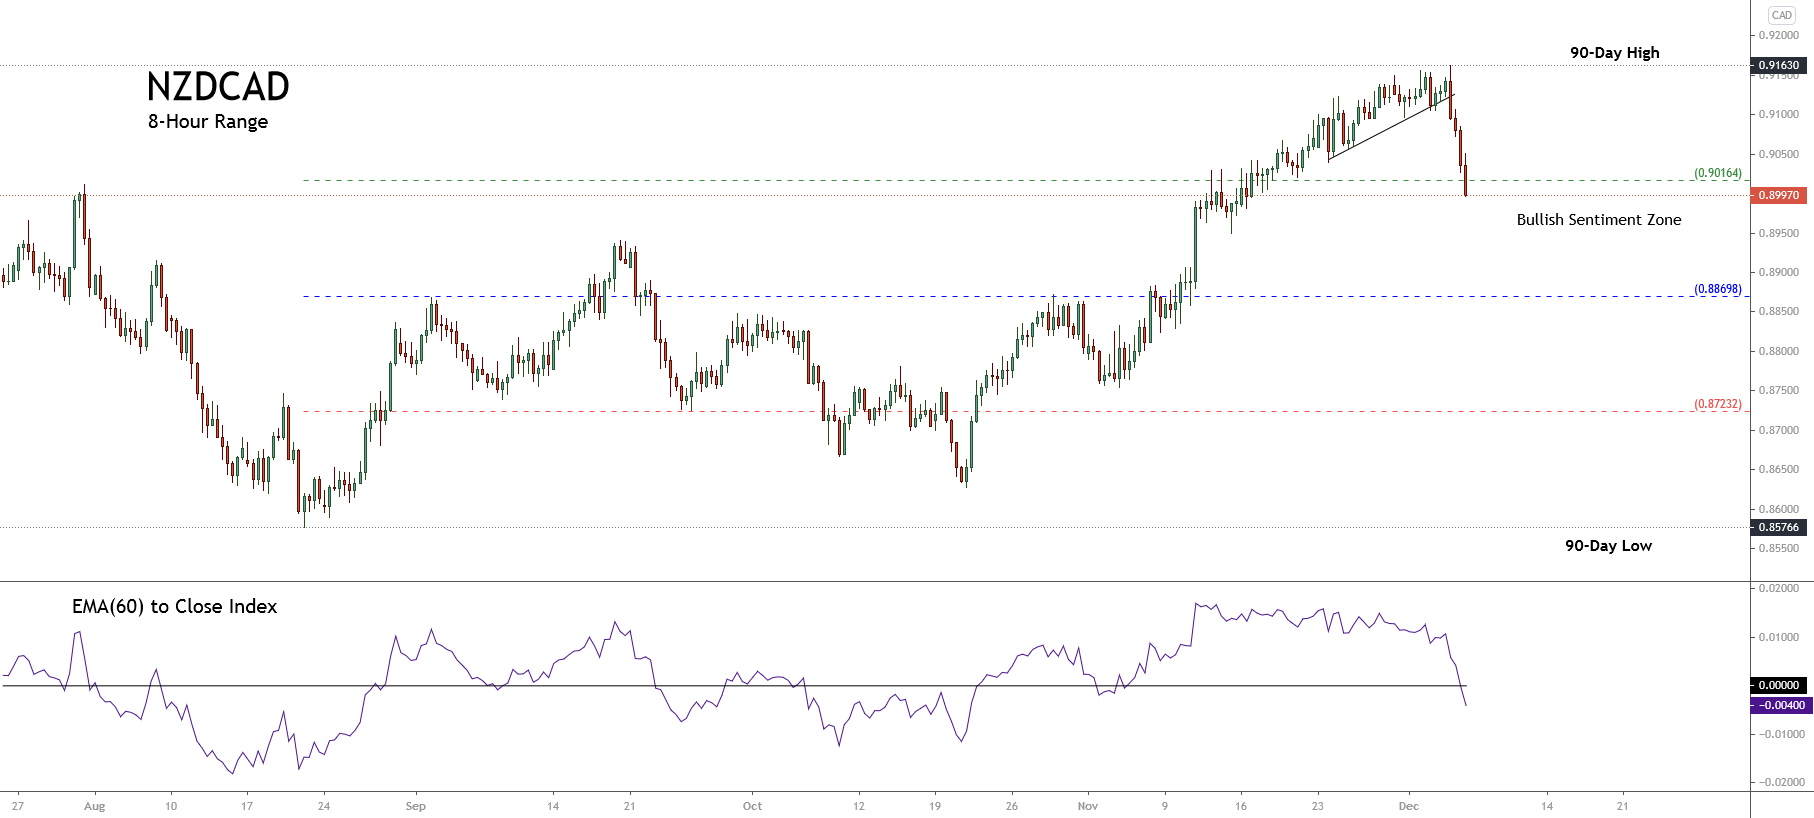
In this context, the downgrade on the market sentiment leads us to expect a corrective movement. This potential drop could find support in the neutral zone of 0.88698. Likewise, the descending of the NZDCAD EMA(60) to Close index below the zero-line drives us to anticipate a consolidation during the coming trading sessions before continuing a further decline.
Technical Outlook
The NZDCAD cross in its 8-hourly chart illustrates the mid-term uptrend that began on March 18th once the price confirmed its bottom of 0.80849. The primary trend plotted in blue reveals that the bull market remains intact.
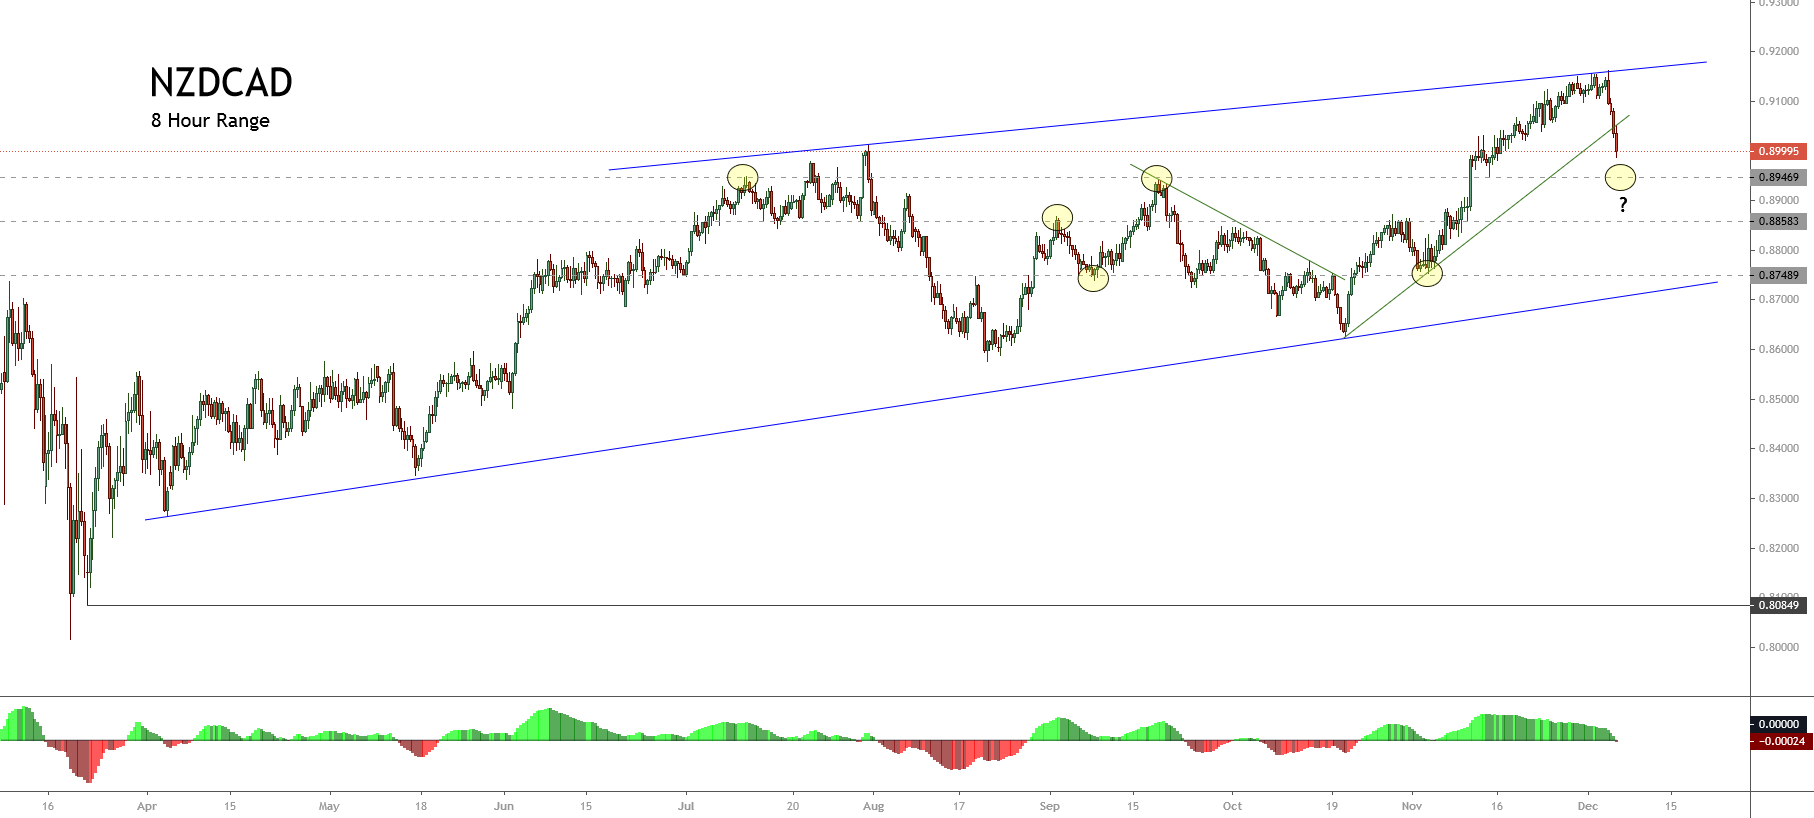
Likewise, the breakdown observed in the last ascending secondary trend identified in green reveals a short-term correction with three potential key support levels: 0.89469, 0.88583, and 0.87489. Each of these levels shows a zone where the price action developed a polarization movement.
The following 2-hour chart shows an impulsive movement, which began on October 20th when the price found support at 0.86270. After completing its third wave of Minuette degree, in blue, the NZDCAD cross found resistance on December 03rd at 0.91630, where it started a decline in an incomplete corrective sequence that could correspond to wave (iv), in blue.

In this context, the cross could develop two potential scenarios:
- The first scenario occurs if the price completes the third wave on 0.91630. In this case, the cross could advance mostly sideways in its wave (iv), in blue. In this scenario, the cross could find support in the demand zone between 0.89723 and 0.89490, where the price could begin to advance in its wave (v) of Minuette degree at least to the 0.9163 level.
- The second scenario: considers an alternative count and occurs if the NZDCAD cross completes a wave (v), in blue, on 0.91630. If that is the case, it implies the price is currently advancing in a corrective formation of Minuette degree. Thus, the price could create a decline in a three-wave sequence toward the next demand zone between 0.88437 until 0.88234.
In both scenarios, the invalidation level is found below the origin of wave (i) at 0.86270.