The EURUSD pair advances in the extreme bullish sentiment range, consolidating the short-term rally that started on November 04th when the price found fresh buyers at 1.15615.
Technical Overview
The following 8-hour chart shows the short-term participants’ sentiment keeps pushing higher the price action. In this view, the common currency looks to consolidate the pair’s impulsive movement that began in early November.
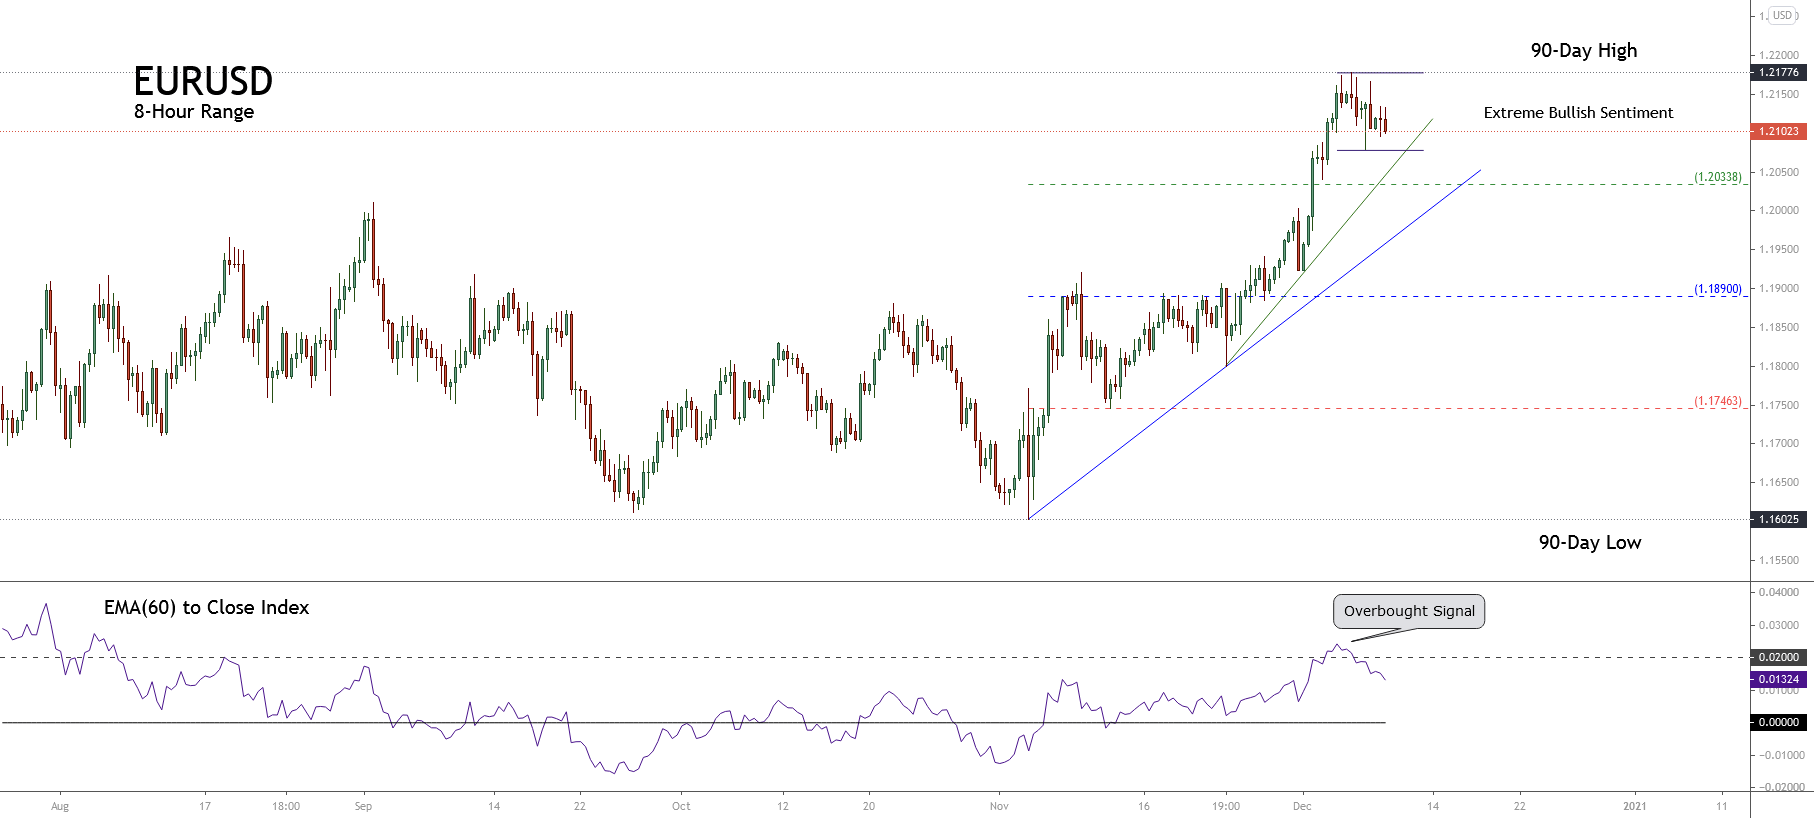
In this chart, we can see that the current primary trend is clearly bullish. Simultaneously, the accelerated trendline identified with the green line shows the short-term bull market remains intact.
On the other hand, both the intraday sideways channel and the retracement observed in the EMA(60) to Close Index lead to a consolidation of the rally experienced by the common currency during the previous trading sessions.
Therefore, if the price action penetrates below 1.20338, the likelihood of a reversal movement in the EURUSD increases.
Short-term Technical Outlook
The short-term Elliott Wave view for the EURUSD pair unfolded in the next 4-hour chart reveals the advance in an incomplete bullish impulsive wave of Minor degree identified in green.
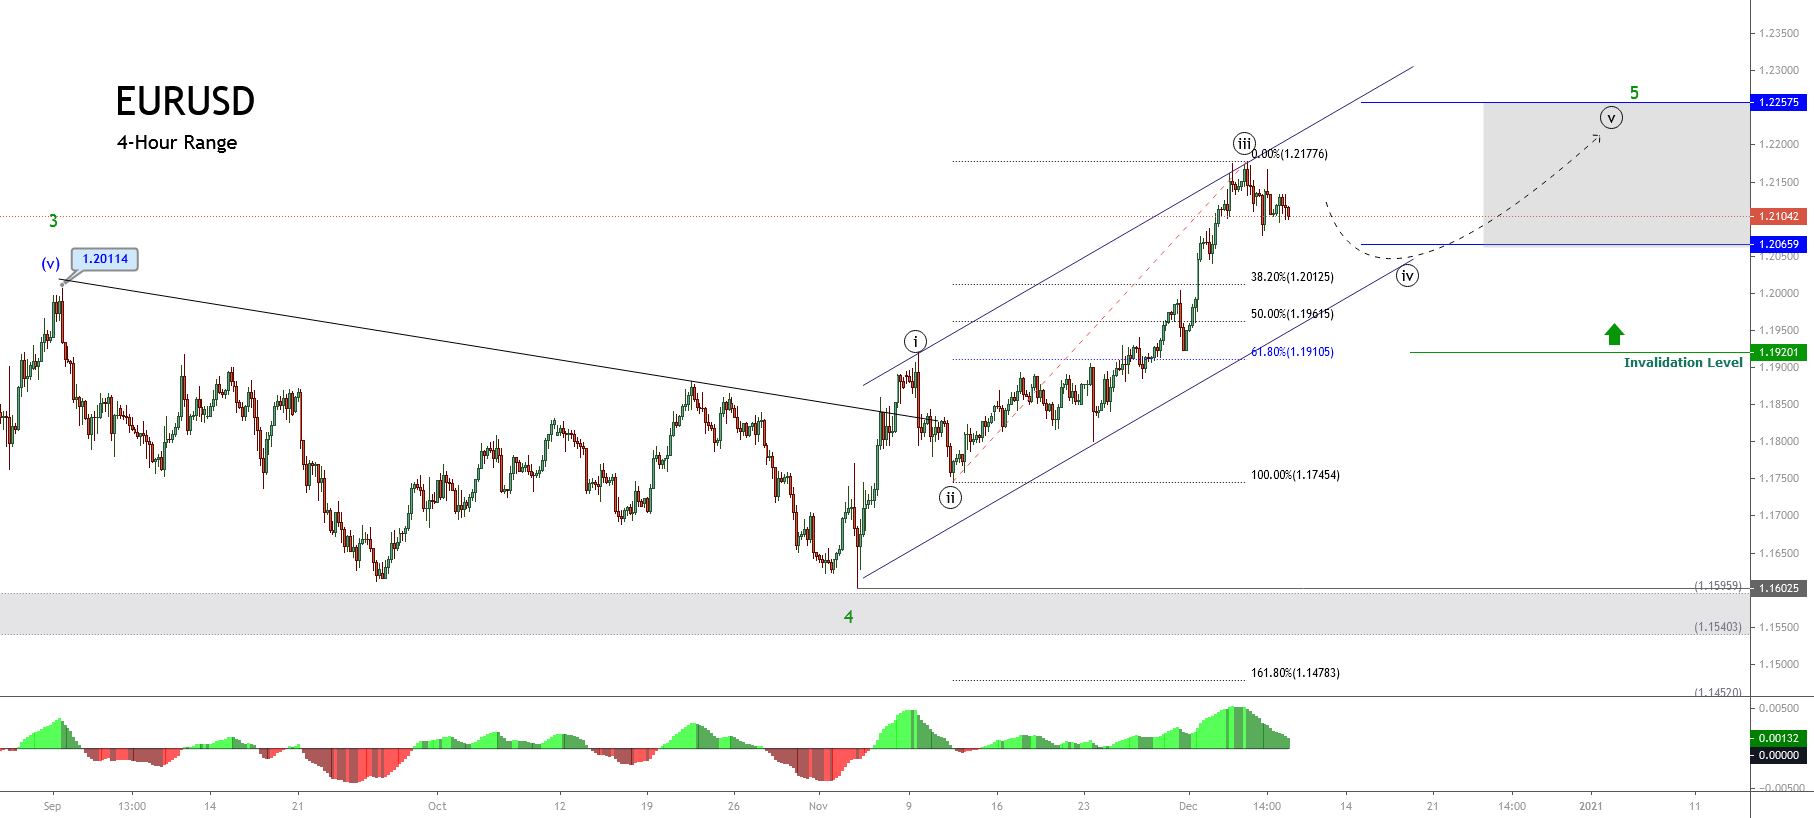
The EURUSD 4-hour chart illustrates the impulsive rally that began on November 04th when the price found fresh buyers at 1.16025. The price action currently looks to have completed its third wave of Minute degree labeled in black, confirmed by the broadest distance shown on the MACD oscillator.
On the other hand, the consolidation structure in progress reveals the potential sideways advance of its fourth wave. Considering the Elliott Wave Principle, the fourth wave shouldn’t penetrate below the invalidation level located at 1.19201, which corresponds to the end of wave ((i)) in black.
Also, considering both the second wave, which looks like a simple corrective pattern, and the alternation principle on corrective waves, the fourth wave should be a complex correction. In this context, the fourth wave could be a triangle or a combination of simple waves grouped in a double-three or a triple-three formation.
Finally, the extension in terms of time should indicate the exhaustion of the bullish pressure; thus, the common currency could soon end its bullish cycle.