The GBPAUD cross continues consolidating in what is a corrective formation that continues in development since October 22nd when the price found fresh sellers on 1.85272. In this context, the current consolidation pattern suggests a coming rally in the following trading weeks.
Technical Overview
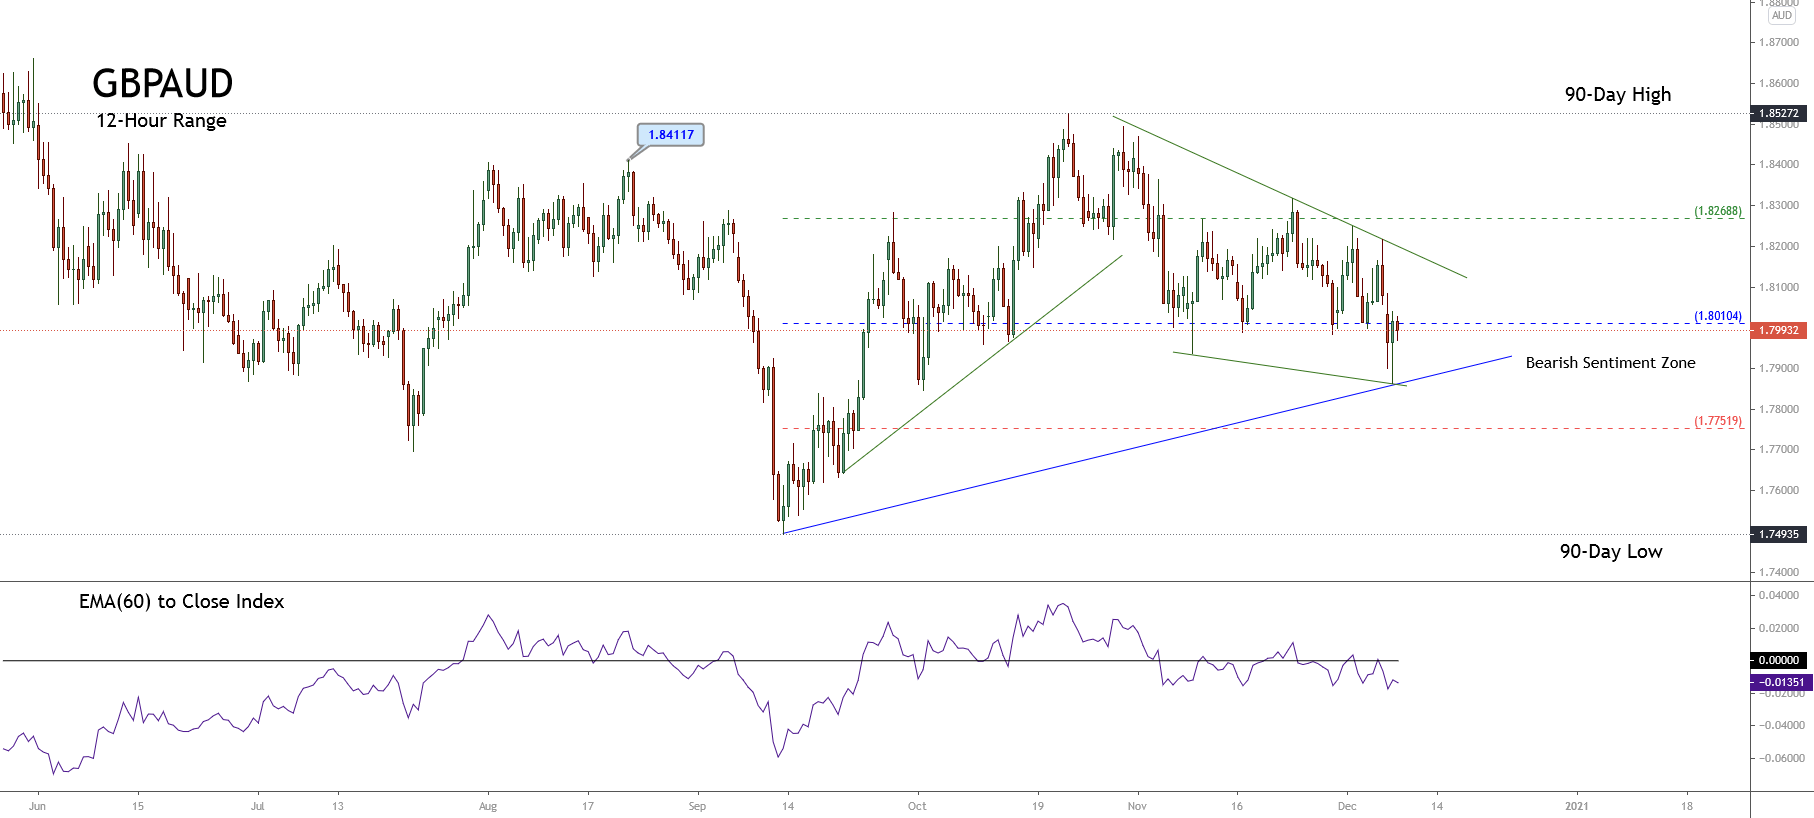
The next 12-hour chart illustrates the short-term market participants’ sentiment displaying the 90-day high and low range, which bounced in the bearish sentiment zone finding resistance in the neutral level of 1.80104, where the cross is still moving in the current trading session. However, as long as the GBPAUD cross doesn’t surpass and closes above the level of 1.80104, the bias will stay mostly bearish.
The primary trend identified in blue shows that the current uptrend remains in its formation process. In this context, the corrective movement in progress represents a secondary trend from the last upward move that carried the cross from 1.74935 to 1.85272.
Short-term Technical Outlook
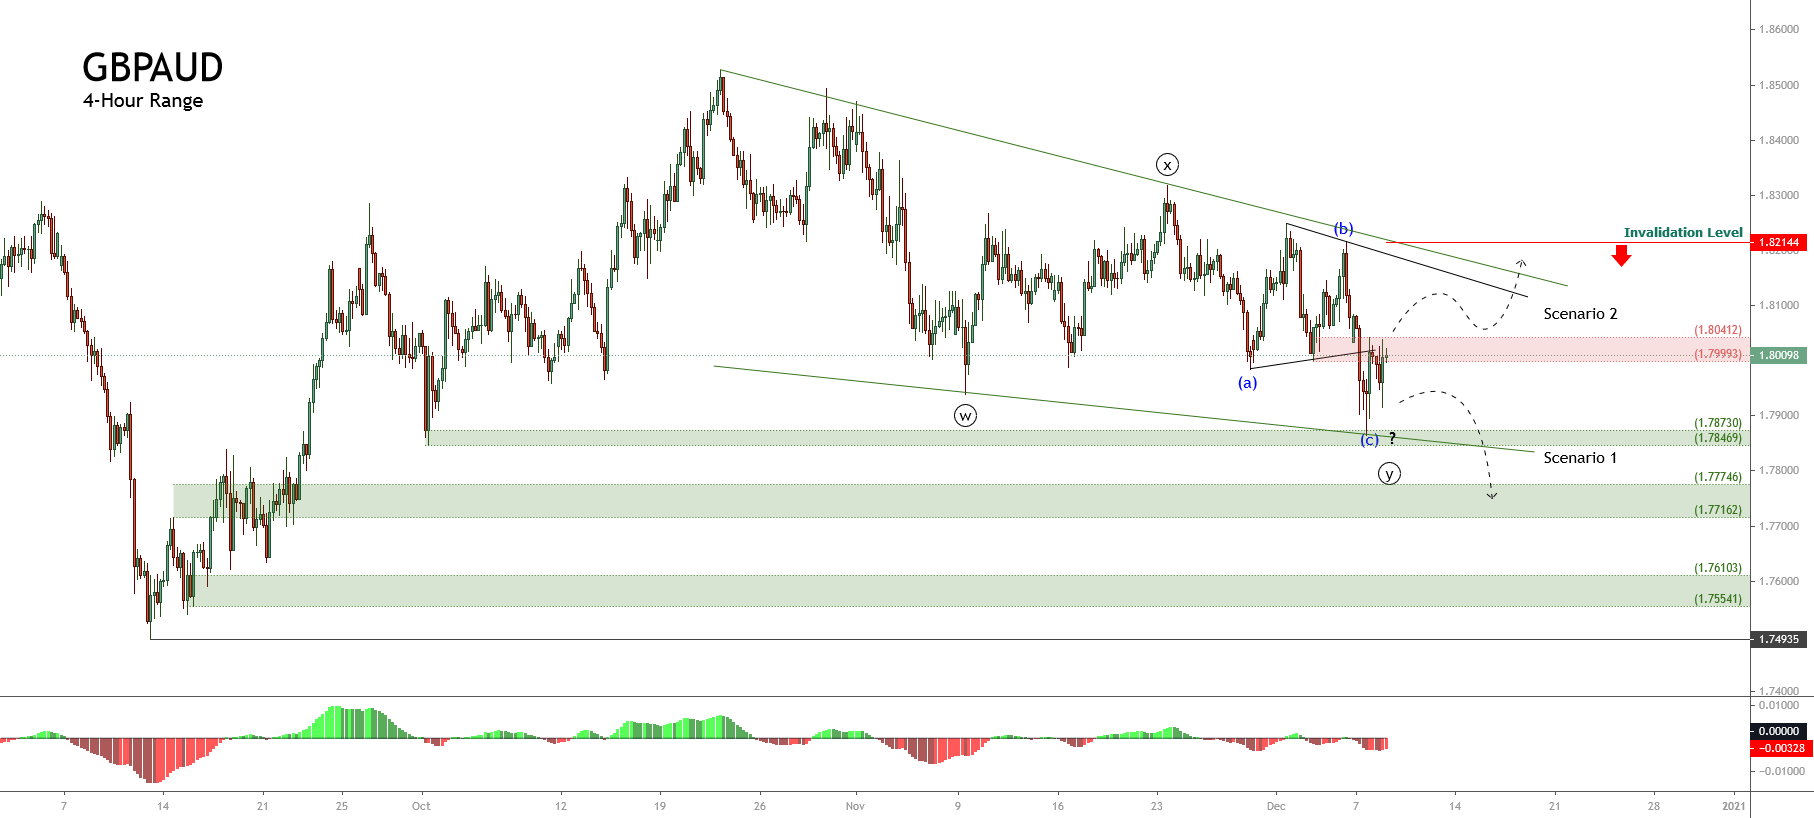
The short-term Elliott wave view for the GBPAUD cross shown in the following 4-hour chart reveals the downward advance in an incomplete double-three pattern of Minute degree labeled in black, which suggests further declines for the following trading sessions.
The previous chart shows the GBPAUD developing a double three pattern. According to the textbook, this complex corrective formation follows an internal sequence subdivided into 3-3-3, where each three corresponds to a basic corrective structure.
Currently, the cross looks advancing in its wave (c) of Minuette degree labeled in blue, which belongs to the wave ((y)) of Minute degree identified in black. The movement developed until now fits two potential scenarios:
- The first scenario considers the pause in the wave (c), which could see further declines to the demand zone between 1.7774 and 1.7716. The cross could even extend its drops until 1.7610 and 1.7554, where the price could find fresh buyers expecting a boost in its price to new highs.
- The second occurs if the price ends its wave (c) in blue and rally toward fresh highs. In this context, the cross should confirm the breakout of the supply zone resistance at 1.8041. Also, the cross must break up the ((x))-(b) trend-line.
Finally, the invalidation level for this bearish sequence in progress can be found at the end of wave (b) in blue at 1.82144.


