Categories
Forex Elliott Wave Forex Market Analysis

GBPAUD Consolidates in an Incomplete Correction

The GBPAUD cross continues consolidating in what is a corrective formation that continues in development since October 22nd when the price found fresh sellers on 1.85272. In this context, the current consolidation pattern suggests a coming rally in the following trading weeks.

Technical Overview

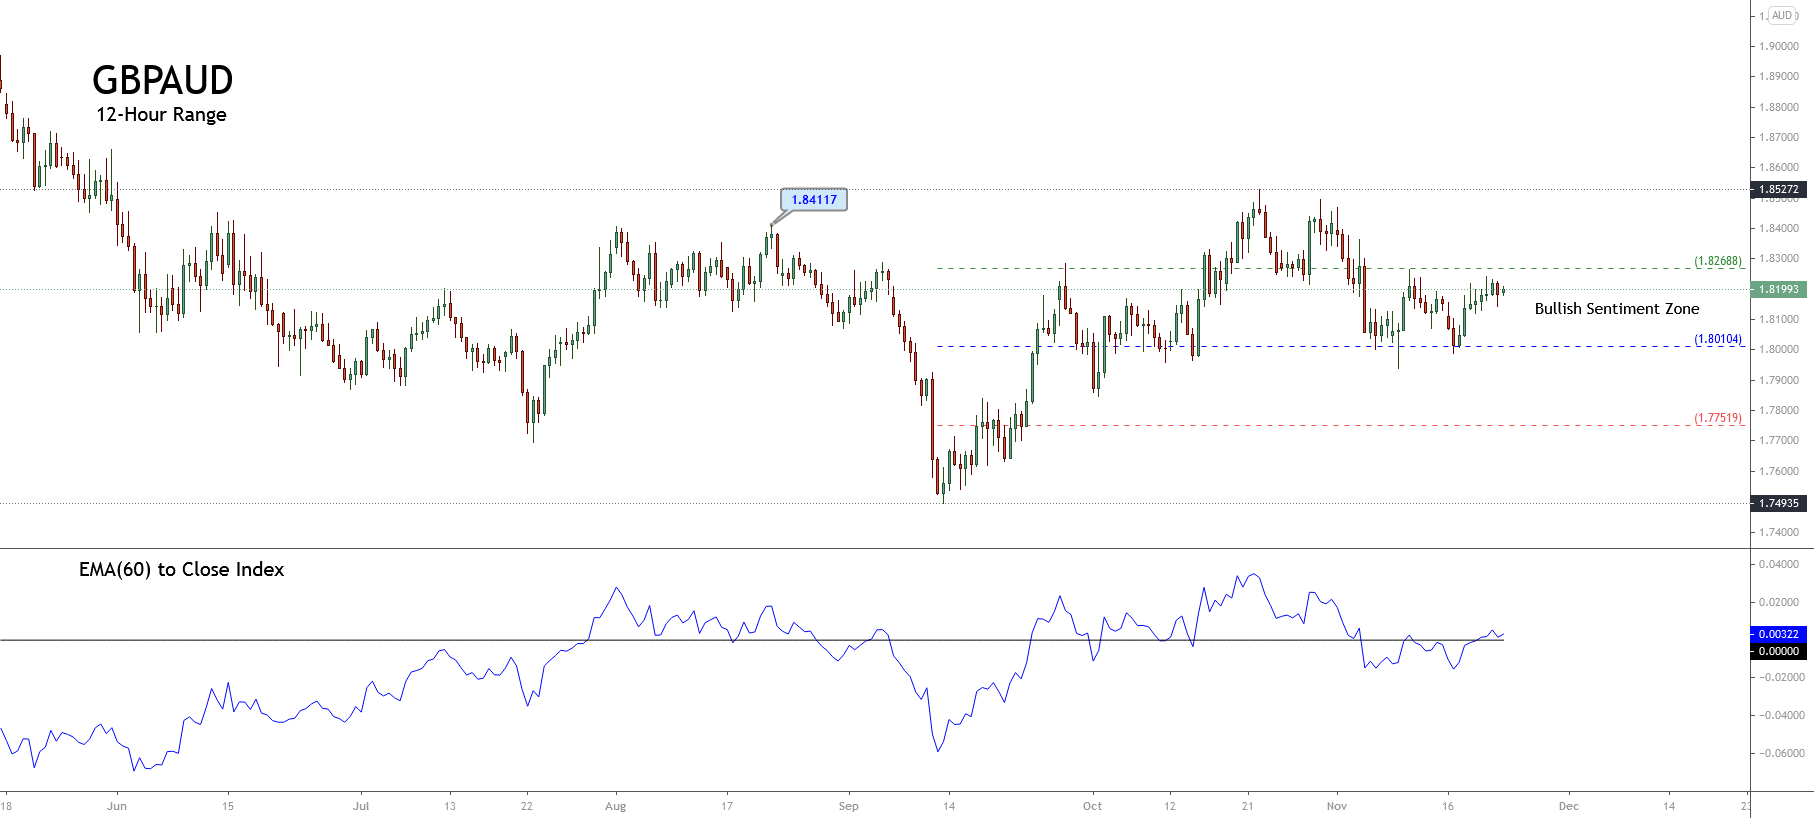
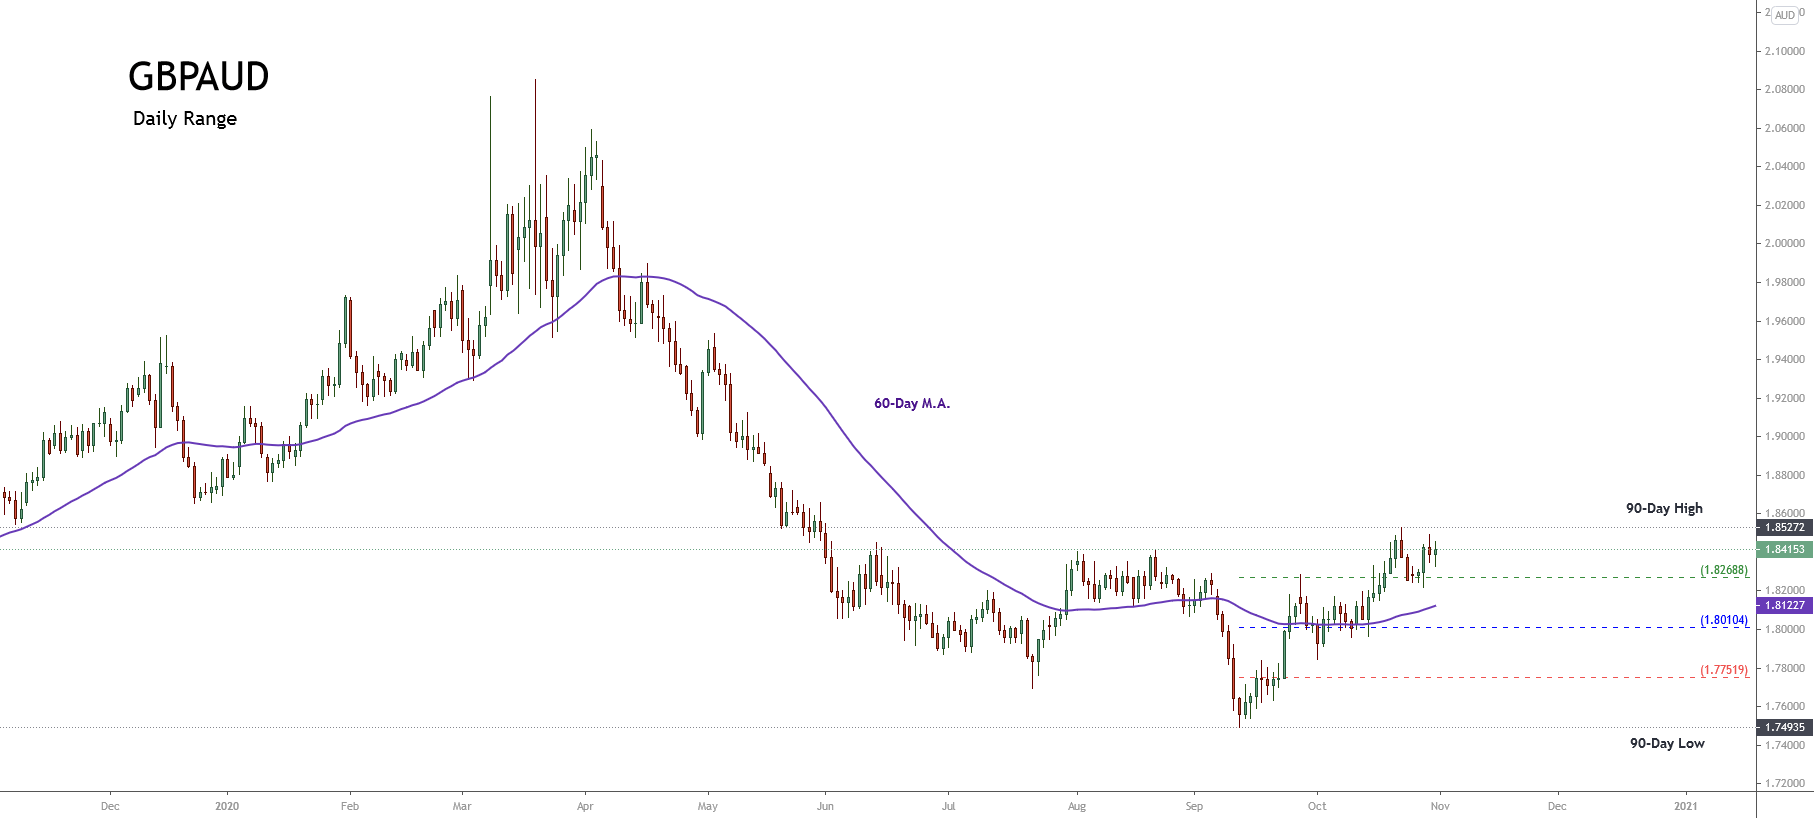
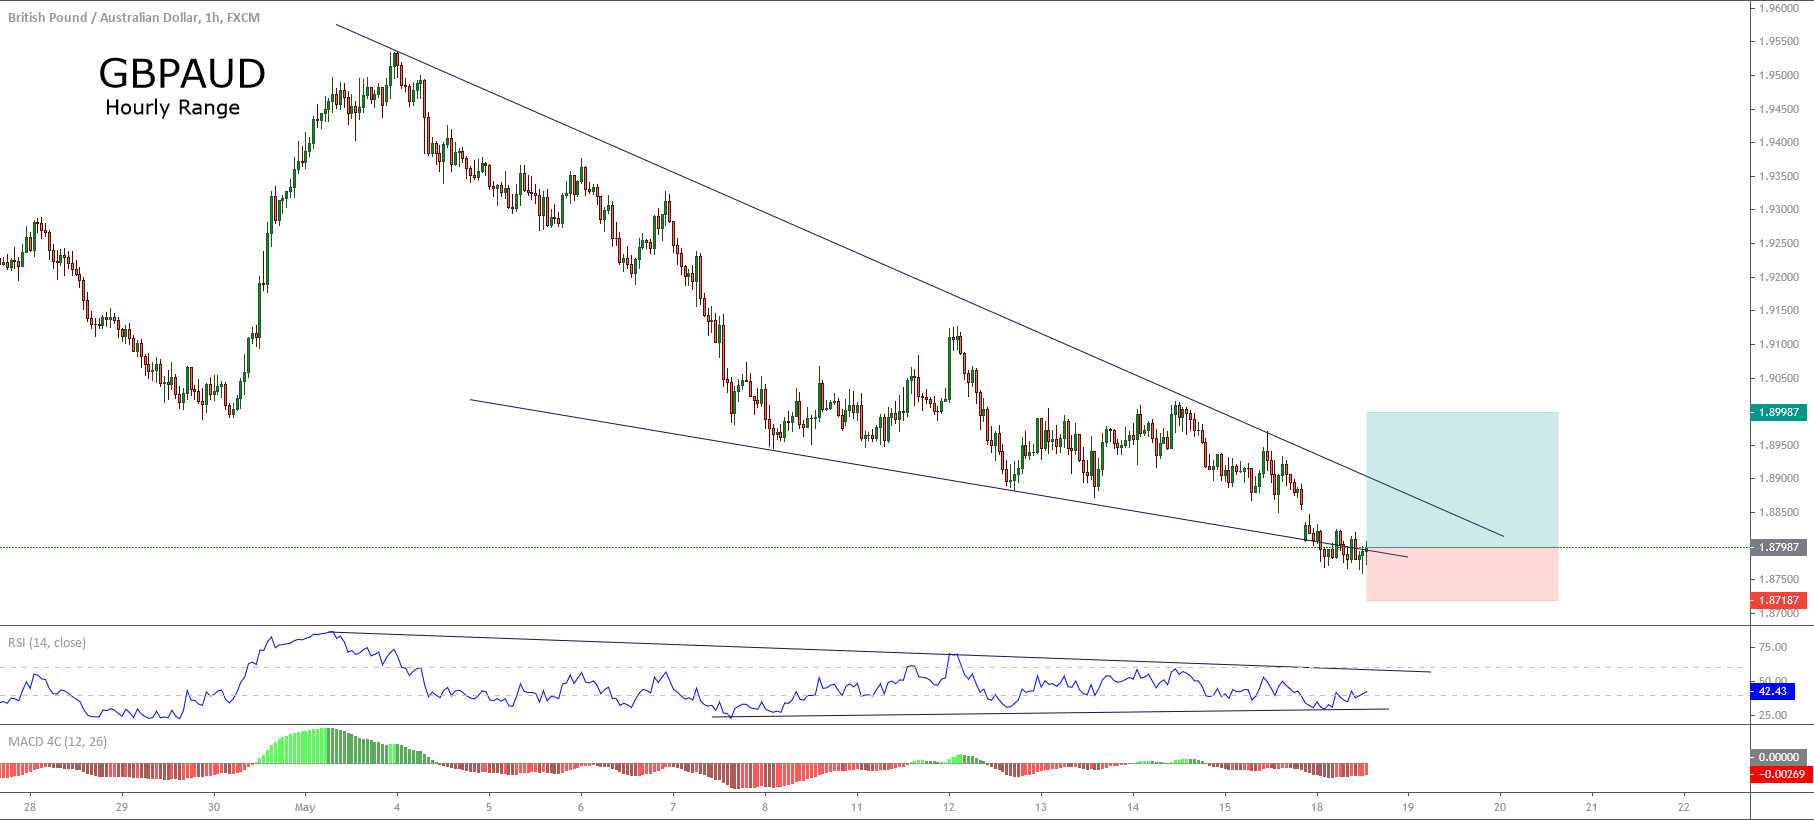
The next 12-hour chart illustrates the short-term market participants’ sentiment displaying the 90-day high and low range, which bounced in the bearish sentiment zone finding resistance in the neutral level of 1.80104, where the cross is still moving in the current trading session. However, as long as the GBPAUD cross doesn’t surpass and closes above the level of 1.80104, the bias will stay mostly bearish.

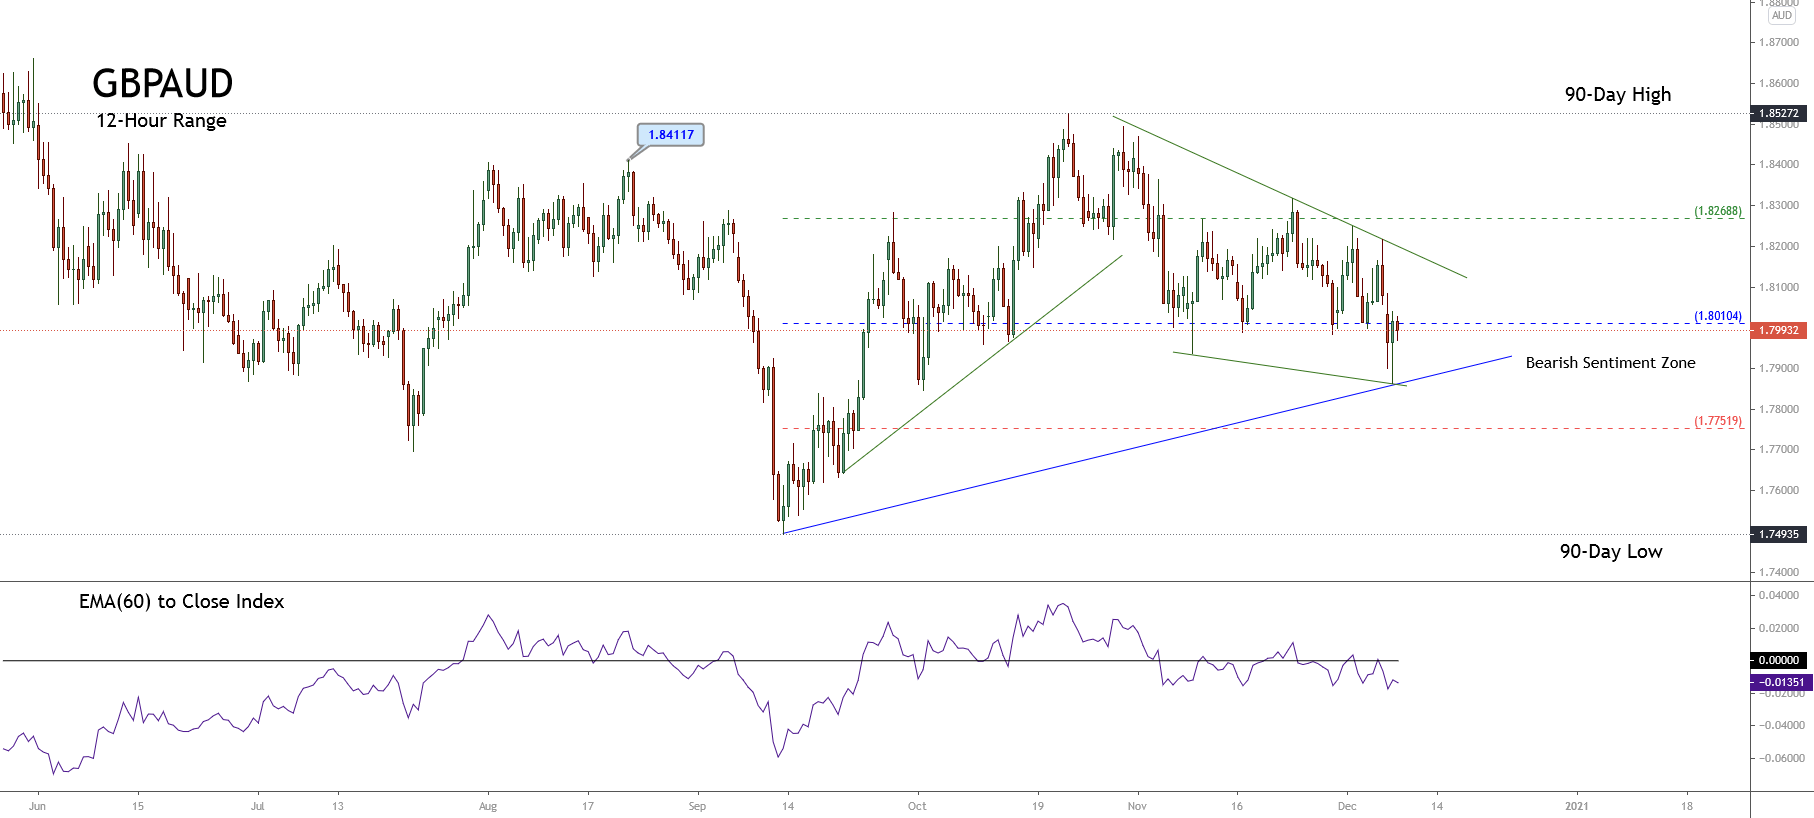
The primary trend identified in blue shows that the current uptrend remains in its formation process. In this context, the corrective movement in progress represents a secondary trend from the last upward move that carried the cross from 1.74935 to 1.85272.

Short-term Technical Outlook

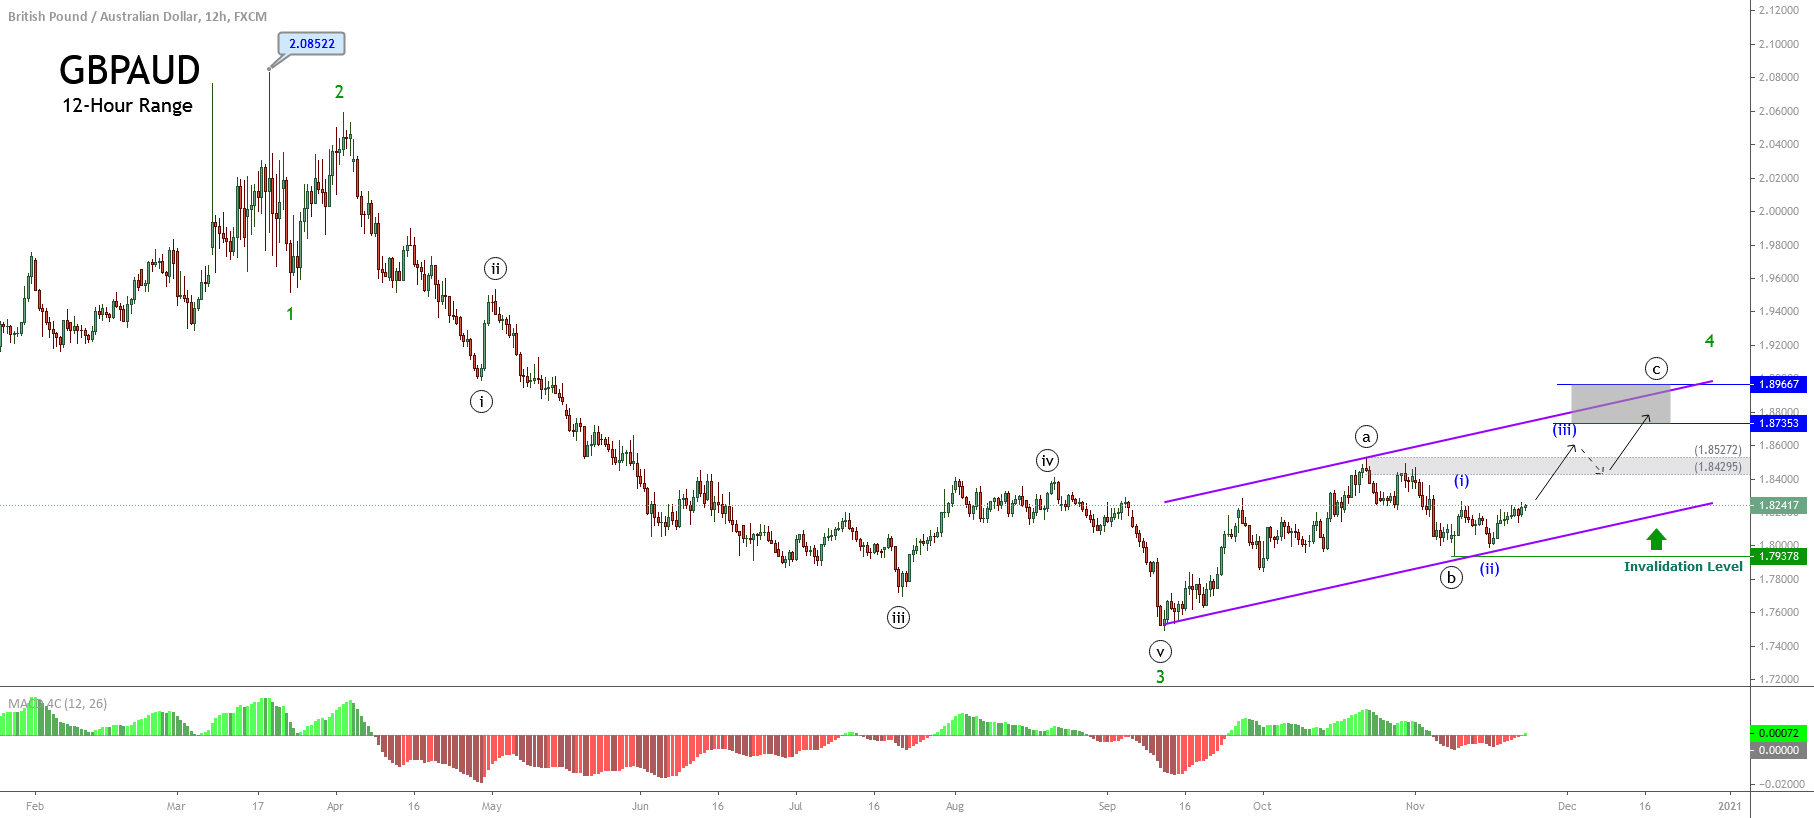
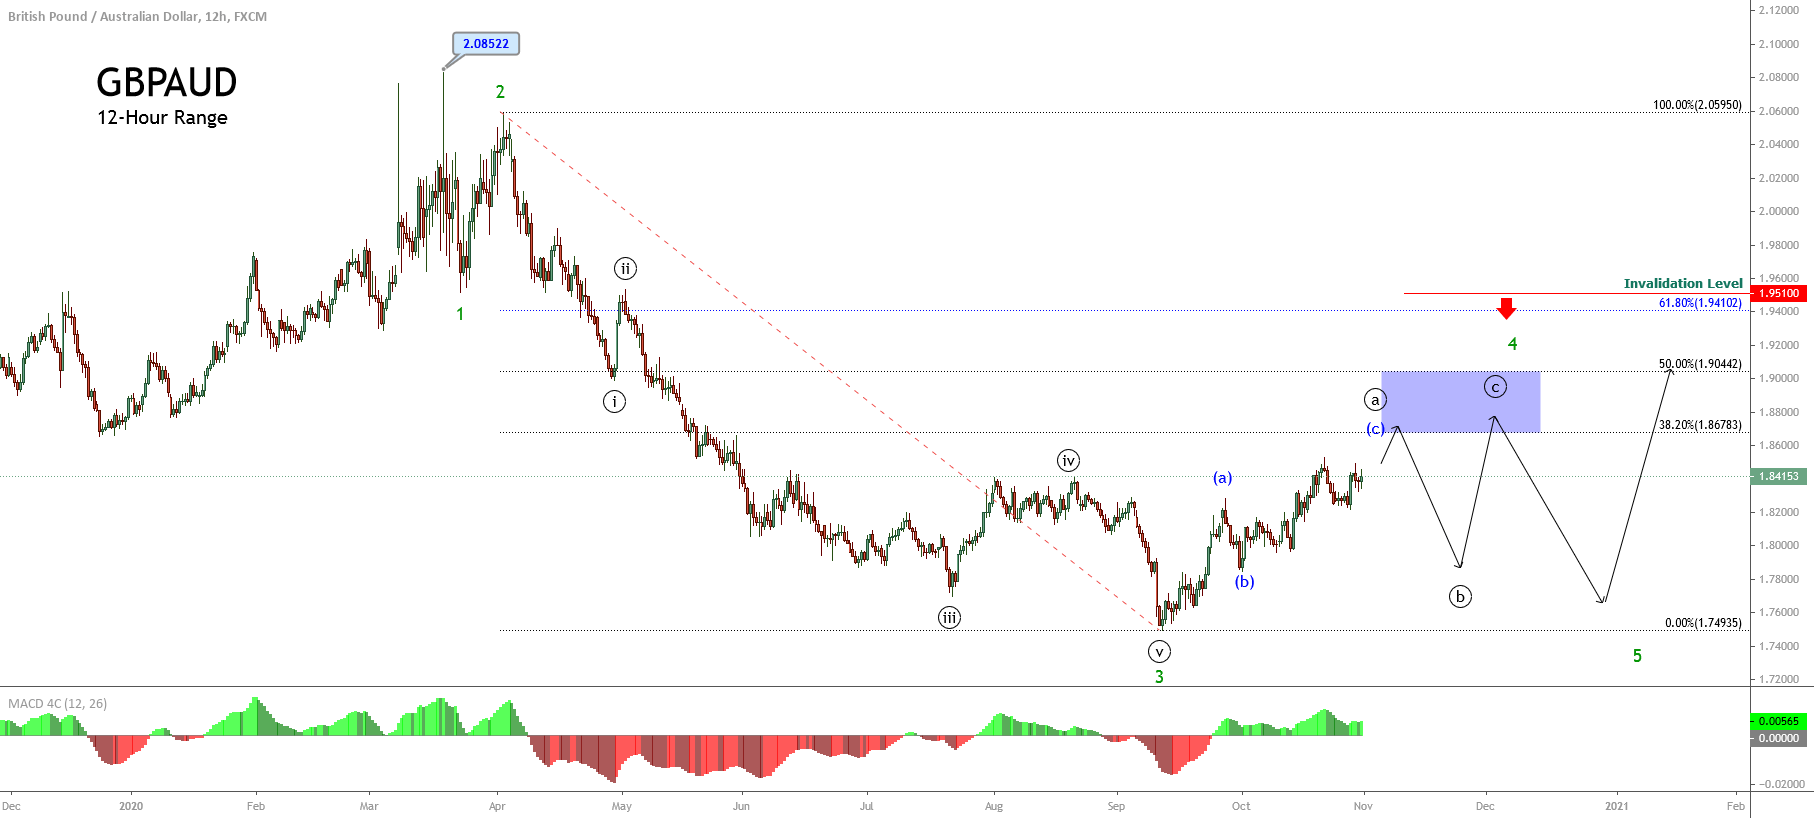
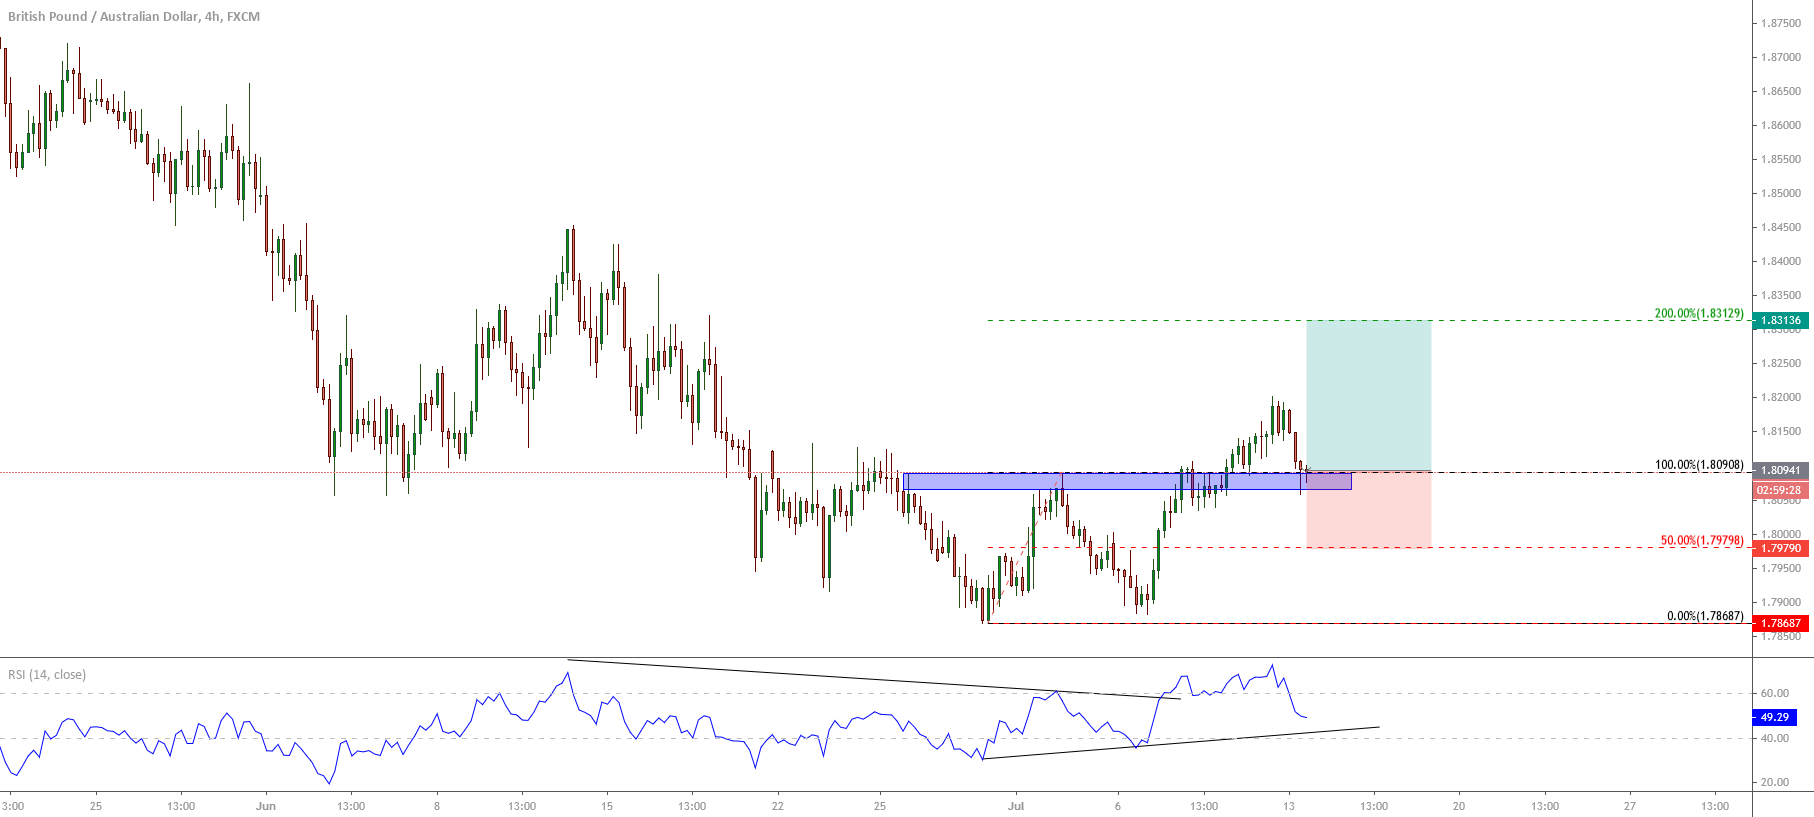
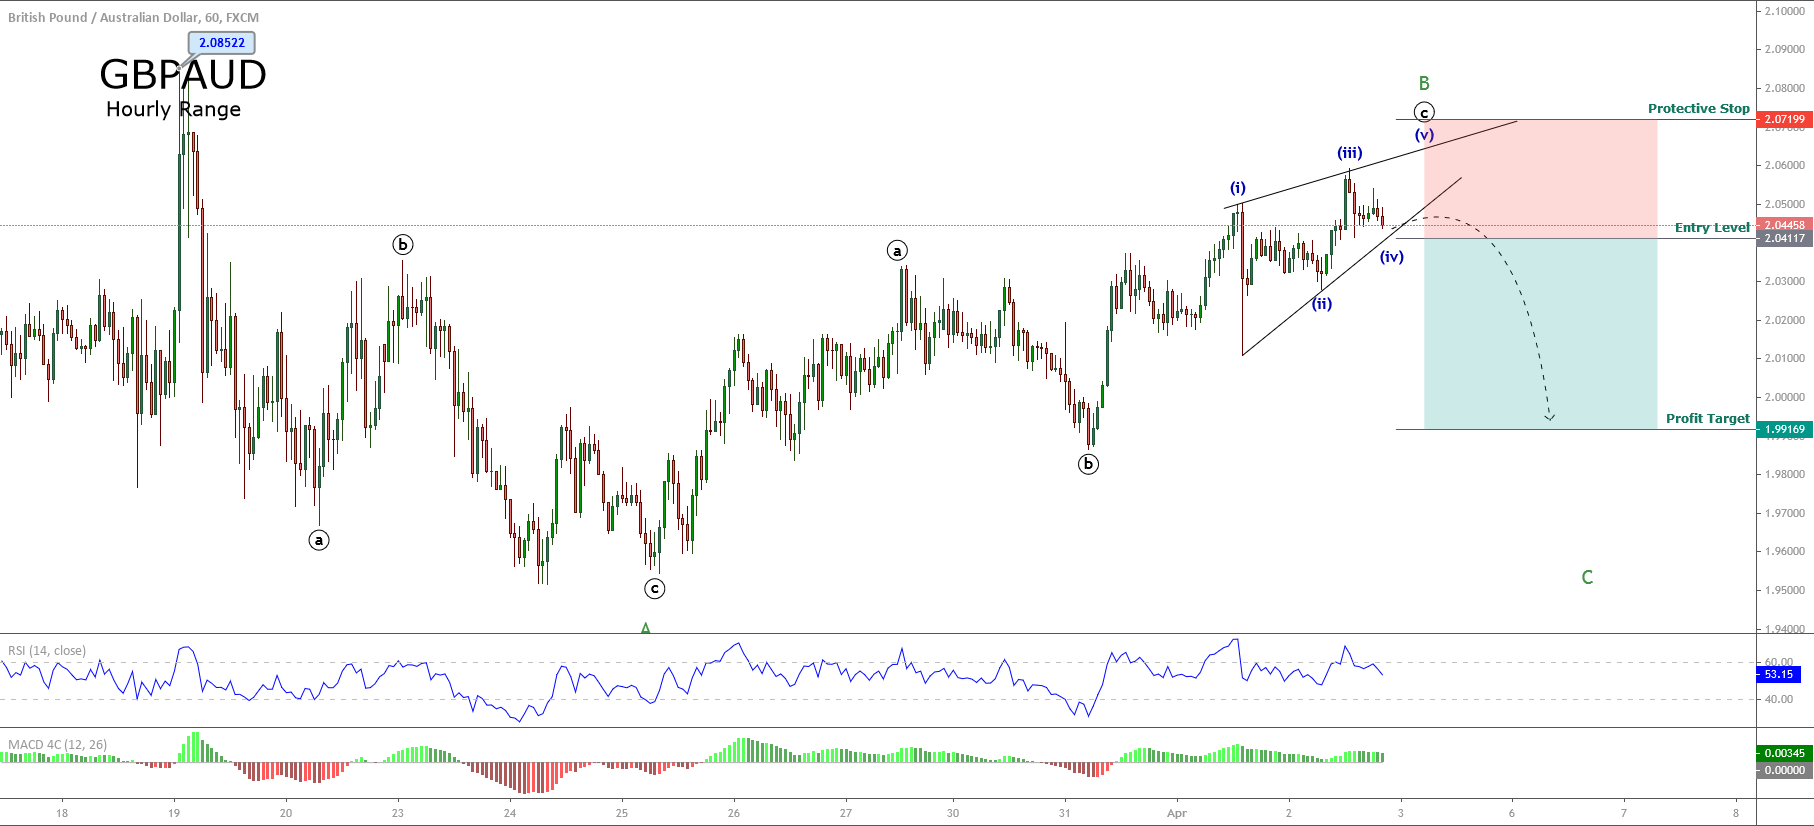
The short-term Elliott wave view for the GBPAUD cross shown in the following 4-hour chart reveals the downward advance in an incomplete double-three pattern of Minute degree labeled in black, which suggests further declines for the following trading sessions.

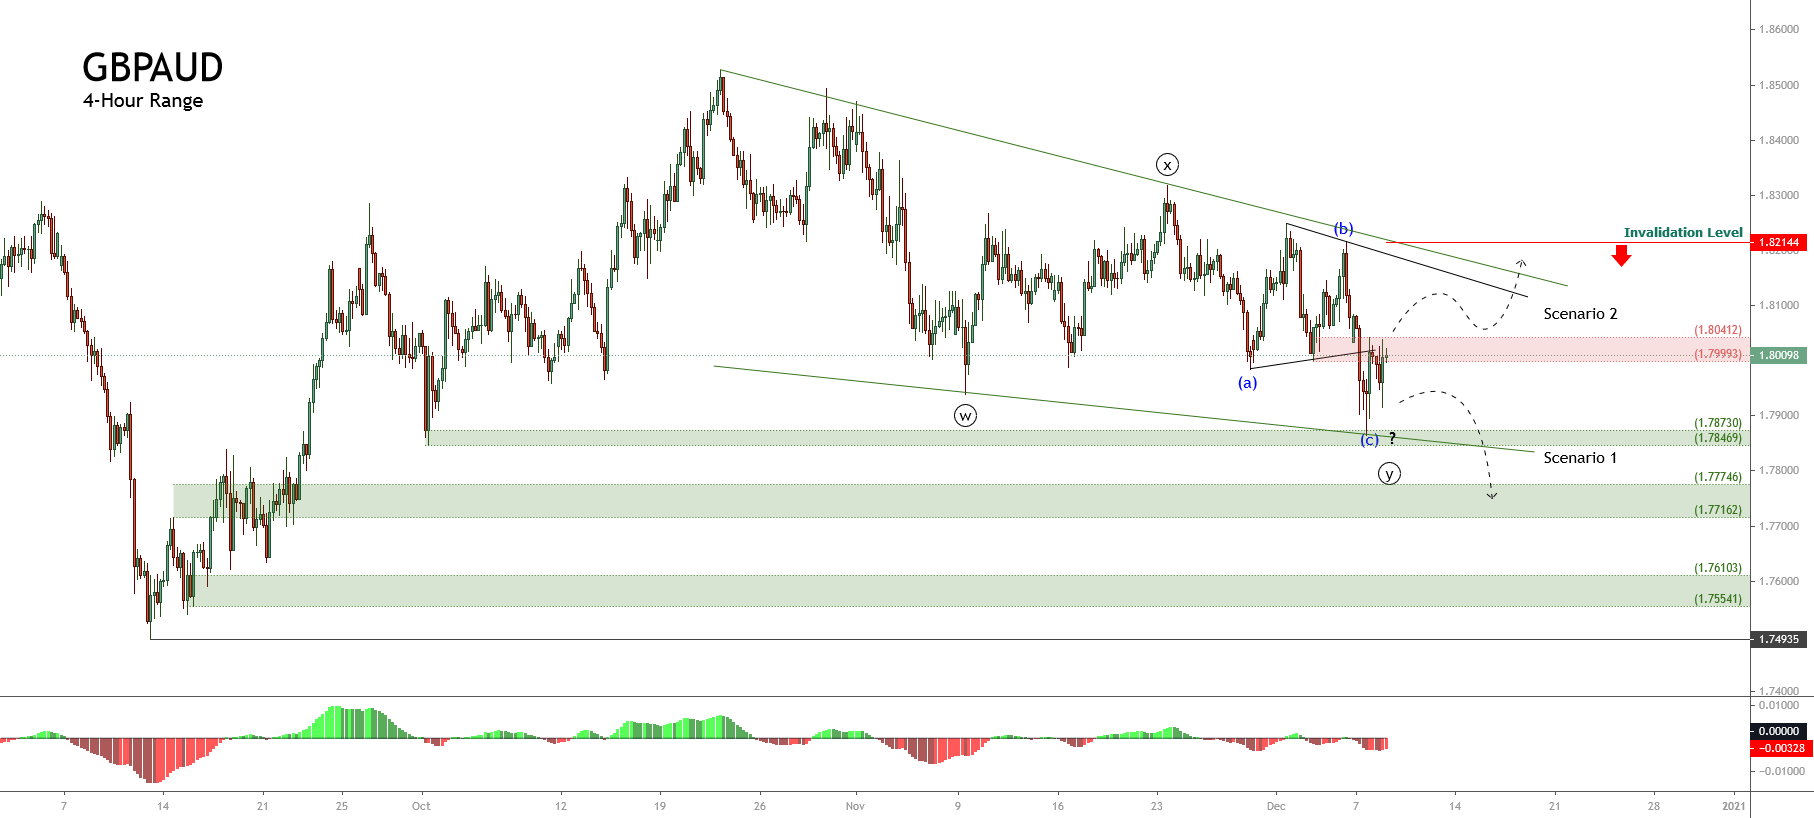
The previous chart shows the GBPAUD developing a double three pattern. According to the textbook, this complex corrective formation follows an internal sequence subdivided into 3-3-3, where each three corresponds to a basic corrective structure.

Currently, the cross looks advancing in its wave (c) of Minuette degree labeled in blue, which belongs to the wave ((y)) of Minute degree identified in black. The movement developed until now fits two potential scenarios:

  • The first scenario considers the pause in the wave (c), which could see further declines to the demand zone between 1.7774 and 1.7716. The cross could even extend its drops until 1.7610 and 1.7554, where the price could find fresh buyers expecting a boost in its price to new highs.
  • The second occurs if the price ends its wave (c) in blue and rally toward fresh highs. In this context, the cross should confirm the breakout of the supply zone resistance at 1.8041. Also, the cross must break up the ((x))-(b) trend-line.

Finally, the invalidation level for this bearish sequence in progress can be found at the end of wave (b) in blue at 1.82144.

Categories
Forex Market Analysis

Watchout the Potential Next Rally of GBPAUD

GBPAUD advances on Monday’s trading session in the bullish sentiment zone, testing the resistance level at 1.82688, which corresponds to the extreme bullish zone’s resistance.

Technical Overview

The following 12-hour chart illustrates the price that reached a new peak in the 90-day range at 1.85272. The cross began to retrace towards the neutral zone at level 1.80104, where the price found support and began to move mainly sideways on the bullish sentiment zone, finding resistance at level 1.82688.

Likewise, it highlights the support’s confirmation in the neutral level of the 90-day range, which leads to the observation of the upward pressure it shows the cross short term. In this context, the GBPAUD cross could experience a new rally that could lead to a test of the psychological resistance level located on 1.8500.

Short-term Technical Outlook

The short-term Elliott Wave graph of the GBPAUD cross unfolded in the following 12-hour chart shows the price action moving in an incomplete wave ((c)) of Minute degree labeled in black, which belong to the fourth wave of Minor degree identified in green.

The big picture reveals the cross is moving in an impulsive descending structure of Minor degree, in green, progressing in its fourth wave. This corrective structural series began last September 11th when the GBPAUD found fresh buyers at 1.74935.

The completion of the internal wave ((a)) at 1.85272 on October 21st and wave ((b)) at 1.79378 on November 09th leads to the anticipation of further upward movements in a five-wave internal sequence corresponding to wave ((c)) identified in black. In this regard, the previous chart shows the price starting to develop its third wave (iii) of Minuette degree, labeled in blue.

In this context, the current upward sequence in development has two potential targets as follows.

  • The first potential target is found in the supply zone between 1.84295 and 1.85272. If the price starts to decline from this zone, this could indicate a dominant bearish pressure that could drag the price toward the last September’s lows zone on 1.7500.
  • The second potential target zone is between 1.87353 and 1.89667, which corresponds with the ascending channel’s upper line. If the GBPAUD cross reaches this zone, this could indicate a dominant bullish pressure, and a correction could likely drive the price to the end of wave ((b)) on 1.7937, where the cross could find fresh buyers.

For the active intraday bullish scenario, the short-term invalidation level is located at 1.79378, which corresponds to the origin of wave ((c)).

Categories
Forex Market Analysis

Australian Dollar Prepares for Interest Rate Decision and Retail Sales Data Ahead

Overview

The Australian Dollar will face two high volatility events; the first one corresponds to the interest rate decision, for which the analysts’ consensus foresees a rate cut to 0.1% from the current 0.25%. The second one corresponds to September’s Retail Sales figures, where the consensus expects a recovery. Nevertheless, the price action suggests a new decline before reversing.

Market Sentiment

From a fundamental perspective, the Australian Dollar will have two high volatility events that will drive the next week’s oceanic currency movements.

The first event corresponds to the Interest Rate Decision, which will occur on Monday the 2nd during the overnight session. The analysts’ consensus foresees a reduction from the current rate of 0.25% to 0.10%. 

The last interest rate cut by the Reserve Bank of Australia’s broad members occurred in March 2020, where policymakers decided to cut the reference rate from 0.5% to 0.25%.

The second high impact will occur in the overnight trading session of Tuesday 03rd, where the Australian Bureau of Statistics will release the Retail Sales (MoM) data corresponding to September. The analysts’ consensus foresees a decline to 1.5%. 

Although the analysts’ polled foresee a contraction for September, they expect an improvement in the retail sector after falling 4% in August.

On the market sentiment side, the GBPAUD cross in its daily chart exposes the 90-day high and low range, which reveals the short-term participants’ sentiment. 

The previous chart illustrates the price action moving in an upward sequence that began on September 11th that pushed the cross from the extreme bearish sentiment zone toward the extreme bullish sentiment zone. 

In fact, the 60-day moving average movement below the price confirms the bullish bias that carries the cross. The next supports locates at 1.82688, which corresponds to the extreme bullish sentiment zone support, and 1.81227 corresponds to the 60-day moving average that acts as a dynamic support.

In summary, considering the pessimistic forecasts by the Australian data analysts and the extreme bullish sentiment unveiled in the GBPAUD cross, there exist the possibility of further weakness in the oceanic currency.

Technical Analysis Outlook

The big picture of the GBPAUD cross under the Dow Theory exposed in its 2-week log-scale chart reveals the price is moving mostly sideways since early March 2013, when the price touched its bottom of 1.43811. Once the cross found buyers, the price raised until 2.23722 reached in mid-August 2015. 

Once the March 2015 high was reached, the pair started to correct the Primary trend finding support at 1.57896 in late October 2016. This correction accomplishes the Dow Theory rule that says that the Secondary trend retraces between 33% to 66% of the Primary trend. 

The same situation occurs with the ascending sequence that advances from 1.57896 toward 2.08522 reached in mid-March 2020, which retraces beyond 66% of the previous decline. 

Likewise, the GBPAUD cross started to develop a downward sequence, which found a bottom at 66% of the previous rally. Nevertheless, considering the price and time relationship between the last decline and the previous two movements, we conclude that this decline corresponds to the Minor trend of the Secondary upward trend, which looks incomplete. 

The GBPAUD outlook under the Elliott Wave Theory exposes the progress in a downward five-wave sequence, which advances in its incomplete wave 4 of Minor degree labeled in green. This corrective structural series currently moves in its wave ((a)) of Minute degree identified in black.

Considering the elliott Wave theory, the current wave in progress should develop three internal segments and advance until the zone between 1.86783 to 1.90442, where the cross could find resistance and start its wave ((b)) in black.

Likewise, considering that the third wave of Minor degree is the extended wave, the fifth wave should fail to reach a lower low than the end of the third wave of Minor degree located at 1.74935. Finally, the invalidation level of the bearish scenario is located above 1.95100.

Categories
Forex Signals

GBPAUD Raises After Intraday Breakout

Description

The GBPAUD cross advances on the first trading session o Monday in its of the week boosted by the risk-off sentiment in the currency market.

From the GBPAUD chart, in its hourly timeframe, we distinguish the intraday breakout after the price failed its intraday decline founding support at 1.76331, from where fresh buyers took the market bias control boosting the price to surpass and break the descending intraday trendline.

In this regard, the consolidation above the downward trendline added to the 135-hour moving average leads us to expect a bullish movement that could advance toward the September 17th high located at 1.78394, where the cross could find resistance.

Our bullish foresees an upward move from the zone of 1.7718 with a potential profit target at 1.7838. The invalidation level of our scenario is located at 1.7648 that coincides with the last daily low.

Chart

Trading Plan Summary

  • Entry Level: 1.7728
  • Protective Stop: 1.7648
  • Profit Target: 1.7838
  • Risk/Reward Ratio: 1.38
  • Position Size: 0.01 lot per $1,000 in trading account.


Check out the latest trading signals on the Forex Academy App for your mobile phone from the Android and iOS App Store.

Categories
Forex Signals

GBPAUD Activates a Double Bottom Pattern

Description

The GBPAUD cross in its 4-hour chart illustrates the double bottom pattern’s throwback, which activated once the price action surpassed the 1.8090 level.

The chartist formation characterized by having two valleys and one peak found its first valley at 1.7868 on June 30th, where developed a bounce that carried it until 1.8090 on July 02nd. The following valley that found support at 1.7882 created a bearish failure, from where the price action started to develop a bullish move. This intraday rally drove GBPAUD to reach a new short-term higher high, reflecting its movement on the RSI oscillator, which surpassed the level-70, giving an additional signal of potential recovery.

The current retracement, which corresponds to a throwback, lead us to conclude that the price action could develop a new rally with a potential profit target located at 1.8345. 

Our invalidation level locates at 1.7981, which corresponds to 50% of the bottom formation range. 

Chart

Trading Plan Summary

  • Entry Level: 1.8096
  • Protective Stop: 1.7981
  • Profit Target: 1.8345
  • Risk/Reward Ratio: 1.9
  • Position Size: 0.01 lot per $1,000 in trading account.

Check out the latest trading signals on the Forex Academy App for your mobile phone from the Android and iOS App Store.

Categories
Forex Signals

GBPAUD Shows a Bearish Failure

Description

The GBPAUD cross in its 2-hour chart exposes an upward advance after the price developed a new lower low in the Tuesday 23rd trading session. The price found an intraday bottom at 1.79997 from where the price recovered erasing the Tuesday losses climbing until level 1.80910.

The price action suggests the structure as a bearish failure, which is confirmed by the bullish breakout observed in the RSI oscillator. On the other hand, the RSI illustrates a sequence on lower highs while the price developed a lower lows series, which corresponds to a bullish divergence. This divergence leads us to conclude that the downtrend developed by the GBPAUD is in an exhaustion stage, and a bullish reversal is imminent.

The breakout over the recent swing high at 1.8066 makes us foresee further upsides until the zone of 1.8236. The invalidation level of our bullish scenario locates at 1.8015.

Chart

Trading Plan Summary

Categories
Forex Signals

GBPAUD Moves in an Expanding Triangle

Description

The GBPAUD price in its hourly chart exposes the progress in an ascending expanding triangle, which began on the low of June 05th at 1.8060 when the cross found fresh buyers.

The overlapped upward sequence boosted until 1.8452 reached on June 12th when the cross found resistance at the zone of previous June 02nd high reacting mostly bearish starting a corrective movement in a three-wave sequence.

The end of the three-wave corrective sequence found support on June 16th at 1.8148 from where the price action revealed the bullish incorporation of institutional participants, which on Wednesday trading session dragged the price to the zone of 1.8176 in where the price started to show bullish incorporations.

Considering the Elliott wave theory’s alternation principle, we expect a rally that should boost the price to fresh higher highs in the following trading sessions.

A buy-side position will activate at 1.8200 as psychological support; our short-term target locates at 1.8380, this level coincides with the previous high of June 16th, representing an intraday resistance. If the bullish momentum surpasses this resistance, we will expect further raises. The invalidation level of the scenario locates at 1.8110.

Chart

Trading Plan Summary

Categories
Forex Signals

GBPAUD Advances in an Ending Diagonal Pattern

Description

The GBPAUD cross, in its hourly chart, advances in a downward structure that follows the Elliott wave sequence as an ending diagonal pattern, which suggests a potential scenario of upside.

According to the textbook, the ending diagonal pattern is a structure that reflects the exhaustion of the trend, and its reversion would be imminent.

Currently, the price action advances below the lower guideline of the diagonal pattern, which warns us about the potential bearish failure continuation.

Our bullish scenario considers the long-side entry in the current area, looking for the upward move until the previous consolidation area at 1.8998. Our upward outlook considers the invalidation level at 1.87187

Chart

Trading Plan Summary

Categories
Forex Signals

GBPAUD – Watchout this Ending Diagonal

Description

The GBPAUD cross in its hourly chart shows the progress of a corrective sequence that could correspond to a wave B in an exhaustion stage.

Once the cross reached its top at 2.08522, the price began a corrective structure. According to Elliott wave theory, the corrective sequence holds three segments. 

From the chart, we observe that the second wave corresponds to a zigzag pattern (5-3-5), from where the price action suggests that the second wave corresponds to an incomplete ending diagonal structure. 

The breakdown and close below the last pivot level at 2.04117 could be indicative of further declines, which could reach until 1.99169.

The level that invalidates our bearish scenario locates at 2.07199.

Chart

Trading Plan Summary

Categories
Forex Assets

Fundamentals Of Trading The GBP/AUD Currency Pair

Introduction

GBPAUD is an abbreviation for the Great Britain pound and the Australian dollar. This cross currency pair is widely traded with high volume in the forex market. In this pair, GBP is the base currency, and AUD is the quote currency.

Understanding GBP/AUD

The value of GBPAUD in the market is the value of AUD equivalent to one pound.GBPAUD is quoted as 1 GBP per X AUD. For example, if the value of GBPAUD is 1.8505, then these many Australian dollars are to be given to receive one pound.

GBP/AUD Specification

Spread

The prices for buying and selling a currency pair are different. To buy, one must refer to the ask price; and to sell, one must refer to the bid price. The difference between the bid price and the ask price is called the spread. The spread varies from the type of account model.

ECN: 0.7 | STP: 1.7

Fees

Apart from the spread, brokers levy fee on every round-trip trade. This fee is fixed in for every trade. However, it varies from broker to broker. Usually, there is no fee on STP accounts. On ECN accounts, there is a fee of a few pips.

Slippage

Slippage is the difference between the price when the trader entered the market order and the price he was actually given. Most of the time, there is a variation in the prices. This difference could be in favor of or against the trader. There are two factors responsible for it. One, the volatility of the market, and two, broker’s execution speed.

Trading Range in GBP/AUD

The trading range of currency pairs simply depicts the volatility of the pair in a different timeframe. In other terms, the trading range represents the minimum, average, and maximum pip movement in different timeframes. These values are helpful in assessing one’s risk, as well as making trades much cost-effective.

Procedure to assess Pip Ranges

  1. Add the ATR indicator to your chart
  2. Set the period to 1
  3. Add a 200-period SMA to this indicator
  4. Shrink the chart so you can determine a large time period
  5. Select your desired timeframe
  6. Measure the floor level and set this value as the min
  7. Measure the level of the 200-period SMA and set this as the average
  8. Measure the peak levels and set this as Max.

GBP/AUD Cost as a Percent of the Trading Range

Cost as a percent of the trading range is a very supportive tool in analyzing the cost of a trade, in different timeframes, and at different volatilities. This is done by finding the ratio of the total cost and volatility values and then expressing it as a percentage. The comprehension of the below tables shall be discussed in the subsequent topic.

ECN Model Account 

Spread = 0.7 | Slippage = 2 |Trading fee = 1

Total cost = Slippage + Spread + Trading Fee = 2 + 0.7 + 1 = 3.7

STP Model Account

Spread = 1.7 | Slippage = 2 | Trading fee = 0

Total cost = Slippage + Spread + Trading Fee = 2 + 1.6 + 0 = 3.7

The Ideal way to trade the GBP/AUD

Note that the higher the magnitude of the percentage, the higher is the cost of the trade. From the table shown above, we can observe that the values are highest on the min column and lowest on the max column. This means that the costs are higher when the volatility of the market is low and vice versa. Reading it horizontally, the cost gets lower as the timeframe widens. Hence, the ideal to trade when the pip movement of the currency pair is near the average values. This will ensure decent volatility by keeping the costs minimal.

Another effective way to reduce the total cost is by trading using limit orders, not market orders. Doing so, the slippage on the trade will shrink to zero. The following table shows the costs of the GBP/USD with no sleppage, for the same market conditions as on the preceding tables.

Total cost = Spread + trading fee + slippage = 0.7 +1 + 0 = 1.7

Hence, from the above table, it can be inferred that the cost percentages have a significant value.

Categories
Forex Market Analysis

Forex and Indices – Daily Update – 03.08.18


Fundamental Overview


The U.S. unemployment rate declined to 3.9 per cent in July.

During the Friday trading session, the US Labor Department issued the employment data for July. Non-farm payrolls reached 157,000 new jobs, being lesser than the 190,000 expected by analysts, and was worst than the 248,000 jobs created in June. The unemployment rate for its part fell to 3.9% in July from 4% reported in June by the Labor Department. Despite these data, it is still not possible to reach the level reached in May, which reached 3.8%. Finally, Average Hourly Earnings increased to 0.3% in July from the 0.1% registered in June. The following question is how much will impact the increase in average earnings in the consumer confidence and inflation rate?

source: tradingeconomics.com


Technical Analysis


EURUSD

EURUSD in the 1-hour chart is consolidating between the daily pivot level and the first daily support. For long positions, we need to wait for the close above 1.16, with a profit target in the first daily resistance at 1.1640. Short positions should be valued if the price breaks and close below 1.1580 with a potential profit target in the second weekly support at 1.1544.


GBPUSD

GBPUSD is testing as the support the lower HHL at 1.30103, a consolidation below this level could be a signal for more weakness. For short positions, the price should break and close below 1.30 level with a potential profit target in the lower low of July 19 at 1.2957. For long positions, the price must to break and consolidate above 1.3038 with a potential target in the weekly pivot level at 1.3130.


USDCHF

The USDCHF pair has moved bullish following the triangle pattern as a continuation structure. Currently, the pair is running between the first daily resistance and the daily pivot level. Long positions could be valued if the price breaks above 0.9960, with a potential profit target in the first weekly resistance at 0.9976. For short positions, the price must close under the daily pivot level at 0.9941, with a potential profit target in the confluence between the second daily support and the first weekly support at 0.99.


EURAUD


EURAUD is moving sideways between 1.5724 and 1.5782. Currently, the cross is testing the lower base of the range. A breakdown could drive to the EURAUD drop to the first weekly support at 1.5673. In the bullish scenario, the price could reach the second daily resistance at 1.5818.


GBPAUD

GBPAUD is moving sideways testing the base of the lateral channel in the same way that EURAUD. The breakdown could trigger more falls with a potential target in the second weekly support at 1.7572. For the bullish case, the breakout above 1.7690 could lead the price to the potential profit in the daily pivot level at 1.7720.


FTSE 100

The British index FTSE 100 is consolidating in the confluence zone between the second daily support and second weekly support. For short positions, the price should break below 7,551 pts., with a potential profit target in the third weekly support at 7,516 pts. For the reversal case, long positions should be valued if the price breaks above 7,590 pts, with a potential target in the next swing zone at 7,661 pts.


DAX 30

The DAX 30 is consolidating below the third daily support. In this case, it is highly probable that the price makes a reversal move, at least, to the first daily support located at 12,684 pts. For short positions, the price should close below 12,485 pts, with a potential target in the second weekly support at 12,348 pts.


Categories
Forex Market Analysis

Forex and Indices – Daily Update – 25.07.18


Fundamental Overview


President Trump will meet with Juncker.

US President Donald Trump will meet with the president of the European Commission, Jean-Claude Juncker, in an attempt to overcome the difficulties in bilateral relations between the United States and the European Union, specifically facing the application of additional tariffs to European cars exported to the United States which Trump seeks to increase.

The European Union applies additional 10 per cent tariffs to automobiles imported from the United States, while the United States applies only 2.5 per cent to European cars. Finally, President Trump commented on his Twitter account that both the United States and the European Union should eliminate all tariffs, barriers and subsidies, making trade between them both more just.


Technical Analysis


Forex Trading Indicators

EURUSD

Forex Trading Indicators: EURUSD continue moving sideways but with an intraday bullish bias. The price continues bouncing from the daily pivot at 1.1684. For intraday positions, long positions should be considered if the price breaks above 1.1710, with a potential profit target placed at the second resistance at 1.1747 and the second potential target in the area between the third daily resistance (1.1777) and the first weekly resistance (1.1785). Short positions should be valued if the pair breaks down the weekly pivot level at 1.1680 with a profit potential target at 1.1615.


GBPUSD

Forex Trading Indicators: The GBPUSD pair, as seen on a 30-minutes chart, broke up and consolidated above the first daily resistance on Tuesday 24th’s trading session. In the current session, the price can not strike above the first intraday resistance (1.3178.) For long positions, the price should break over 1.3175 with a potential profit target at 1.3212 (second intraday resistance). Short positions could be valued when the price breaks under 1.3140 with a potential target in first daily support at 1.3090.


USDCHF

Forex Trading Indicators: The USDCHF pair in the 30-minutes chart is moving sideways between the daily pivot (0.9937) and slightly below the first intraday support (0.9915). For long positions, the Swiss currency should break above the daily pivot level with a short-term target at 0.9960 (weekly pivot level); for bearish continuation, we need to see a price close below the intraday range at 0.9914, the potential profit target is at 0.9887 (third daily support).


EURAUD

Forex Trading Indicators: The EURAUD cross in the 30-minutes chart is testing the confluence between the daily and weekly pivot point at 1.5778. For bullish positions, the price should break above 1.58, and the potential target is at the first intraday resistance (1.5829). Bearish positions should be considered if the cross breaks under 1.5717 with a profit target in the confluence zone between the first weekly support (1.56735) and the second daily support (1.56612).


GBPAUD

Forex Trading Indicators: The GBPAUD cross is running sideways between 1.7680 and 1.7794. For long positions, the price should break above 1.7778, and its potential target is slightly above the first weekly resistance at 1.7858. In the case of short positions, the price should break down 1.7680, with a potential target at 1.7589 level.


FTSE 100

Forex Trading Indicators: The FTSE 100 in the 30-minutes chart turned bearish moving from the daily pivot at 7,699 to the weekly pivot level (7,649.9). For bullish positions, the price should break above 7,700 pts, with a potential target at 7,791 pts, which is the convergence zone between the second weekly resistance level and the second daily resistance. Bearish positions should be valued if the British index breaks under the weekly pivot level at 7,649 with a potential profit at the first weekly support (7,593 pts.), the second profit target is the HHL at 7,521 pts.


DAX 30

Forex Trading Indicators: DAX 30 in the 30 minutes chart. After failing the test to the first weekly resistance (12,737.1 pts.), the German index moves bearish below the daily and weekly pivot level turning to bearish the market sentiment. For long positions, we need to see the breakout above 12,600 pts with a potential target in the re-test of the first weekly resistance at 12,737 pts. A short position is considered if the price breaks down 12,537, and its potential target is the second weekly support at 12,293 pts with extension in the HHL at 12,143 pts.


Categories
Forex Market Analysis

Forex and Indices – Daily Update – 03.07.18


Fundamental Overview


Asian Session with all eyes placed on the RBA decision.

Forex and Indices: In the Overnight session, markets will place their eyes on the Board of Reserve Bank of Australia (RBA) interest rate decision in which the analysts’ consensus expects that Governor Philip Lowe and the Board members decide to keep the interest rate at the record low 1.50% which is unchanged since August 2016.

Despite the unemployment rate drop in May to 5.4%, and the inflation rate kept unchanged in May at 1.9%, being near to the RBA inflation target; The cooling on housing market and  the increased volatility in global markets due mainly to the tariffs conflicts, could drive to the RBA  to decide to keep the interest rate unchanged again.

Forex and Indices - Daily Update

Source: Forex.Academy Collection – Forex and Indices


Technical Analysis


EURUSD

The pair still is moving in a bearish wedge pattern which, if it breaks below 1.15649, could drive the price to a new lower low ending the bearish cycle near to the 1.1450 zone coinciding with the lower trendline of the bearish wedge. In the opposite case, if EURUSD breaks above 1.16801, the common currency could drive to test the invalidation level placed at 1.1852.


GBPUSD

GBPUSD is still running in a bearish wedge and has a new lower low pending before the cable starts a new bullish cycle. This lower low could be developed as a Bullish 2B pattern (Bear Trap) as a reversal pattern. As long as the price does not make a reversal pattern, the price will continue its bearish bias. Invalidation level of the bearish cycle is at 1.34725.


USDCHF

USDCHF is developing a triangulation structure. The RSI oscillator shows that the price has a bearish bias. However, as the price doesn’t have a definite trend in the short-term, we will expect a false breakout before we define our bias for this pair. In the long-term, the Swiss currency is consolidating a rally which started on February 15th, 2018.


EURAUD

The EURAUD cross maintains a bullish bias, due to the price moving inside an ascending wedge. Additionally, RSI is running in an ascending trend and is above the 60 level. We can expect a false breakout to the 1.59 zone before it completes the bullish cycle. If the price falls below 1.5702, we could evaluate short positions.


GBPAUD

The GBPAUD 2-hour chart shows a sideways move, as long as the price moves above 1.78747. The cross will have a last bullish target pending, placed at 1.8085 with an invalidation level below 1.78080, from where we will consider short positions with a profit target in the 1.74 zone.


FTSE 100

The FTSE 100 is moving sideways as a complex corrective structure consolidating the March to May rally. In the middle of global volatility in the stocks markets, we prefer to consider long positions rather than the short positions. The short-term support to control is 7,500 pts.


DAX 30

The DAX 30 2-hour chart shows that the German index has found support at 12,100 pts. From this area, we could start to propose potential zones for entry in the long side.


Categories
Forex Market Analysis

Forex and Indices – Daily Update – June 05th, 2018


FOREX MARKET NEWS AND ANALYSIS

Hot Topics: 

  • U.K. PMI Services helped the Pound Group to Show Reversal Signals.
  • Main Pairs Against the US Dollar Keeps Consolidating.
  • European Indices Close Lower.

U.K. PMI Services helped the Pound Group to Show Reversal Signals.

PMI Services in May reached 54 pts, the highest level for three months. After the data release, GBPUSD raised to 1.34 level. Now we expect a corrective move before a new bullish cycle. Invalidation level remains at 1.32544.


As we expected in our last Daily Update, GBPAUD made a bullish move from the second weekly support to the weekly pivot level direction. Now after the impulsive move, we expect that the price could make a consolidation move as a flag pattern before proceeding with its previous movement.


GBPNZD is making a potential bottom structure if the breakout of the 1.91286 level activates the figure, with the profit target at 1.93377. We are surveilling the 1.9005 level as Control Level.


Main Pairs Against the US Dollar Keep Consolidating.

The common currency still is developing a consolidation structure after the impulsive move started in the previous week. RSI has found support at the 41.69 level which makes us foresee a new clue for the bullish reversal move that could be starting.


The inversely correlated currency with the Euro and Swiss Franc is also making a sideways consolidating structure. We expect more declines for this pair; our first bearish target is 0.9815, the second target is 09783 level. Invalidation level is 0.9983.


European Indices Close Lower.

The FTSE 100 broke down the ascending flag pattern in the blue box. The invalidation level remains at 7,803 pts. In the same way, the RSI has broken down its ascending flag pattern. The British index could visit the 7,500 level, or if it moves below this level, the FTSE could make a second leg down before a new bullish cycle.


DAX 30 has made the same breakdown in the ascending wedge pattern. RSI also has broken down its ascending wedge. The first bearish target is 12,528. In case that price falls below 12,386, the next bearish targets are 12,125 and 11,990.


Categories
Forex Market Analysis

Forex and Indices – Daily Update


Hot Topics: 


  • Major currencies show bullish signals against the greenback.
  • Indices recovers but more falls are expected.
  • Pound crosses could turn bullish.


Major currencies show bullish signals against the greenback.

Forex Daily Market Update

The EURUSD broke up the flag pattern testing the 1.17 level resistance. Now the price is making a throwback to the congestion area. RSI also is showing bullish signals with the breakout and test to the flag structure.


GBPUSD looks like as its turning bullish. On the one hand, the price is making higher highs and higher lows. On the other, the RSI found support above the 40 level; this signal makes us foresee that a turning movement is near for the pound.


USDCHF is in a congestion zone between 0.9845 and 0.989. We expect a new bearish move to the region between 0.9784 and 0.9815. The shape of the price sequence that started on May 9th looks like a consolidation structure and is likely that the price could see new highs.


Indices recovers but more falls are expected.

FTSE 100 is recovering from the last selloff but is moving in the Potential Reversal Zone. RSI moves in an ascending channel but it still didn’t break the key level 60 to show bullish signals. Invalidation level is above 7,803.5.


In the same way as the FTSE, the DAX is moving in a consolidation structure as an ascending wedge. RSI is moving in the 51.53 level, but it doesn’t mean that in the short-term the trend is bullish, it suggests that the bias remains bearish and the price is making a retracement. Invalidation level is above 13,040.6.


Pound crosses could turn bullish.

GBPCAD is moving sideways and tested the monthly pivot level at 1.73191 becoming a relevant resistance. We think the cross could make a new low near the first weekly support at 1.71310, where the price could start a bullish cycle with a profit target at the weekly second resistance confluence area on 1.7510. Invalidation level is placed below 1.7065.


GBPAUD  has been moving mostly bearish during this session, but we expect that the price could make a bullish reversal move in the area between 1.7360 and 1.73195, where it could bounce from, with the eyes placed on the weekly pivot at 1.76242. Invalidation level is below 1.725.


Categories
Forex Market Analysis

Forex and Indices – Daily Update for May 29th, 2018

FX Market Update Hot Topics:

  • U.S. CB Consumer Confidence in May Slightly Below the Analysts’ Expectations.
  • RBA Board Member says “who cares what’s happening to house prices.”
  • The indices sell-off continues, supported by the Italian crisis.

U.S. CB Consumer Confidence in May Slightly Below the Analysts’ Expectations.

The consumer confidence drops slightly below the analysts’ consensus at 128 pts versus the 128.2 expected. However, the confidence level in April was corrected down from 128.7 to 125.6 pts. Despite this correction, the U.S. Consumer Confidence keeps in the highest levels since 2001.fx

EURUSD accelerated its drops to the critical zone of the bearish cycle. The common currency falls for the seventh consecutive week breaking down the November 2017 support at 1.15539. For the coming sessions, we expect a limited fall to 1.14483 and then a recovery in three waves which could see the 1.197 level in the long-term. In the short-term, we update the invalidation level of the bearish cycle to 1.16317.


In the same way with EURUSD, GBPUSD continue its plunges for a seventh consecutive week dropping to the 38.2% Fibonacci level of the previous long-term cycle. We foresee new falls to the region between 1.31095 and 1.29357. Updated invalidation level is 1.33231. If price breaks above the break-down candle, we will consider changing the bias from bearish to bullish.


The Swiss currency is moving sideways expecting more volatility for the Greenback. We continue seeing more drops for this pair to the zone between 0.9815 to 0.9783 levels. The new invalidation level is 0.99831. The break-down candle signals more declines in the short-term.


RBA Board Member says “who cares what’s happening to house prices.”

The RBA’s Board Member Ian Harper said to the Wall Street Journal that “the bank will raise their interest rates when it has a basis for doing that because inflation is starting to pick up.” Member Harper added, “when all that starts to line up who cares what’s happening to house prices.” Harper continued that the RBA target “doesn’t target house prices.”

EURAUD. As the scenario expected, the price fell under the control level; now we expect a limited drop to the area between 1.5307 to 1.5195 levels, from where the price could start to bounce. Invalidation level is 1.54554.


GBPAUD is bouncing in the Potential Reversal Zone, 1.76773 to 1.75597, from where we foresee a bullish move to 1.78995. Invalidation level is on 1.77451. In the short-term, RSI shows signals of change in the trend bias from bearish to bullish.


The indices sell-off continues, supported by the Italian crisis.

FX Market Update: This Tuesday, the FTSE has continued the sell-off started last Wednesday 23rd, and the price consolidates below the invalidation level at 7,750 pts proposed in previous updates. The impulsive bearish move could stop briefly at 7,570 pts and make a bounce.  The new invalidation level for the short-term is 7,803.5 pts, and the main bias keeps on the bearish side.


In the same context, DAX  30 opened with a bearish gap, testing the mid-term support on 12,659.1 pts. Considering the bearish gap context, it is probable that the German index in the short-term makes a Dead Cat Bounce Pattern, watching the 12,000 pts as a target. Invalidation level is updated and established at 13,040.6 pts.