
GBPAUD advances on Monday’s trading session in the bullish sentiment zone, testing the resistance level at 1.82688, which corresponds to the extreme bullish zone’s resistance.
Technical Overview
The following 12-hour chart illustrates the price that reached a new peak in the 90-day range at 1.85272. The cross began to retrace towards the neutral zone at level 1.80104, where the price found support and began to move mainly sideways on the bullish sentiment zone, finding resistance at level 1.82688.
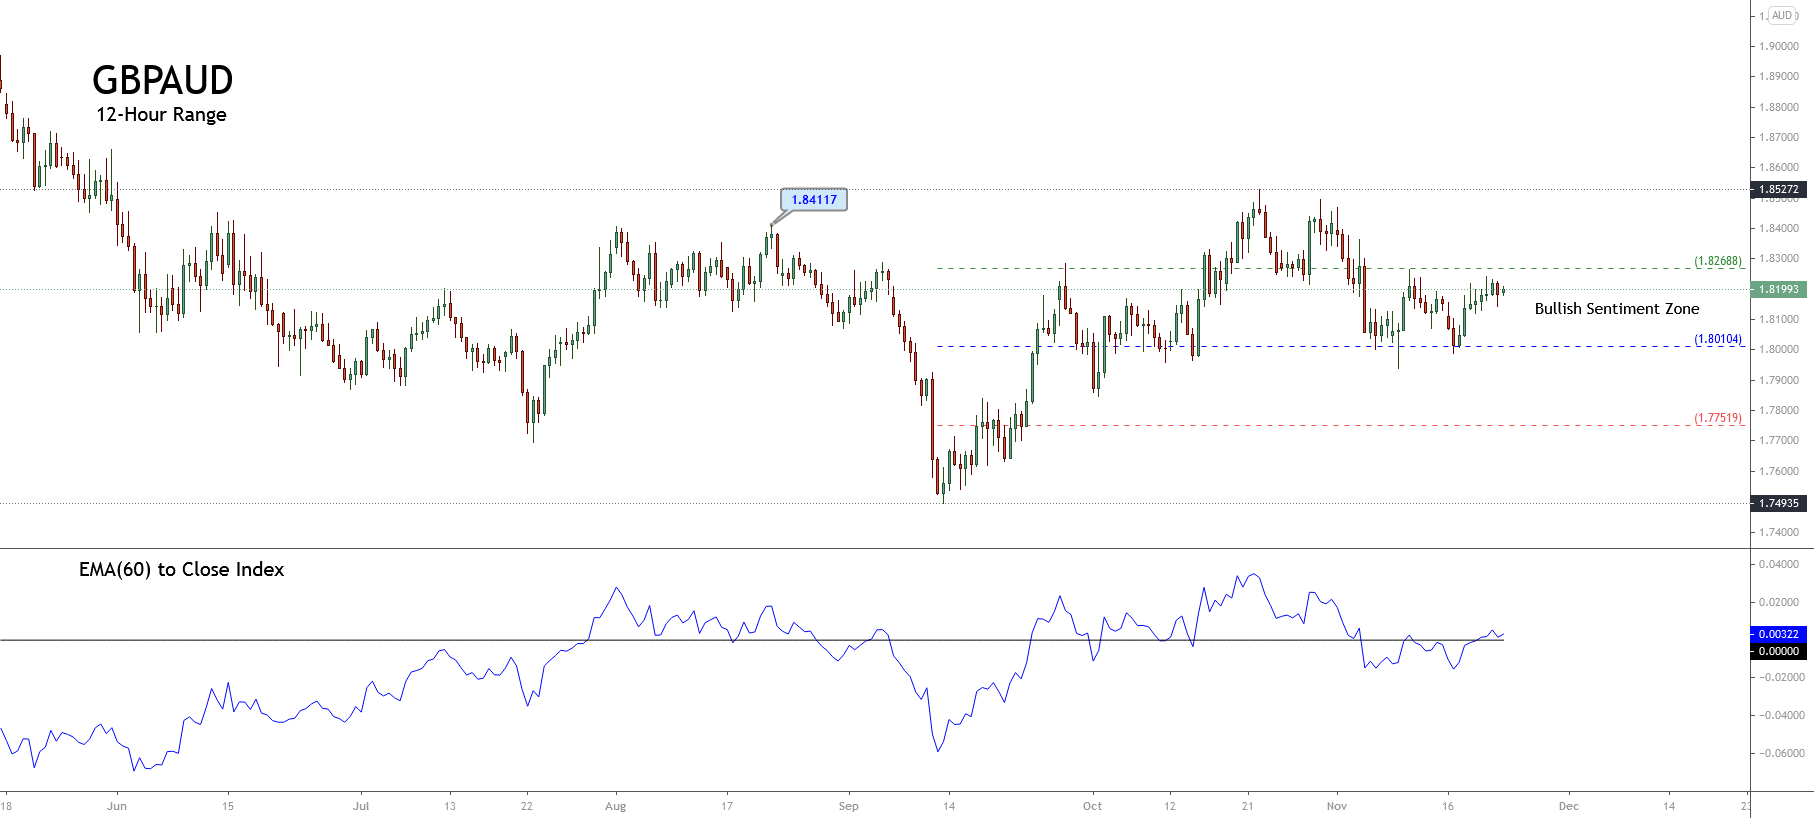
Likewise, it highlights the support’s confirmation in the neutral level of the 90-day range, which leads to the observation of the upward pressure it shows the cross short term. In this context, the GBPAUD cross could experience a new rally that could lead to a test of the psychological resistance level located on 1.8500.
Short-term Technical Outlook
The short-term Elliott Wave graph of the GBPAUD cross unfolded in the following 12-hour chart shows the price action moving in an incomplete wave ((c)) of Minute degree labeled in black, which belong to the fourth wave of Minor degree identified in green.
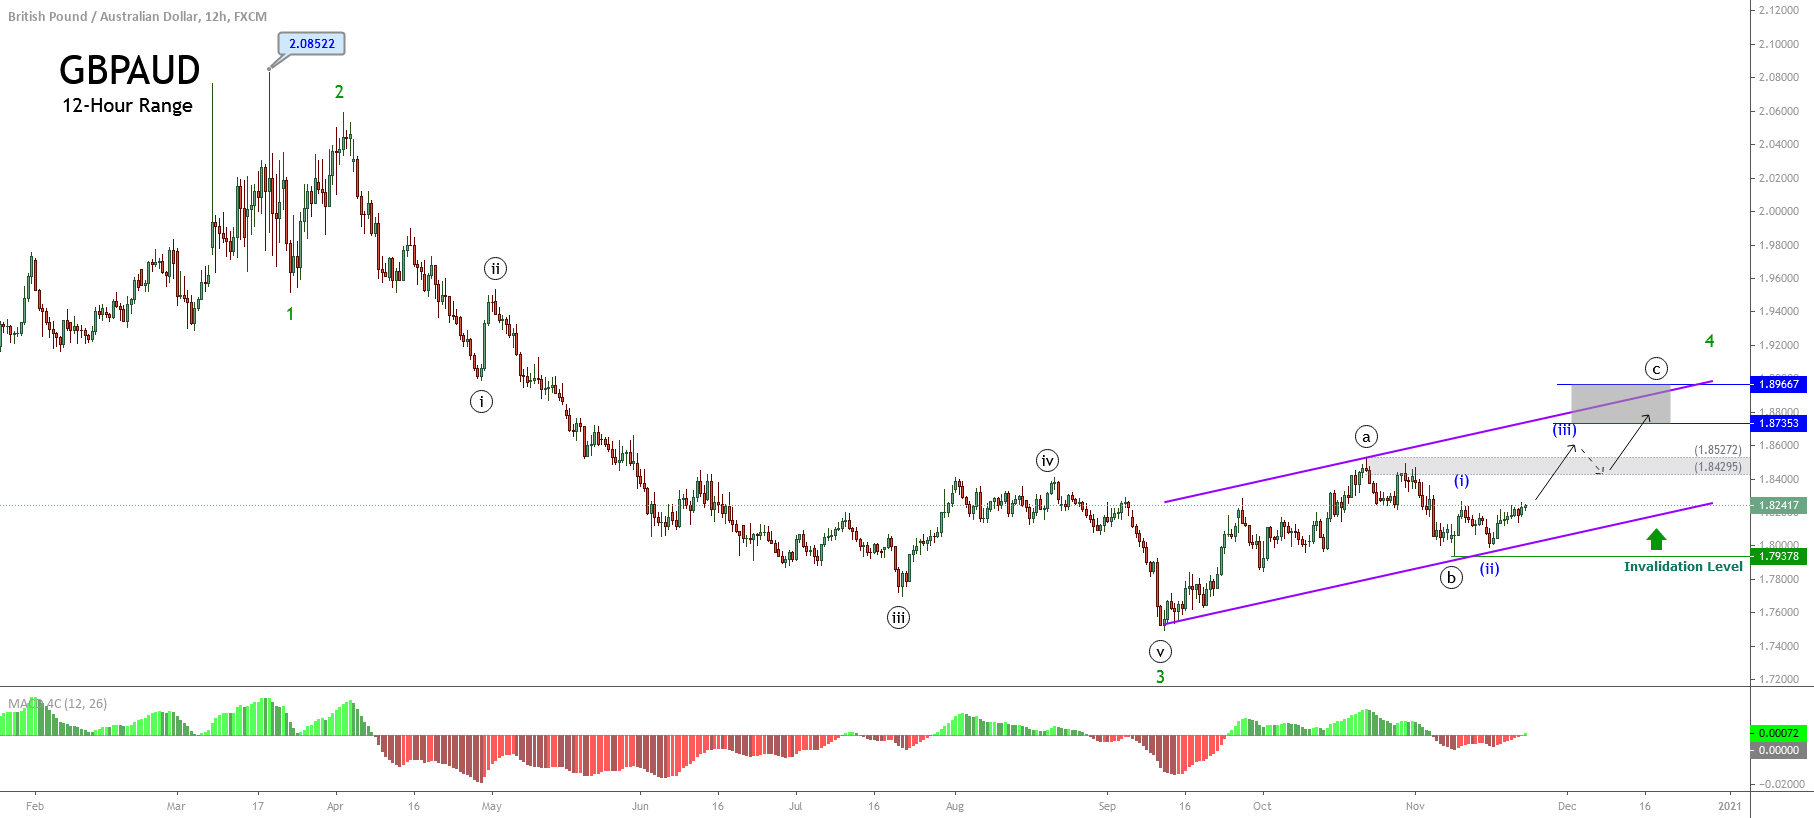
The big picture reveals the cross is moving in an impulsive descending structure of Minor degree, in green, progressing in its fourth wave. This corrective structural series began last September 11th when the GBPAUD found fresh buyers at 1.74935.
The completion of the internal wave ((a)) at 1.85272 on October 21st and wave ((b)) at 1.79378 on November 09th leads to the anticipation of further upward movements in a five-wave internal sequence corresponding to wave ((c)) identified in black. In this regard, the previous chart shows the price starting to develop its third wave (iii) of Minuette degree, labeled in blue.
In this context, the current upward sequence in development has two potential targets as follows.
- The first potential target is found in the supply zone between 1.84295 and 1.85272. If the price starts to decline from this zone, this could indicate a dominant bearish pressure that could drag the price toward the last September’s lows zone on 1.7500.
- The second potential target zone is between 1.87353 and 1.89667, which corresponds with the ascending channel’s upper line. If the GBPAUD cross reaches this zone, this could indicate a dominant bullish pressure, and a correction could likely drive the price to the end of wave ((b)) on 1.7937, where the cross could find fresh buyers.
For the active intraday bullish scenario, the short-term invalidation level is located at 1.79378, which corresponds to the origin of wave ((c)).