Categories
Forex Market Analysis

NZDCAD Heavy Drops driven by a Sharp Shift in Market Sentiment

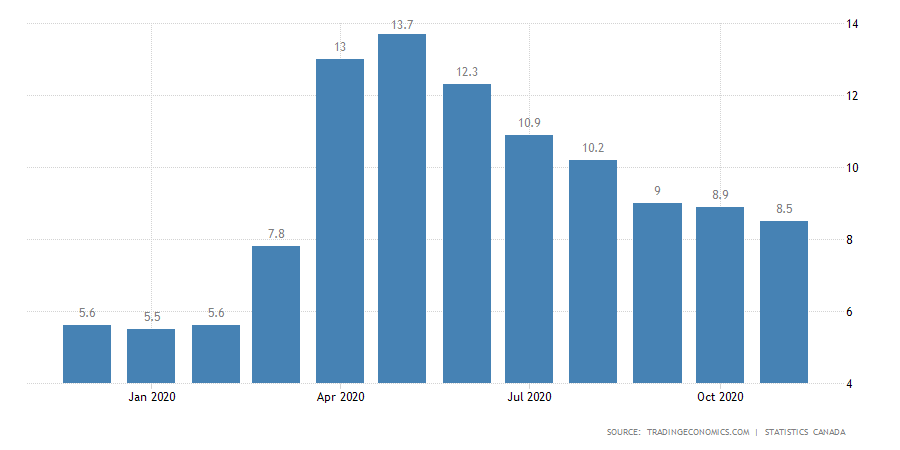
In the last trading week, the NZDCAD cross  90-Day market sentiment declined from the extreme bullish to the bullish sentiment zone. The move was helped by the Canadian unemployment rate figures, which declined to 8.5% in November, beating the analysts’ expectations of 8.9%. 

Source: TradingEconomics.com

The last unemployment rate reading represents an improvement in the Canadian labor market, which showed a slight decline to 8.9% in October. On the other hand, during the current year, the data gathered from Statistics Canada stated that the record unemployment high was Mays figure of 13.7%, its highest level in more than four decades.

Technical Overview

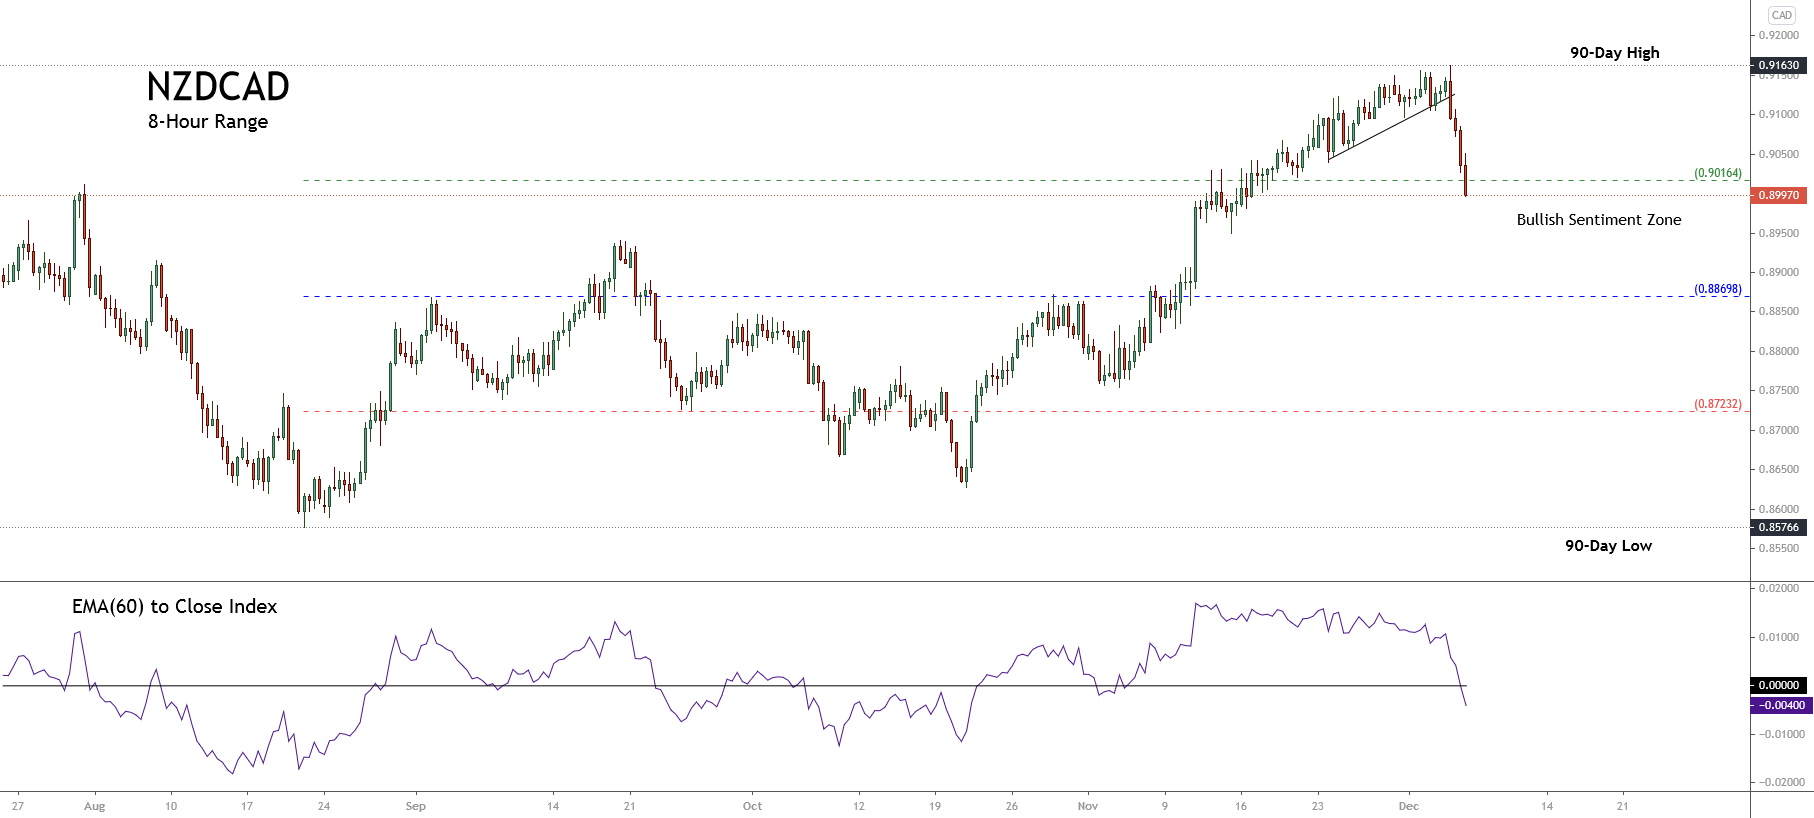
The following 8-hour chart illustrates the market participants’ sentiment unfolded in the 90-day high and low range, revealing an aggressive decline in the Friday 04th trading session where the cross dropped over 1.7%. 

In this context, the downgrade on the market sentiment leads us to expect a corrective movement. This potential drop could find support in the neutral zone of 0.88698. Likewise, the descending of the NZDCAD EMA(60) to Close index below the zero-line drives us to anticipate a consolidation during the coming trading sessions before continuing a further decline.

Technical Outlook

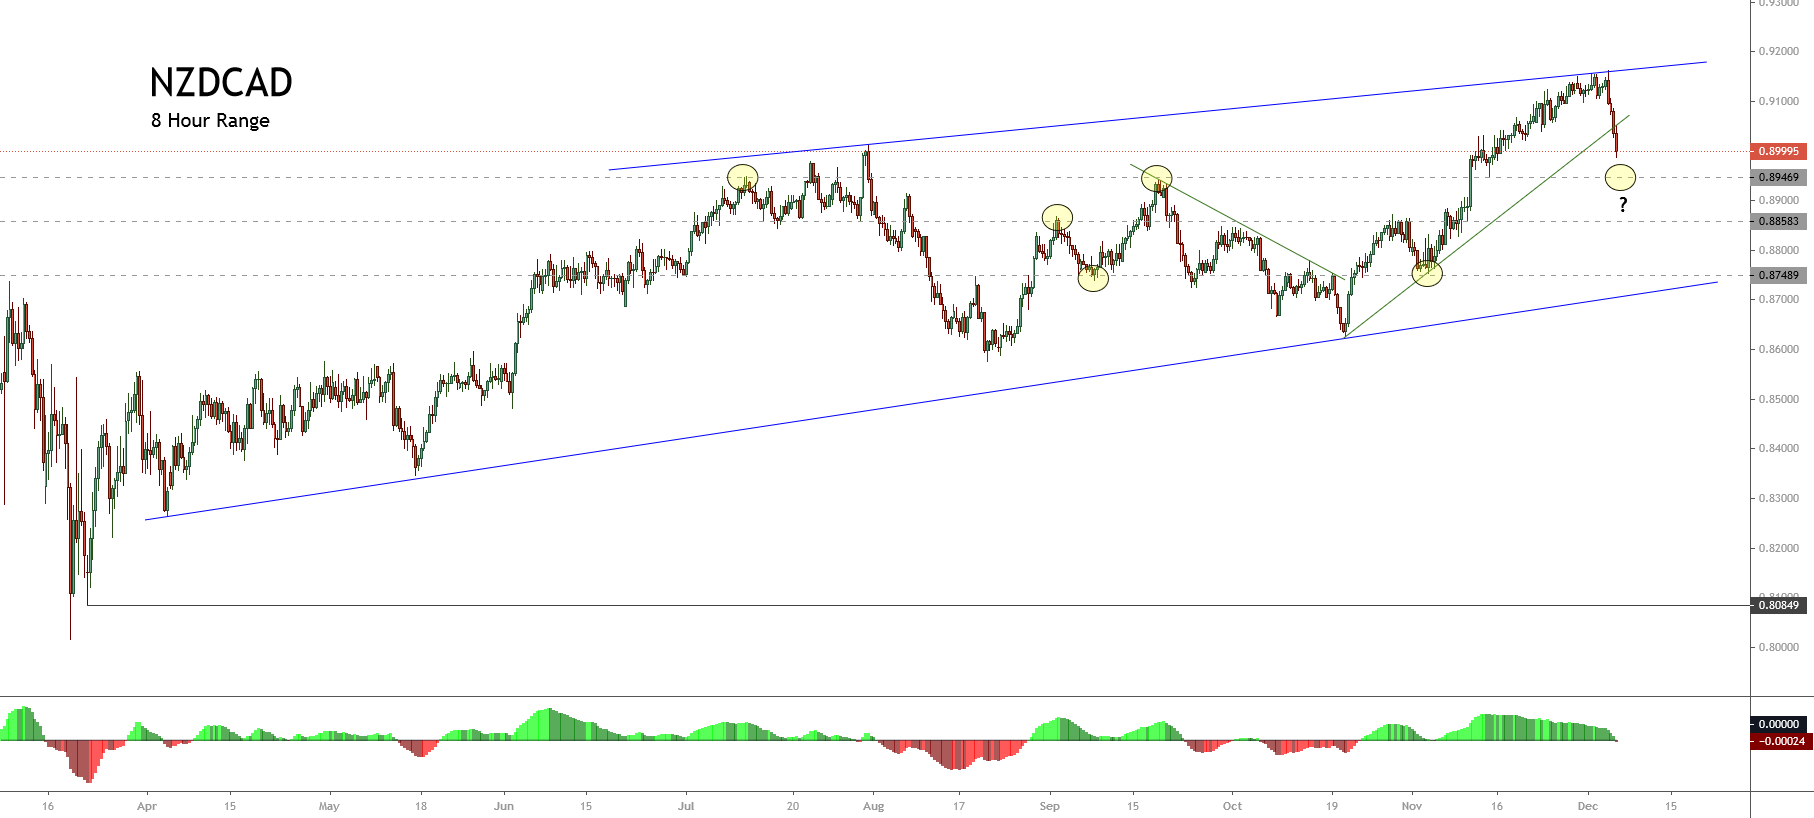
The NZDCAD cross in its 8-hourly chart illustrates the mid-term uptrend that began on March 18th once the price confirmed its bottom of 0.80849. The primary trend plotted in blue reveals that the bull market remains intact.

Likewise, the breakdown observed in the last ascending secondary trend identified in green reveals a short-term correction with three potential key support levels: 0.89469, 0.88583, and 0.87489. Each of these levels shows a zone where the price action developed a polarization movement.

The following 2-hour chart shows an impulsive movement, which began on October 20th when the price found support at 0.86270. After completing its third wave of Minuette degree, in blue, the NZDCAD cross found resistance on December 03rd at 0.91630, where it started a decline in an incomplete corrective sequence that could correspond to wave (iv), in blue.

In this context, the cross could develop two potential scenarios:

  • The first scenario occurs if the price completes the third wave on 0.91630. In this case, the cross could advance mostly sideways in its wave (iv), in blue. In this scenario, the cross could find support in the demand zone between 0.89723 and 0.89490, where the price could begin to advance in its wave (v) of Minuette degree at least to the 0.9163 level.
  • The second scenario: considers an alternative count and occurs if the NZDCAD cross completes a wave (v), in blue, on 0.91630. If that is the case, it implies the price is currently advancing in a corrective formation of Minuette degree. Thus, the price could create a decline in a three-wave sequence toward the next demand zone between 0.88437 until 0.88234. 

In both scenarios, the invalidation level is found below the origin of wave (i) at 0.86270.

Categories
Forex Elliott Wave Forex Market Analysis

AUDUSD Consolidates its Gains Expecting the US Employment Data Ahead

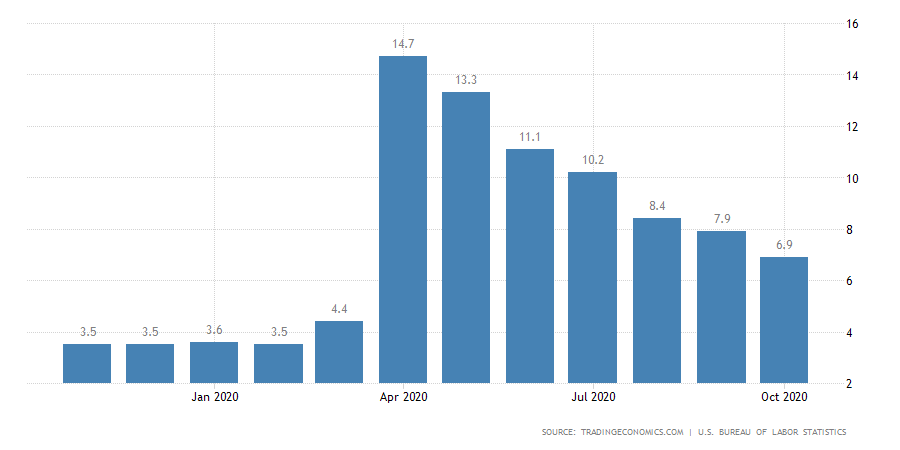
The price of AUDUSD reached a fresh yearly high at 0.74496 on the Thursday trading session expecting the last employment data release of the year for the US labor market corresponding to November. 

(Source: tradingeconomics.com)

Technical Overview

This year, as illustrated in the previous chart, Australia’s unemployment rate peaked at a record high of 14.7% in April, mainly boosted by the coronavirus lockdown. In this context, the analysts’ consensus expects the unemployment to drop to 6.8% for November, from 6.9% reported last October.

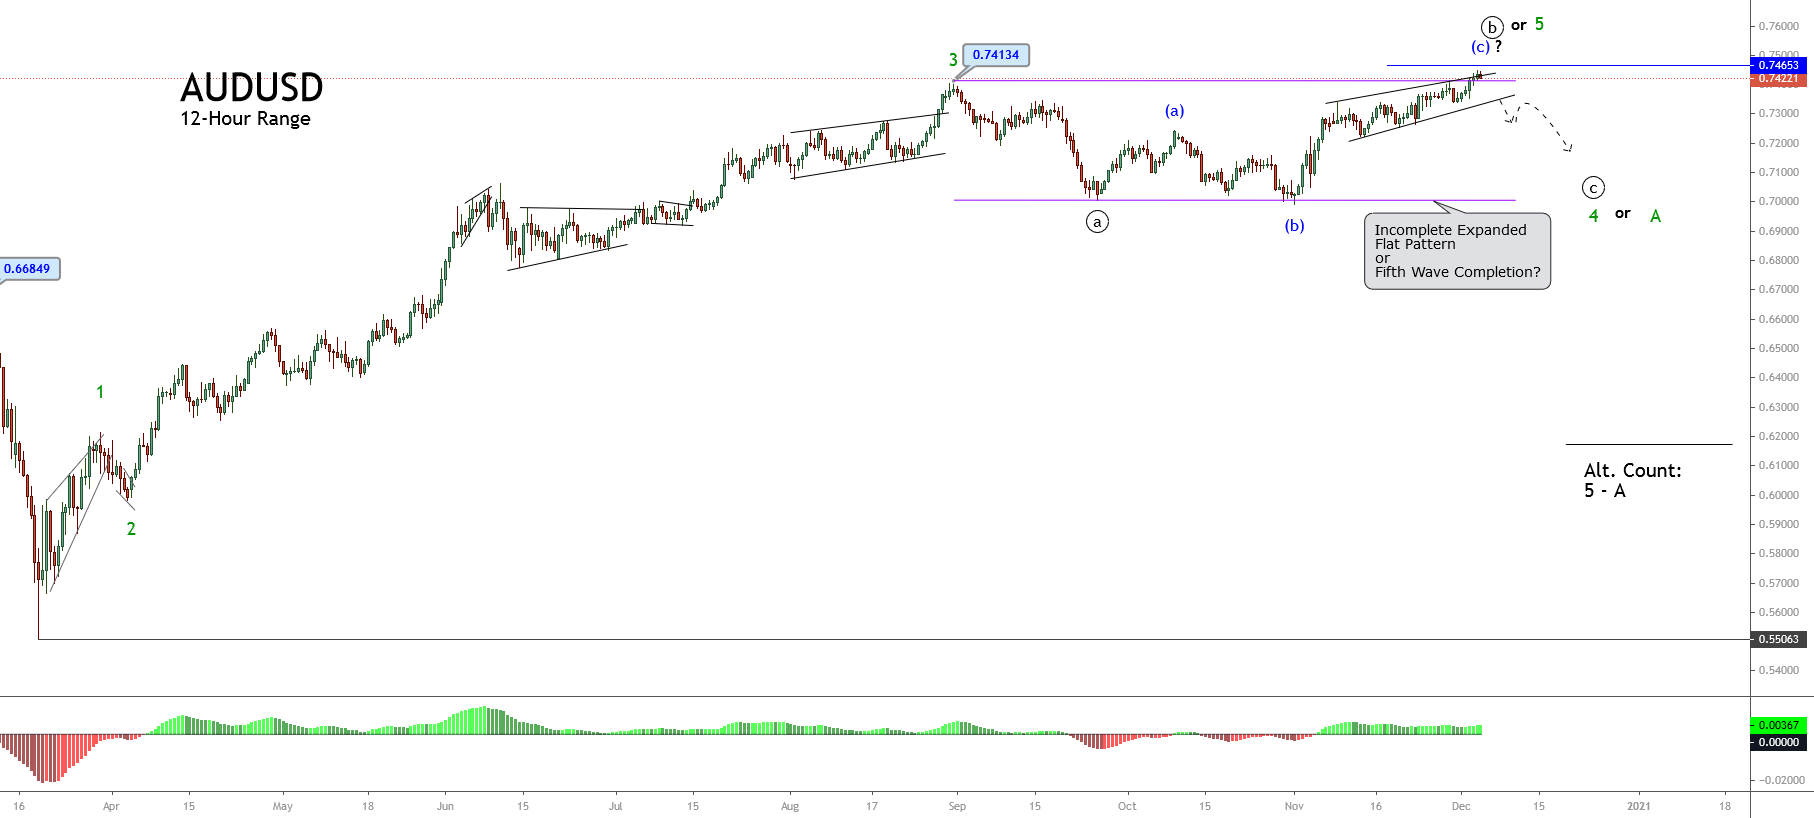
The mid-term Elliott wave perspective displayed in the 12-hour chart below reveals the upward progression in an incomplete five-wave sequence of Minor degree labeled in green. This bullish impulsive move began on March 18th when the Aussie found fresh buyers at 0.55063.

The previous chart also shows the Aussie’s advance in a third extended wave, suggesting that the price action could be moving in its fourth wave in green, still in development. 

This scenario considers that the Aussie moves in its internal wave (c) of Minuette degree labeled in blue, developing an ending diagonal pattern. Likewise, the wave of the upper degree corresponding to wave ((b)) of Minute degree identified in black should correspond to an expanded flat pattern, and the price should realize a new decline,

The alternative count considers the advance in the fifth wave of Minor degree in green is developing an internal ending diagonal pattern. In this case, the Aussie should start a decline corresponding to wave A in green.

Technical Outlook

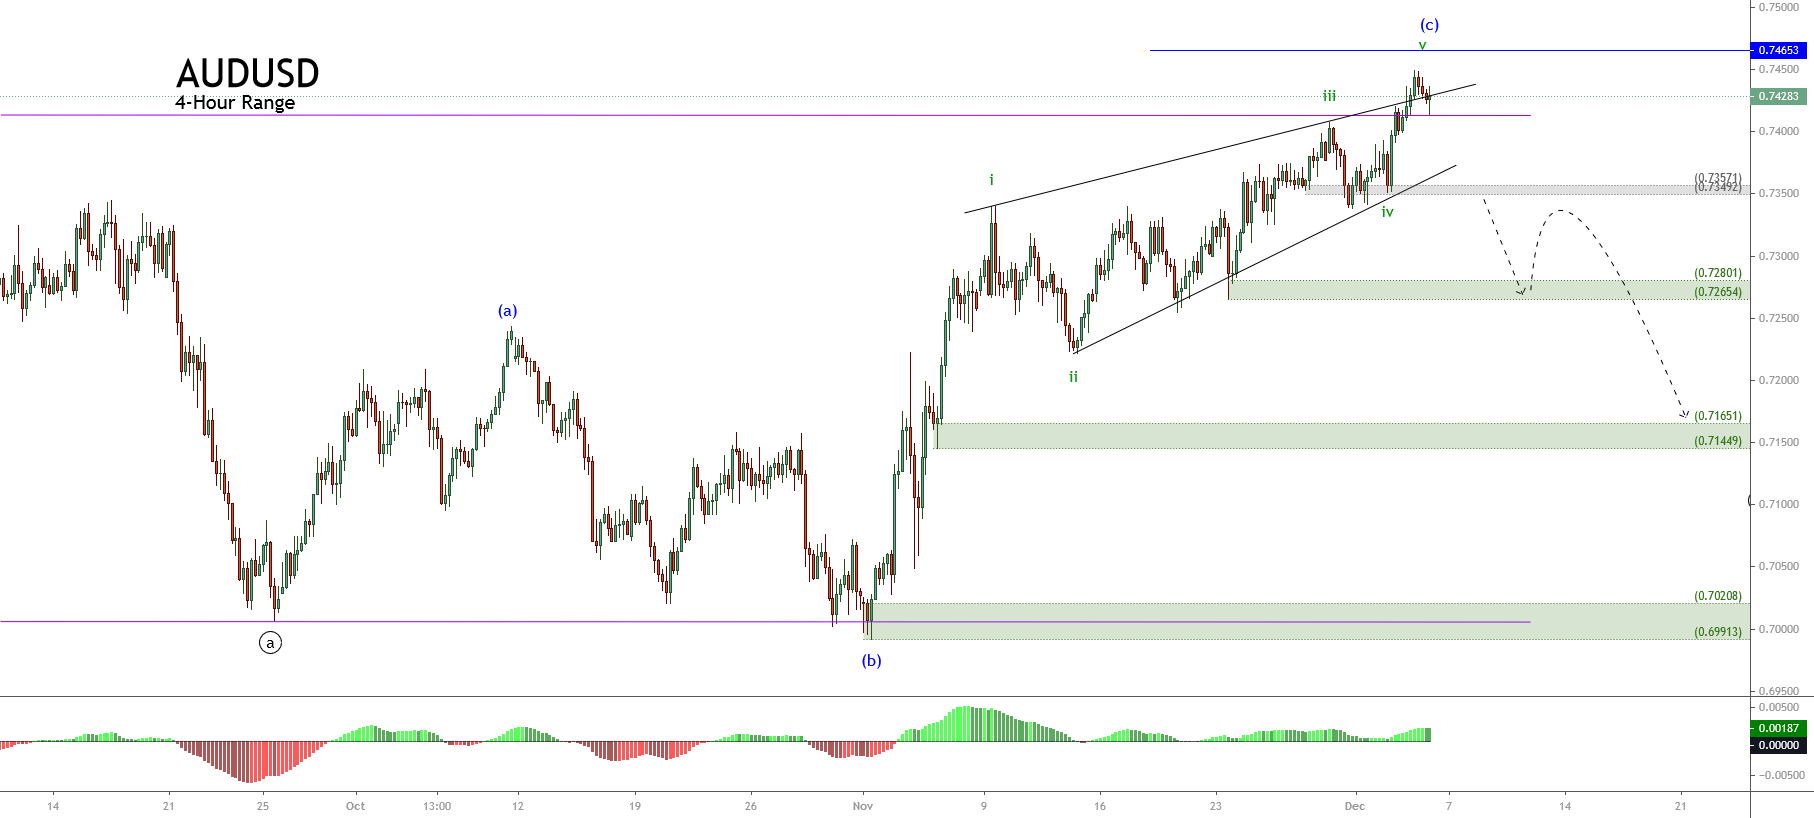
The short-term Elliott wave for AUDUSD exposed in its 4-hour chart shows the advance in an ending diagonal pattern, which looks developing its fifth wave of Subminuette degree labeled in green.

Although the ending diagonal pattern suggests completing the fifth wave or wave (c), the Aussie must confirm its completion through the breakdown of its base-line that connects the waves ii and iv, in green. Also, the price should confirm the close below the intraday demand zone between 0.73492 and 0.73571.

Finally, if the price confirms its downward correction, the potential target area for this movement is from 0.7265 and 0.7144. If the area fails to hold, and the bearish pressure extends this downward movement, the Aussie could visit the base of its sideways channel on the psychologically key level of 0.70.

Categories
Forex Course

184. Why Is It Important To Be Careful While Trading the News?

Introduction

Now that you know about scheduled news releases in the forex market, you must be excited. You probably think that you have the most foolproof way of trading in the forex market. You might have even gone to the extent of planning your trades to coincide with the high-impact indicators; because they significantly affect price action, you can collect a lot of pips.

Well, if you have thought and planned all that, forget it! To successfully trade the news in the forex market, you have to be deliberately methodical and calculative. If not, you may end up wiping out your trading account.

We’re not saying that you shouldn’t trade the news. Quite the opposite, you should, but only, and only when you understand the implications of the news release. Let’s, for example, take the release of a high-impact economic indicator.

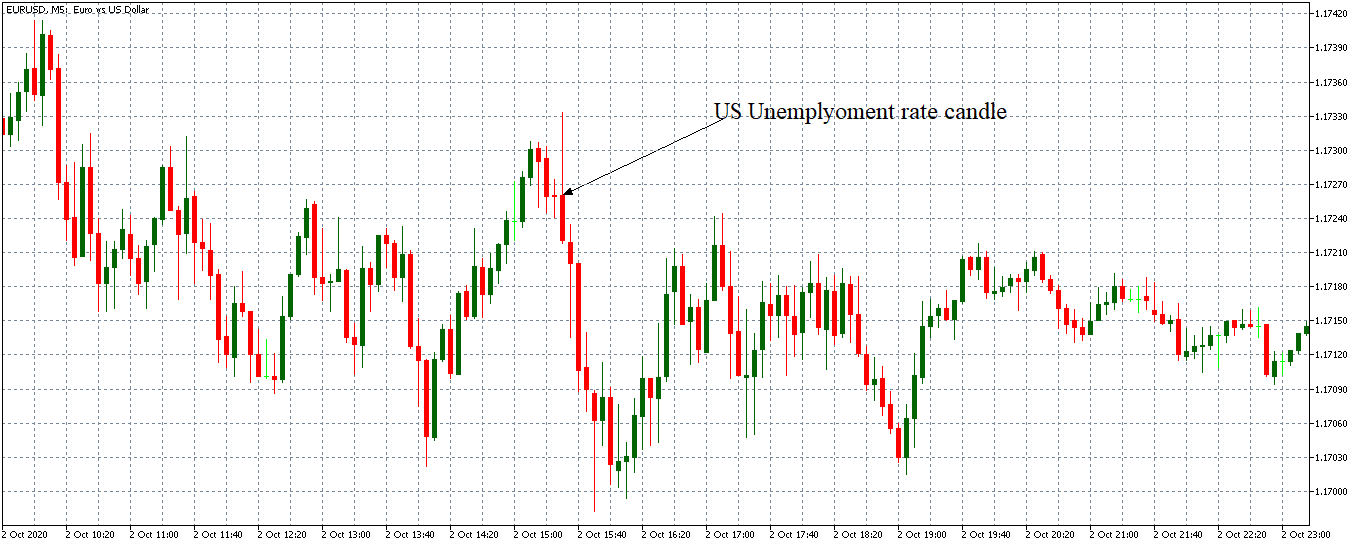
Usually, when high-impact economic indicators are released, they are followed by extreme market volatility. The US unemployment rate is a high-impact indicator. Its latest release on October 2, 2020, at 8.30 AM EST came in positive at 7.9% lower than the expected 8.2%.

In this case, you’d expect the USD to be stronger than the EUR. But immediately after the news was released, there was some volatility that made the pair gain 11 pips before adopting a bearish trend.

Eleven pips may not sound like a lot. But if you have a small trading account and using high leverage, the chances are that 11 pips in the wrong direction can wipe you out.

Watch out for geopolitics

When trading the news as scheduled in the economic calendar, it pays to monitor geopolitical developments that are not scheduled, especially in the current climate of trade wars. Declarations by influential political figures may influence trends in the forex market. In such cases, if the news release of economic indicators coincides with such events, their impact may be watered down or exacerbated.

Another reason why trading the news may not go as planned is because the outcome of a news release could already be priced into the market. Forex traders are skillful at anticipating – especially when it comes to interest rate releases. If they anticipate that central banks are going to cut interest rates, they will adjust their trades weeks or months in advance. In this case, when the actual rates are released, their impact will not be as pronounced.

Bottom Line

We’re not saying you shouldn’t trade the news. Just take your time and familiarize yourself with the different types of economic indicators. Do thorough backtesting and have a trading plan on how you will incorporate news releases into your trading.

[wp_quiz id=”94056″]
Categories
Forex Market Analysis

AUDUSD Prepares for Employment Data Ahead

Market Overview

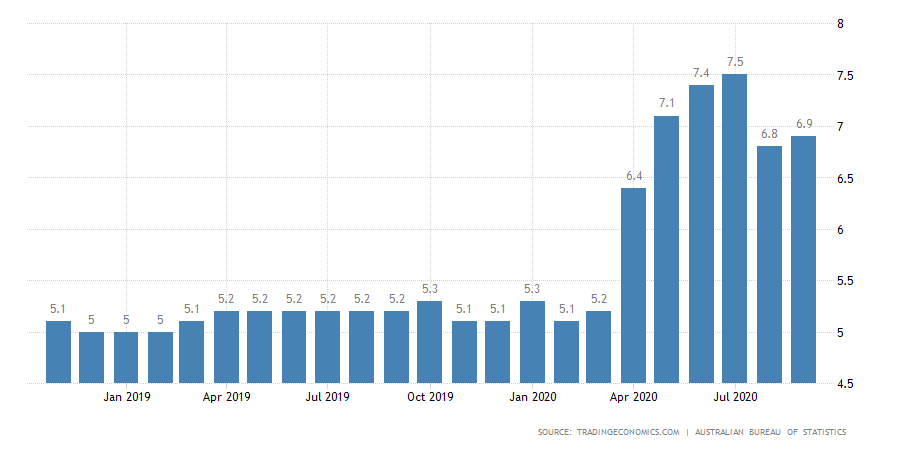
The AUDUSD pair during the overnight trading session will be driven by October’s employment data, to be released by the Australian Bureau of Statistics in a few hours. The analysts’ consensus expects an increase of 7.1% in the unemployment rate (YoY), representing a deterioration in the labor market conditions and a rise over the 6.9% reported in September.

The unemployment rate jumped from 5.1% in January to 7.5% in August during the current year. In this context, the Governor of the Reserve Bank of Australia (RBA), Philip Lowe, confirmed the change in the focus from inflation rate to labor market conditions, which according to Governor Lowe, would face “an extended period of higher unemployment than we have become used to.”

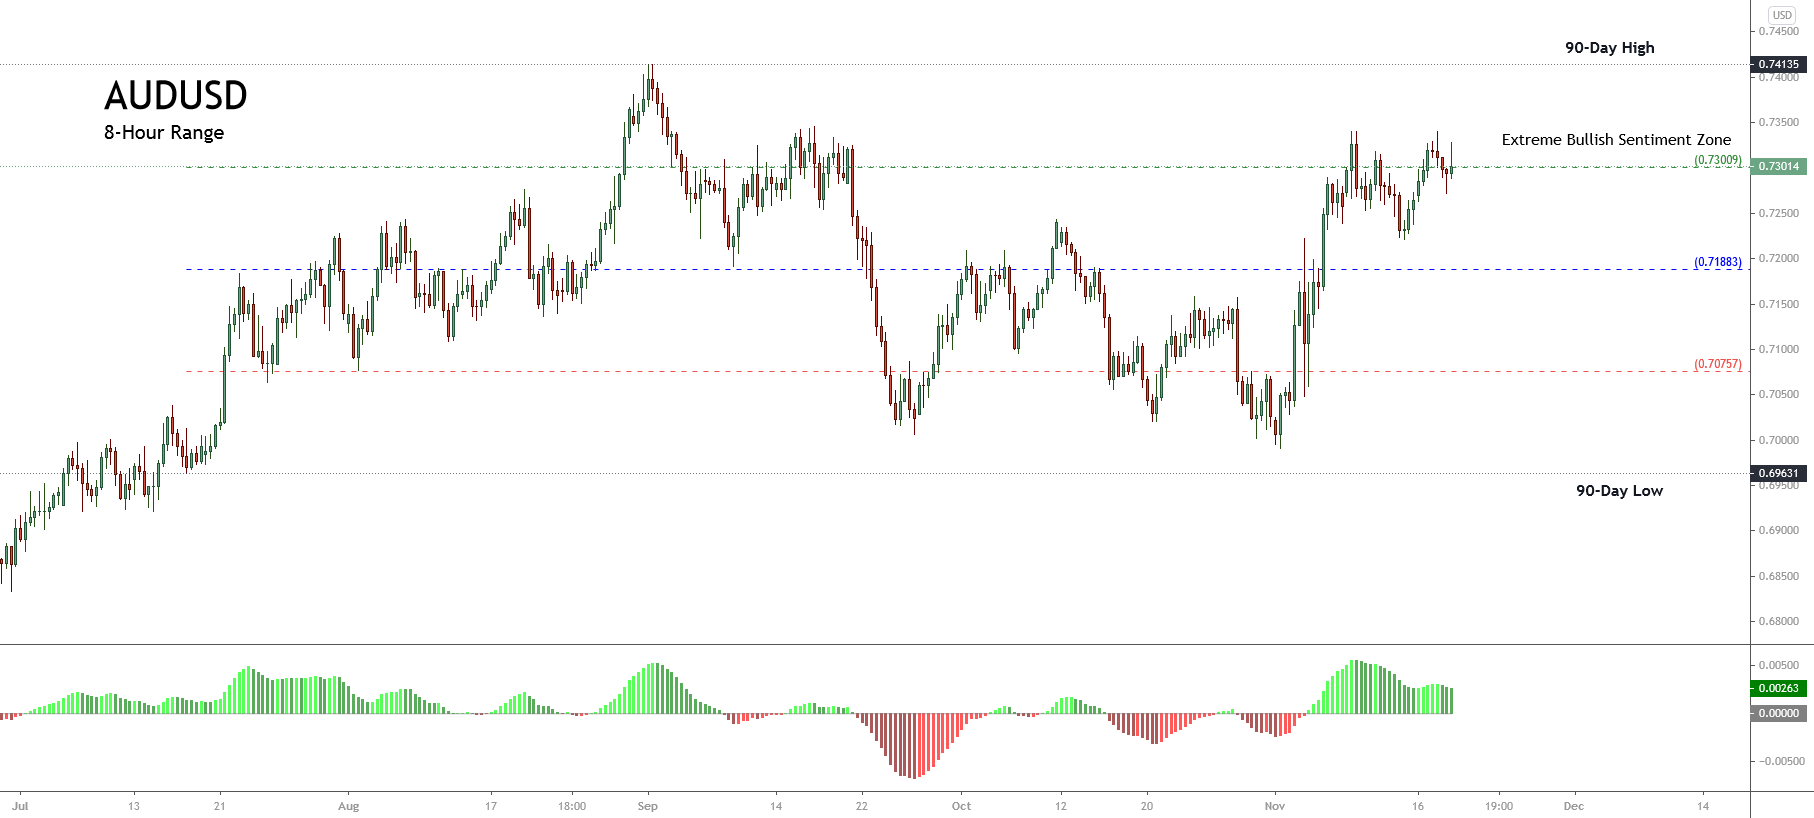
On the other hand, the next 8-hour chart illustrates the market participants’ sentiment unveiled by the 90-day high and low range, where the price action looks testing the extreme bullish sentiment zone support located at 0.73009.

Likewise, the Aussie advances in a sideways movement. We can see that, after reaching its yearly high at 0.74135, the Aussie was dragged toward the extreme bearish sentiment zone, where the Australian currency bounced back to the extreme bullish sentiment.

Currently, the re-test of the recent intraday high at 0.7335 leads us to expect further upsides in the following sessions, likely to head to its early September highs at 0.7400.

Short-term Technical Outlook

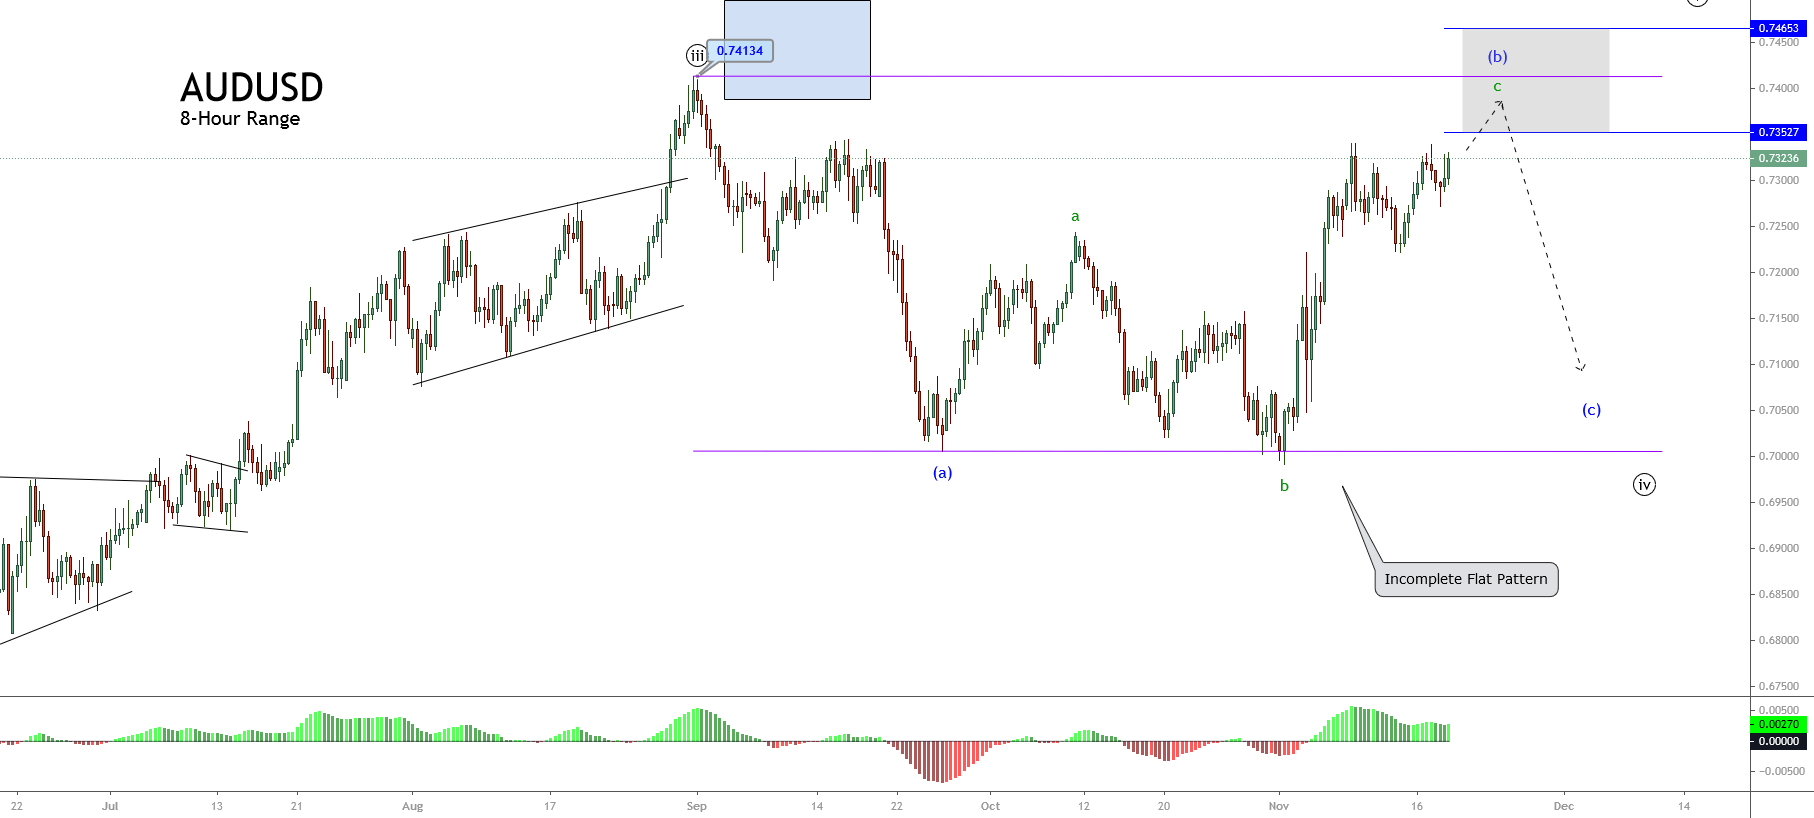
The short-term Elliott Wave view exposed in the next 8-hour chart reveals the sideways advance in an incomplete flat pattern of Minuette degree identified in blue, which, according to the Elliott Wave theory, follows an internal sequence subdivided into 3-3-5. This corrective pattern in progress belongs to the fourth wave of Minute degree labeled in black.

The previous figure shows the current wave (b) in blue, which began on September 25th on 0.70059. The end of wave b of Subminuette degree identified in green pierced the origin of wave a. That leads us to consider the possibility that the current corrective formation could correspond to an expanded flat pattern

Finally, the current incomplete movement corresponding to wave c in green could advance to the potential target area between 0.7352 and 0.7465. If the price action doesn’t surpass the level 0.7352, then the price could test the sideways channel’s previous lows. 

The alternative scenario is if the price breaks above the 0.74134 level, climbing until 0.7465. Thar means the bullish pressure is strong. In that case, the next decline corresponding to wave c in blue will likely be weaker, ending in a region under 0.71, but no further than 0.70.

Categories
Forex Fundamental Analysis

Impact of ‘Employment Rate’ Economic Indicator On The Forex Market

Introduction

Employment is crucial for consumer spending, which makes more than two-thirds of the GDP for many countries. Understanding the employment rate and the cascading effect it has on the economy is paramount for fundamental analysis. The factors affecting the employment rate and business cycle patterns all inherently impact economic growth and currency valuation. Hence, understanding employment as an economic indicator will strengthen our analysis.

What is Employment Rate?

Employment Rate:  It is defined as the ratio of employed to the total available labour force. Here the labour force is defined as the sum of employed and unemployed persons. It is also considered as a measure of the extent to which the labour force is being used.

Unemployment is a state where an individual is actively searching for employment but cannot find work.

Unemployment Rate: It is defined as the percentage of unemployed people to the available labour force. It is the other half of the employment rate. Employment and unemployment rate combined should yield results as 100% as it equals the total available labour force.

How can the Employment Rate numbers be used for analysis?

Employment and unemployment can be considered as the two sides of the same coin. We can derive our fundamental conclusions from either direction. Employment Rate is essential for our analysis because it has a direct and cascading impact on consumer spending. In the US, consumer spending accounts for about 70% of the total GDP.

A high employment rate indicates that more people in the labour force have income that they can spend on purchasing goods and services. When consumer spending is on the rise, businesses flourish, leading to better wages, or even more employment. Overall, employment in one sector has an indirect positive effect on dependent sectors and a direct positive effect on the economy.

The Government is also politically committed to ensuring a low unemployment rate; otherwise, citizens will not favour them in the next elections. By providing proper support to local businesses, the Government can increase employment in the short run.

A high unemployment rate is very damaging to the economy. As more people are unemployed, there is a direct negative effect on consumer spending. In this scenario, also the cascading effect works and makes the situation worse. It also hurts the employed people.

Increased unemployment in the economy can bring down the employed morale, making them feel guilty for being employed while their colleagues are unemployed. It can also make employed people feel less secured and discourage their spending habits, and they may end up saving for a rainy day. Employed people may feel lucky enough to have a job that inhibits them from applying for better opportunities amid high unemployment.

Employment and Unemployment rates can also help investors to keep a pulse on the health of the economy. Overall it is essential to make sure the employment rate is always high and does not take a dip. Even when the unemployment rate rises linearly, it has an exponential impact on economic growth, and hence the central authorities try to avoid it at all times.

It is also essential to understand that employment rates are sensitive to business cycles in the short run. Hence, seasonally adjusted versions of the same are more useful for analysis. In the long run, the employment rates are significantly affected by government policies on higher education and income support. Policies that focus on the employment of women and disadvantaged groups also help increase the employment rate.

Both developing and underdeveloped countries’ governments have to focus on education policies and employment opportunities for their labour force if economic growth is the primary concern. Literacy and higher education in underdeveloped and developing nations have helped the economies grow stronger year-on-year.

Employment rates are coincident indicators and can also be used to predict or confirm oncoming recessionary or recovery periods, if any. The onset of a recession is accompanied by a massive unemployment rate or decreased employment rates. Hence, despite the propaganda of the media and Government, we can use employment data actually to confirm whether the economy is growing or stagnating. Accordingly, during recovery periods, employment rates start on a recovery trajectory back to its previous normal.

Impact on Currency

As an increase in employment rate points towards a growing economy, a high employment rate is good for the GDP and the currency. Hence, the employment rate is a proportional coincident indicator. An increase or decrease in employment rate is suggestive of improving or deteriorating the economy, respectively.

The forex market watches the unemployment rate more closely than the employment rate itself. Significant changes in the employment rate or the unemployment rate tend to have a considerable impact on market volatility. Still, generally employment rate in itself is a low impact indicator compared to the unemployment rate.

Employment change, initial jobless claims also precede unemployment rates, and the desired effects are already factored into the market before the employment rates are released. Hence, overall it is a low impact indicator.

Economic Reports

In the United States, the BLS surveys and tracks monthly employment and unemployment within the country. It classifies them based on geography, sex, race, industry, etc. The Employment Situation report is also published by the BLS, and it goes as far back as the 1940s. It is released by BLS on the first Friday at 8:30 AM Eastern Standard Time every month.

Sources of Employment Rate

The US BLS publishes monthly employment and unemployment reports on its official website. We can also find the same indexes and statistics of various categories on the St. Louis FRED. We can also find employment rate statistics published by the OECD countries here. Consolidated reports of employment rates of most countries can also be found in Trading Economics.

How Employment Rate News Release Affects The Price Charts

As we have already established, an increase or decrease in the employment rate can be used to gauge whether the economy is performing well or poorly. For forex traders, it is therefore imperative to understand how the news release of this macroeconomic indicator will impact the price action on various currency pairs.

In the US, employment reports are released monthly, usually on the first Friday after the month ends. The latest, expected, and all historical figures are published on the Forex Factory website. We can find the most recent release here. Below is a screengrab of the US unemployment rate from the Forex Factory website. On the right, we can see a legend that indicates the level of impact the Fundamental Indicator has on the corresponding currency.

As shown, the unemployment rate is a high impact indicator. The snapshot below shows the change in the US unemployment rate as released on August 7, 2020, at 1230GMT. For July 2020, the unemployment rate declined from 11.1% to 10.2%, beating the 10.5% decline forecasted by analysts.

Now, let’s see how this news release made an impact on the Forex price charts.

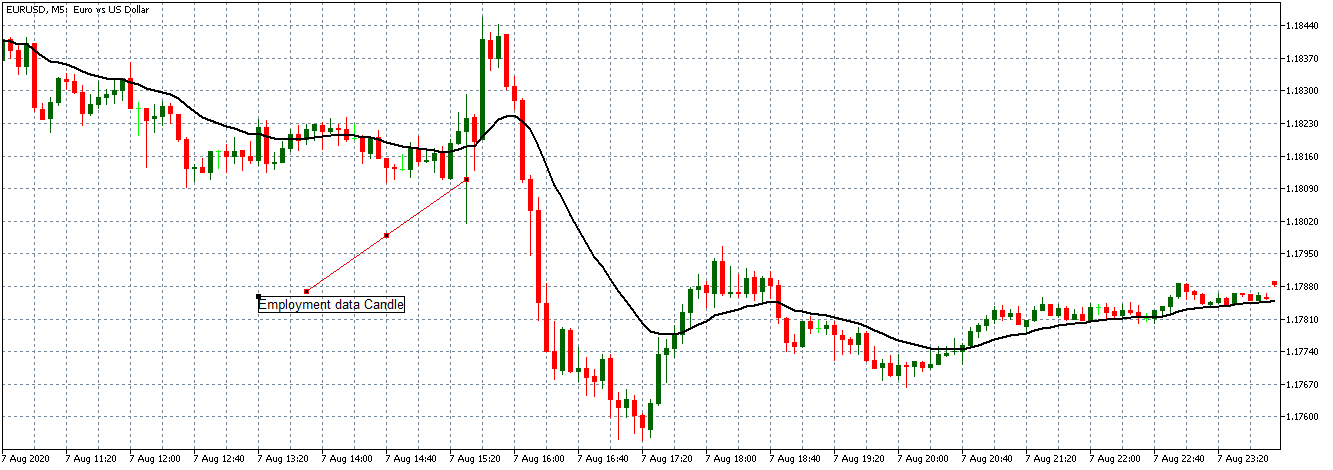
EUR/USD: Before Employment Data Release August 7, 2020, Just Before 1230GMT

The 30-minute EUR/USD chart above shows the market is on a downtrend from 0200 to 1200 GMT with the candles forming below the 20-period Moving Average. More so, the market was trading within a narrow price channel of between 1.1850 and 1.1810, indicating a calm market with traders waiting for the latest employment data to gauge the economic recovery.

EUR/USD: After Employment Data Release August 7, 2020, 1230GMT

As can be shown on the chart above, immediately after the news release, we can observe a sudden downward spike with a retraction. This spike indicates the market is having mixed reactions to the positive employment news hence the strong USD.

After the initial spike, the market can be seen to ‘absorb’ the positive news. The pair adopted a bearish outlook with the price breaking and staying below the earlier observed 1.1810 resistance level.

Since the pair had not shown any unexpected sudden swings before and after the new release, trading the news would have been profitable. For such a high impact economic indicator, it is advisable to open positions after the news release to avoid being caught on the losing end of the trend.

Now, let’s quickly see how this new release has impacted some of the other major Forex currency pairs.

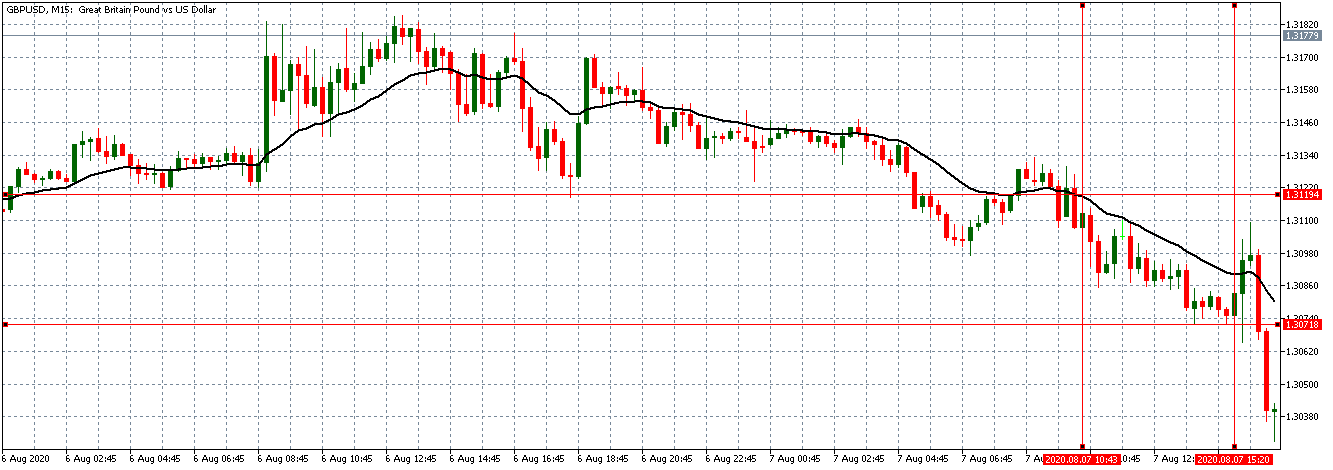
GBP/USD: Before Employment Data Release August 7, 2020, Just Before 1230GMT

GBP/USD: After Employment Data Release August 7, 2020, 1230GMT

The GBP/USD pair showed a similar trend as the one observed with EUR/USD. The pair can be seen to have traded within a narrow price channel of 1.3122 and 1.3071 from 0700 to 1200 GMT. After the economic data release, the pair similarly had a sudden spike. It later adopted the same bullish stand as the EUR/USD pair, with price breaking and trading below the observed resistance level.

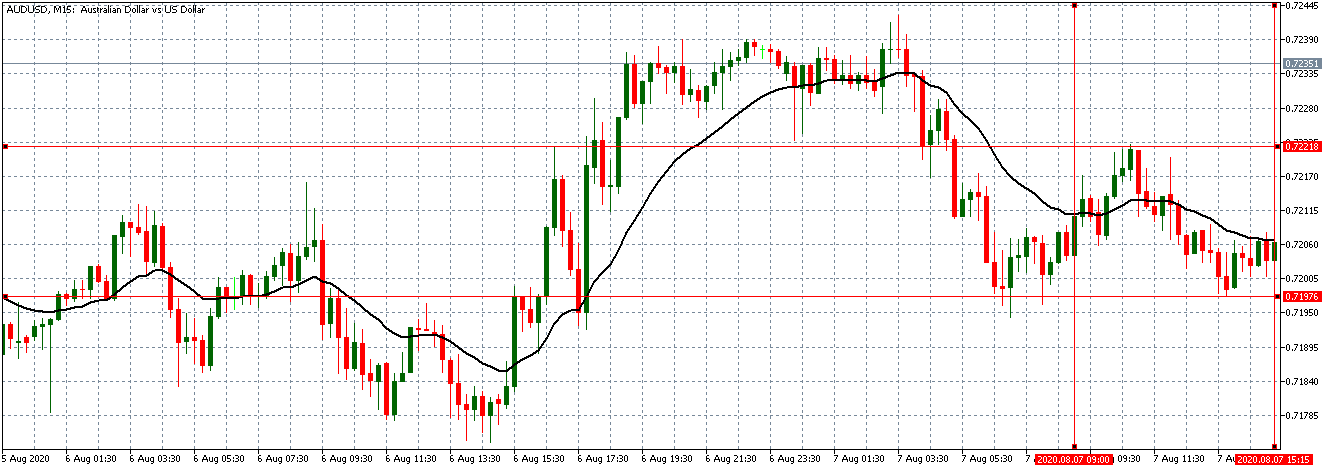
AUD/USD: Before Employment Data Release August 7, 2020, Just Before 1230GMT

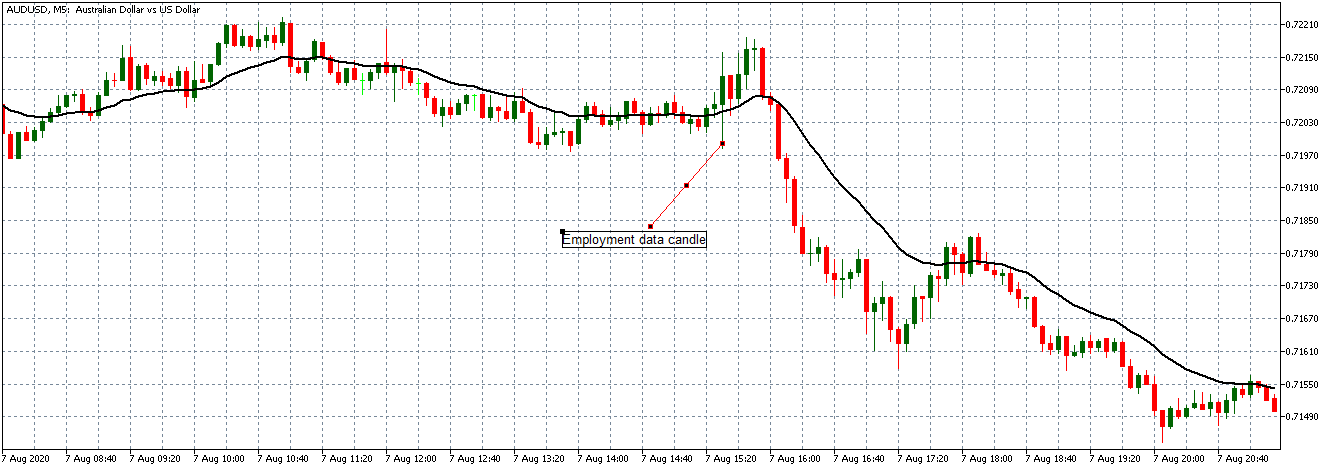
GBP/USD: After Employment Data Release August 7, 2020, 1230GMT

Similar to the EUR/USD and the GBP/USD pairs, the AUD/USD traded within a price channel of 0.7221 and 0.7196 and no unexpected spikes before the news release. After the news release, a sudden spike can be observed with an accompanying retraction, and later the pair adopted a bullish stance breaking below the observed resistance level.

From the above analysis, the subdued market volatility before the release of the employment data and the subsequent volatility, it is evident that the employment rate is high impact indicator anticipated by forex traders.

Categories
Forex Fundamental Analysis

The Impact of ‘Youth Unemployment Rate’ News Release On The Forex Price Charts

Introduction

Youth unemployment is toxic to economic growth. It has long and short-term impacts on the economy that are concerning. With economies struggling to achieve growth and being vulnerable to the economic crisis, youth unemployment has become a more significant threat to growth than ever. Understanding the root causes and possible solutions to youth unemployment can help secure our future economic growth.

What is Youth Unemployment Rate?

Youth Unemployment Rate is the percentage share of the young labor force that is jobless. While the upper and lower limit of age categorizing youth varies across regions, the United Nations categorize people between the age of 15-24. Some countries extend the upper limit to the mid-thirties also.

Youth unemployment is a situation where young people who are actively seeking, willing, and able to work are unable to find a job. Youth unemployment rates generally tend to be higher than the adult rates in all countries across the world. Youth makes up roughly 17% of the world population, and more than 85% of them live in developing countries.

How can the Youth Unemployment Rate date be used for analysis?

Youth Unemployment is caused by many factors, the primary among them being:

Skill Gap

The first and primary root cause of youth unemployment is the gap between the traditional education system and current market skill requirements. The current knowledge acquired through graduation, or any degree is not tailored to the disruptive technological society. With technologies changing so rapidly, the education systems should also be updated to take these changing times into account and provide relevant knowledge.

Employment Regulations

With so many laws protecting employees through labor acts and minimum wage policies, companies are pickier in hiring. Also, companies do not want to invest their earnings into new youth training for months and then reap benefits. Hence, companies are offering part-time jobs or contract hiring work that youth has no choice but to take. During economic downturns, employment protection plans protect employees and leave the contract workers vulnerable. Hence, during economic downturns and downsizing, youths are the first to be laid off.

Public Assistance

Many countries provide income support and assistance initiatives to youth until economic conditions improve. While such programs are good or bad for the youth remains debatable, some say it creates dependence on such programs. Keeping the youth unemployed even longer through such programs will further throw them off the career track.

The effects of youth unemployment are worse than we imagine them to be!
Lost Generation

Unemployed youth are often referred to as the lost generation. They are called so not only for the productivity lost but also for the direct and indirect impact it has on the youth and their families. As the saying goes, “a good start is half-race won,” similarly, a lousy start is also half-race lost. Youth unemployment has said to affect earnings for twenty years.

The hierarchical structure of corporations and late employment of youth puts them on the back seat in the career race, making it very hard for them to catch up with their peers in terms of earnings, position, and skill. Since they have not been able to build up their knowledge and skill during the period of unemployment, there is a substantial decrease in lifetime earnings.

Mental Risk

If a job is hard to find for youth, they often lower their job requirements. More often, they compromise and do jobs that they do not like, and it has an impact on their happiness, job satisfaction, and mental health. It is also reported that unemployed youth are more isolated from the community.

Political unrest

In modern times, political tensions and anti-social behaviors have been attributed to long periods of youth unemployment. The youth who do not have any productive work to engage in are succumbing to such anti-social activities and hooliganisms more, lately.

Increased Public Spending

As more and more youth remain unemployed, benefits payment increase to accommodate the youth. Hence, more of the tax revenues are spent on providing support. Decreased spending inhibits the government from allocating funds where it is needed to assist economic growth.

Decreased Innovation

As youth remains unemployed, the divergent and out-of-box ideas are missed out in the companies. Youth brings energy, dynamism, fresh perspectives onto the table with each passing generation. As innovation decreases, companies die out, thus affecting the economy in the long-run.

Incarceration

An idle mind is the devil’s workshop. If more youth remains unemployed, vulnerability to incarcerating activities increases, youth suicides also rise when unemployment is rampant in youth.

Impact on Currency

The Youth unemployment rate is an economic factor that affects the long-term progress of the economy more severely than the short-term. As seen, it has multi-layered negative impacts in terms of earnings on the youth and also on their families.

For the currency markets, the unemployment rate factors in the youth unemployment rate. Hence, youth unemployment is a low-impact coincident indicator that is more useful for the central authorities to make policy-based decisions.

Economic Reports

In the United States, the Bureau of Labor Statistics (BLS) publishes employment and unemployment statistics in their employment situation report every month. The report classifies it further based on age, sex, industry, etc. It is released on the first Friday at 8:30 AM Eastern Standard Time.

Sources of Youth Unemployment Rate

The United States Bureau of Labor Statistics publishes monthly employment and unemployment reports on its official website. Youth unemployment monthly and annual reports are available. The Organization for Economic Cooperation and Development (OECD) also maintains youth unemployment data on its official website.

Consolidated reports of youth unemployment rates across the world can be found in Trading Economics. World Bank also maintains records of Youth Unemployment Rates.

Youth Unemployment Rate – Impact Due To News Release

Youth Unemployment refers to unemployed persons looking for a job but cannot find the age range defined by the United Nations. This age group currently stands between 15-24 years. Youth unemployment rates tend to higher than the adult rates in almost every country. Forex traders look at general unemployment figures, which are the sum of unemployed persons across all ages and take a currency position based on the numbers. They do not consider the individual components of unemployment data as it does not provide a complete picture.

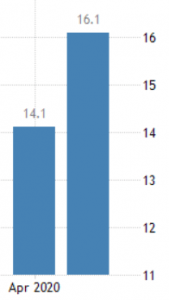
We will be analyzing be the latest youth unemployment figures of Australia and witness the change in volatility due to the news release. Looking at the below graph, we can say that youth unemployment increased in May by 2% compared to April. Even though the data is not very encouraging, let us determine the market’s reaction to this data.

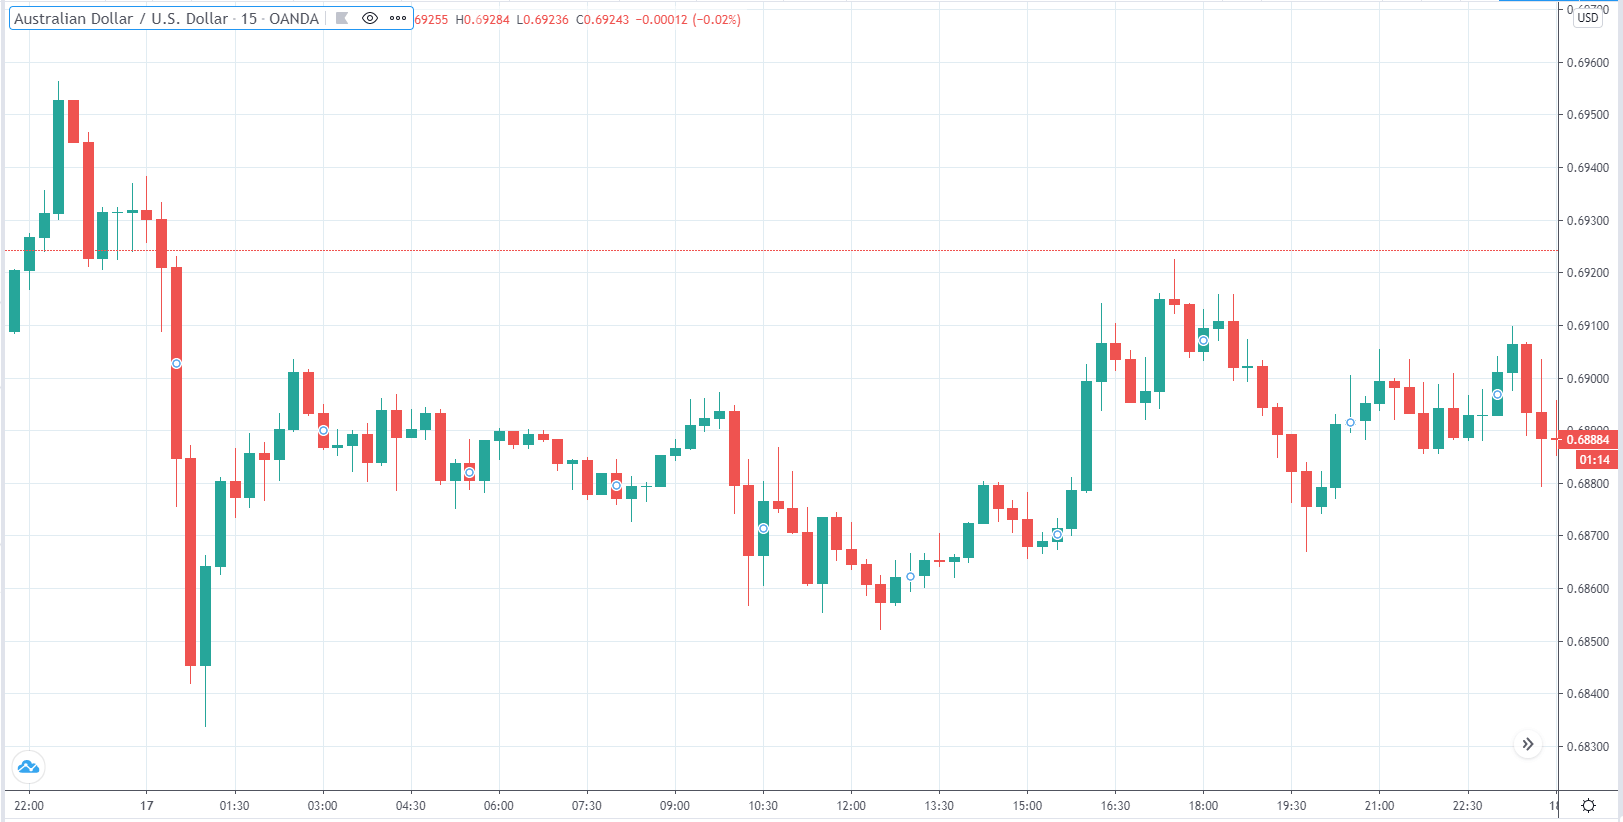
AUD/USD | Before The Announcement

The above image shows the 15-minute timeframe AUD/USD chart before June 18, 2020. No trends have been established and shows no significant volatility.

AUD/USD | After The Announcement

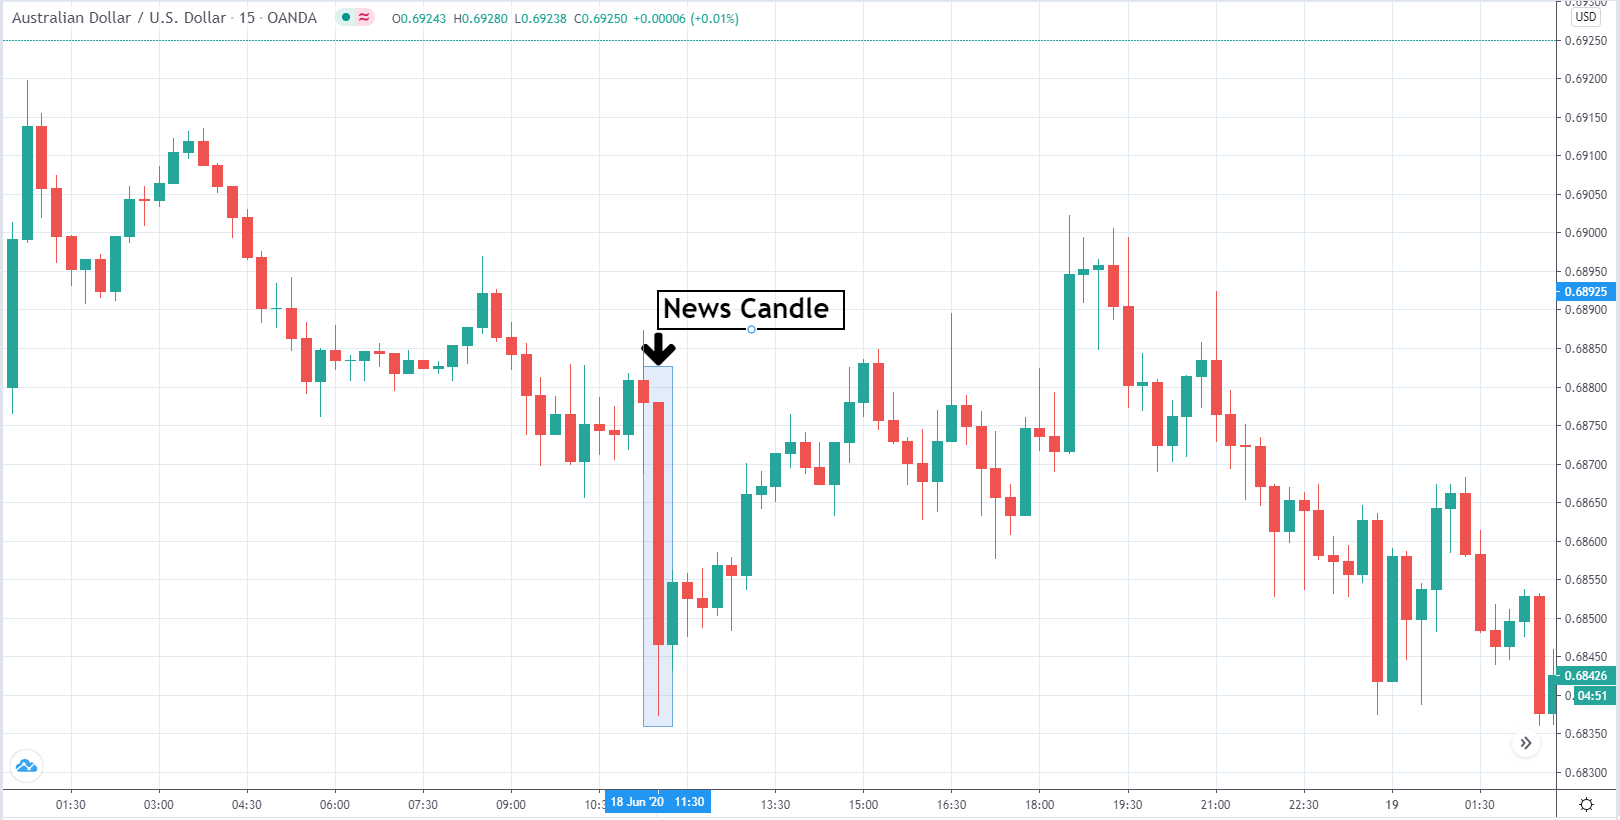
The above image shows the highlighted candle that represents the news announcement. As the youth unemployment rate came in unfavorable to AUD, there is a significant bearish movement in the pair. The bearish move has happened because of the simultaneous release of the employment change and aggregate unemployment rate reports alongside.  Both the reports underperformed, driving the AUD value further down. The unemployment rate is a high impact indicator and has magnified the effects of youth unemployment figures.

AUD/EUR | Before The Announcement

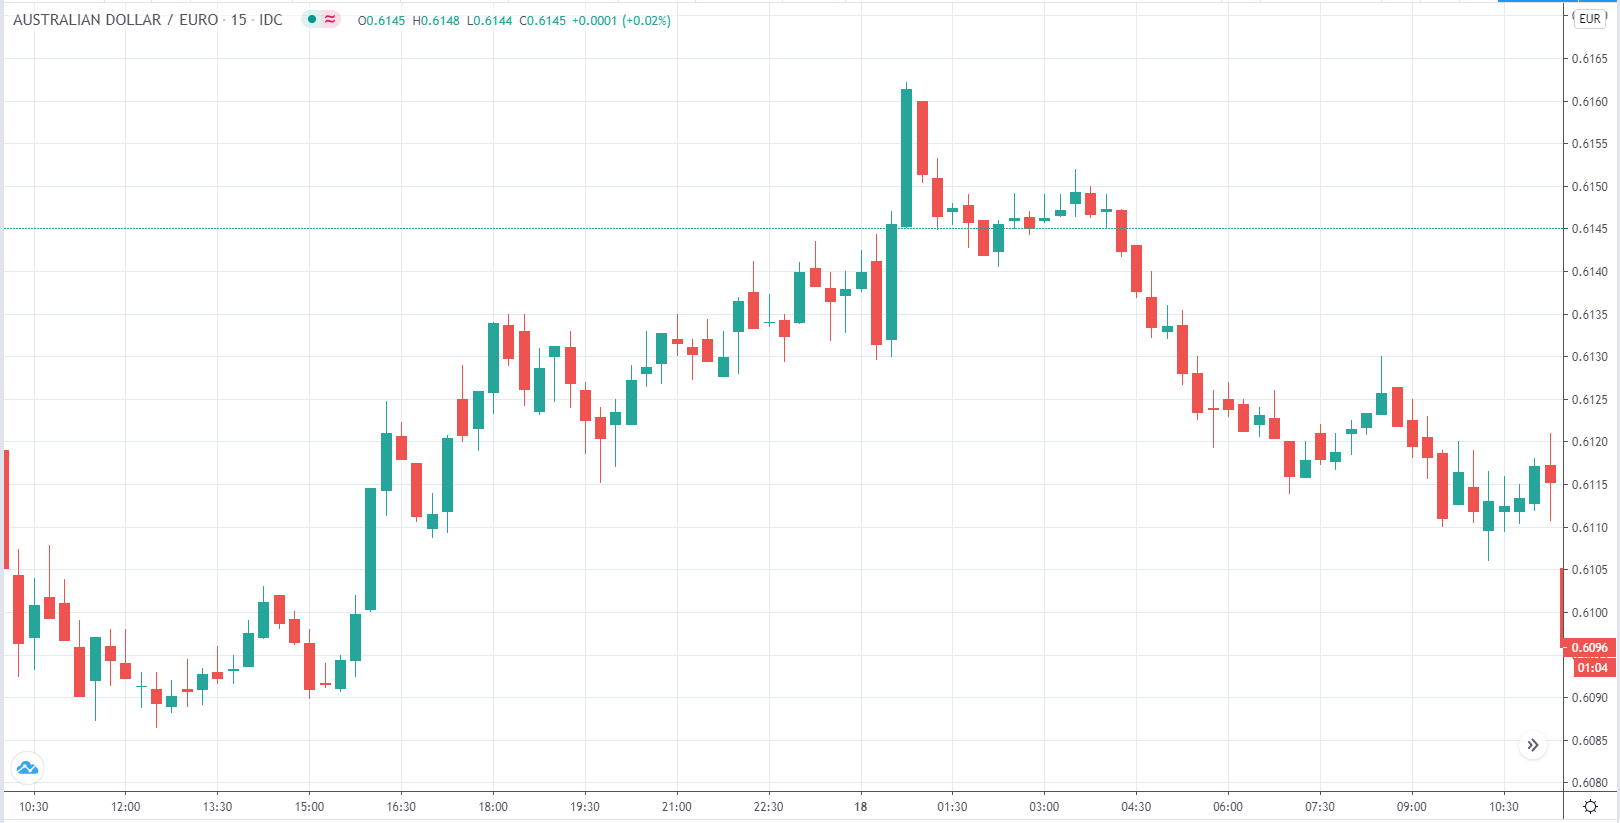
The above image shows the 15-minute timeframe of AUD/EUR pair where AUD gained momentum till June 18 but only to fall back to its previous normal by 11:00 AM.

AUD/EUR | After The Announcement

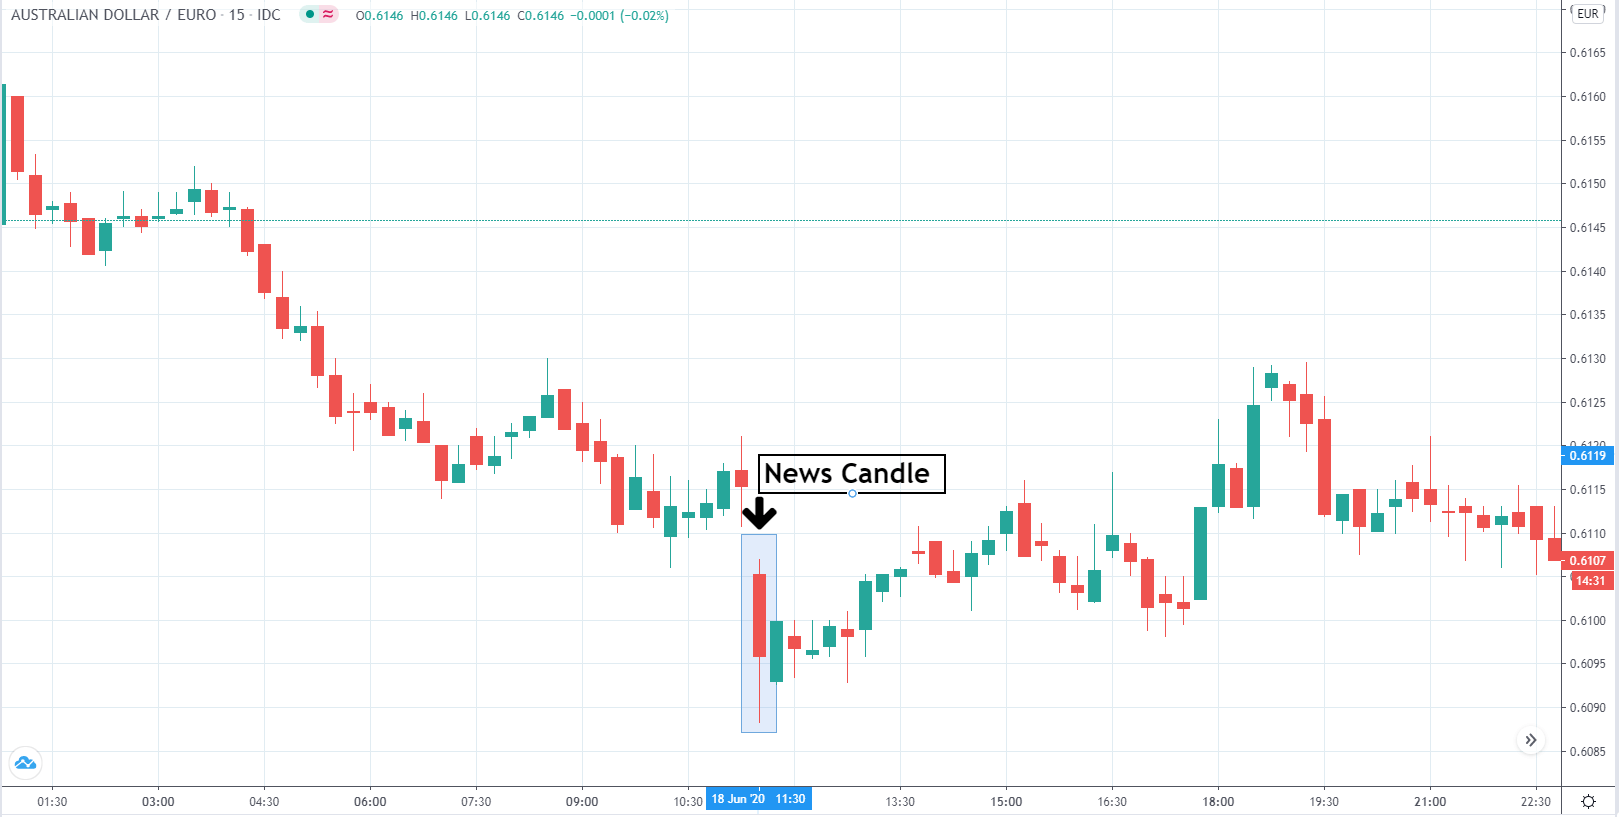
The above image highlights the news candle, where we can see the biggest bear candle with the longest down wick throughout the range. The bearish pressures from unemployment rates and employment change have helped put the selling pressure on AUD against EUR.

AUD/JPY | Before The Announcement

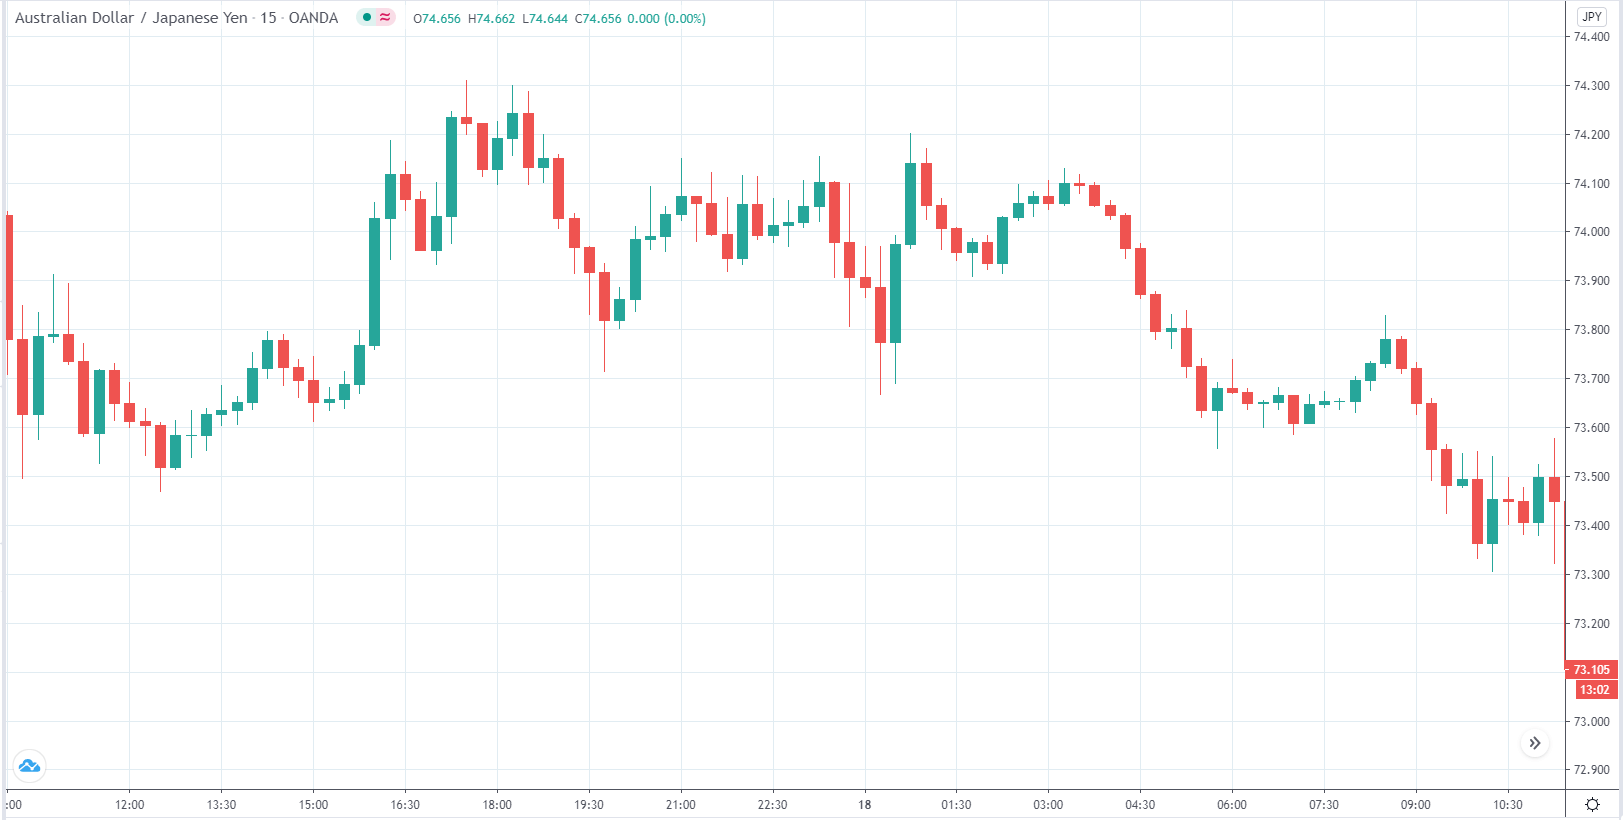
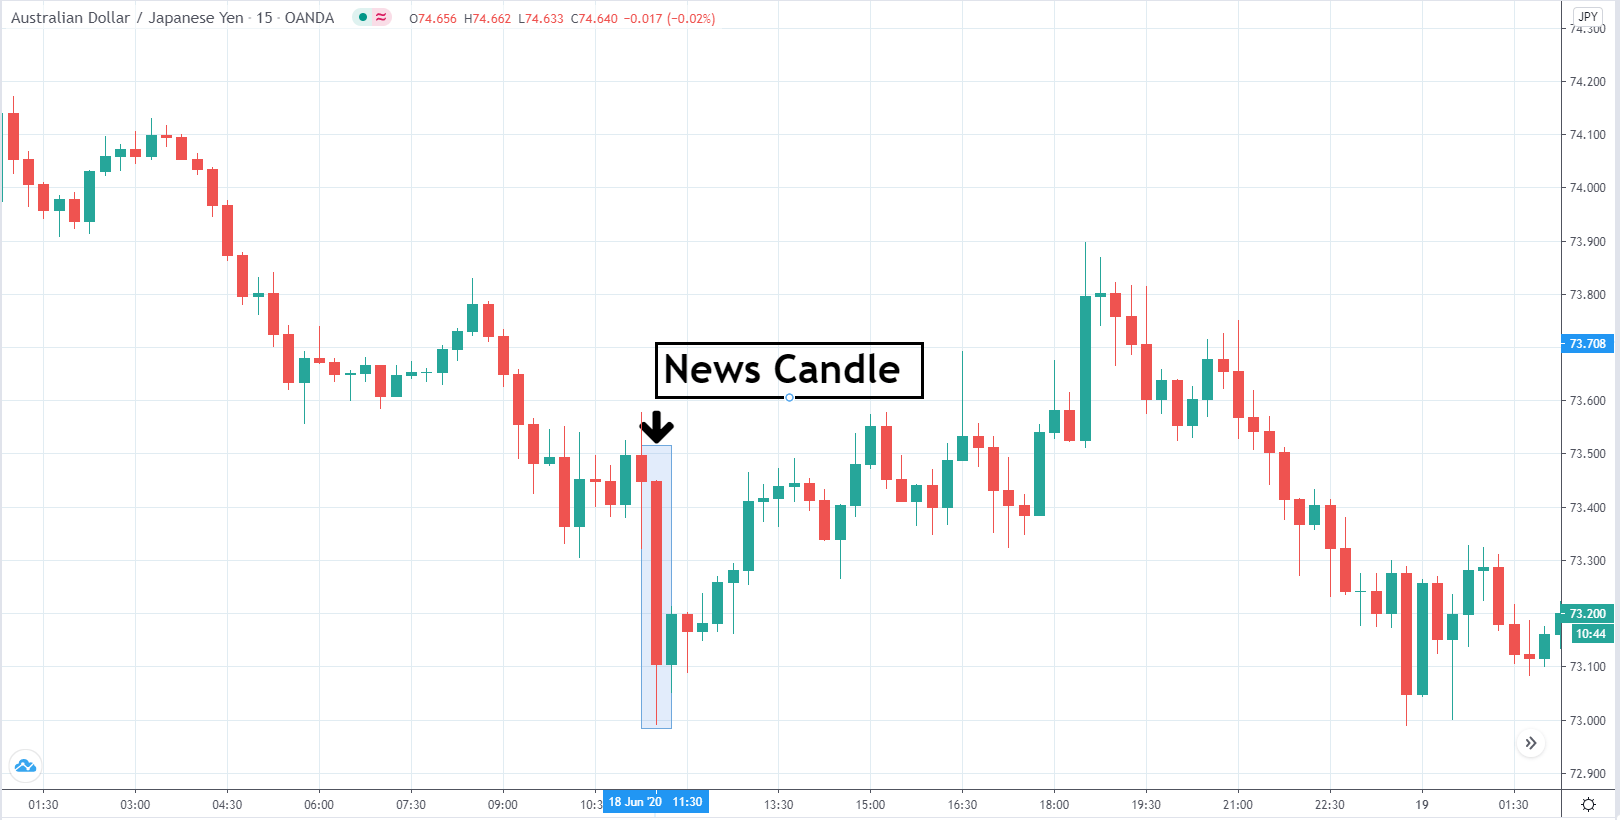
The above image is a 15-minute timeframe AUD/JPY chart. No potential trends have started till 11:00 AM of June 18, 2020.

AUD/JPY | After The Announcement

The above image highlights the news candle showing the combined effect of the youth unemployment rate, unemployment rate, and employment change. All three reports did not favor AUD, leading in the biggest bear candle with a long wick showing high sell pressure on AUD against JPY.

Final Words

The charts could be very misleading for novice traders to make them think that the youth unemployment rate has induced such volatility. Unemployment rates and employment changes are closely watched statistics and major indicators. It is essential to understand that all the volatility for AUD against major currencies was induced through the two major indicators and not the youth-unemployment rate.

Even if the youth-unemployment rate had come in favor of AUD, it would have been overshadowed by the bearish sentiment induced from unemployment rates and employment change reports. Hence, the youth unemployment rate is a low-impact indicator that is overlooked for the broader indicators, as mentioned.

Categories
Forex Videos

Forex Fundamentals! How Unemployment Rate Affects The Market!

How Unemployment Rate Affects the FOREX Market


Though many have heard of the unemployment rate, only a few actually know how it all works and why it’s important for forex and currency traders to know all about it. The unemployment rate is incredibly important, as it reveals the current state of a nation’s economy.

What Is the Unemployment Rate?

The unemployment rate represents the percentage of people without a job in a given country’s workforce. The people accounted for here are still willing as well as able to work at a job, even though they are unable to find employment.
The unemployment rate a lagging indicator when it comes to the economy, meaning that it changes after the economic state of a given country has already changed. However, the unemployment rate doesn’t have to be a lagging indicator when translated to the FOREX markets. News and reports of a change in the unemployment rate could cause market volatility as it indicates the state of the economy.

Unemployment Rates and the Forex Market

The unemployment rate of a country shouldn’t be ignored by the traders. There are two common examples of how the unemployment rate can be looked at and what it means for the currency prices.

Rate is higher than predicted

If the unemployment rate comes out to be higher than the predictions, the government will have to stimulate the depressed economy by creating new jobs. Let’s use the US as an example. In this case, the Federal Reserve will have to lower the federal funds rate. If this fails in stimulating the economy, then the Federal Government will have to employ fiscal policy measures, such as hiring people for public works projects or stimulating demand with unemployment benefits.
When the unemployment rate rises, it negatively impacts the USD, most likely triggering a bearish turn.

Rate is lower than predicted

When the unemployment rate is lower than expected, the economy will encounter more workers that earn income as well as more consumption expenditure. This could lead to inflation, causing interest rates to rise. A drop in the unemployment rate is a positive occurrence for both the economy and the FOREX market, as the currency will most likely increase in value.

Categories
Forex Fundamental Analysis

‘Initial Jobless Claims’ – What Should You Know About This Fundamental Indicator?

Introduction

The Initial Jobless Claims is a weekly statistics released by the United States department of labor. Unlike most other indicators that are released monthly, this report has an additional advantage. Because the Initial Jobless Claims report predicts the unemployment two to three weeks ahead compared to the employment report that is released monthly.

What is the Initial Jobless Claims report?

Jobless claims report comes directly from the United States department of labor, AKA. DOL. The department of labor is an executive branch of the United States Federal government and is mainly responsible for monitoring and promoting employment, employee welfare, improving employee wages, and helping them to claim their employment benefits. To do so, it enforces the main Federal laws and regulations.

The United state has a provision for providing insurance for those who are unemployed. In the year 1935, this policy came into implementation. Although it does not mean that every unemployed person is eligible, it has certain criteria. Insurance is provided to the people who have worked for a certain period and have recently lost their job due to factors that do not directly involve them.

For example, seasonal layoffs or business closure, the unemployment compensation insurance is applicable. The payment of compensations is for about 20-26 weeks, which may vary from state to state. The amount is usually a percentage of their most recent average wage for the year.

The initial jobless claim is different from them continued jobless claims. This report only shows the number of people who have applied for the unemployment benefit for the first time during the last week. In this regard, it becomes slightly more important than the continued jobless claim as it indicates the increase or decrease in the unemployment rate within the country.

How is the Initial Jobless Claims calculated?

The Initial Jobless Claims is prepared by the department of labor, which receives this data from state unemployment offices, which intern receive them from the local unemployment offices. The department of labor releases this report at 8:30 a.m. Eastern Standard Time.

Although many citizens apply for the benefit, it necessarily does not represent all the eligible people. Because, it is just a claiming, which will be either considered valid or invalid by the respective departments later.

Is the Initial Jobless Claims important?

When trying to assess the importance of the Initial Jobless Claims report as an economic indicator, there are many things we need to keep in mind.

The report does not cover the entire population. Not all people who are eligible for benefits apply for the same. Many people who are not eligible for the benefits will also apply. Also, the report is very volatile from week to week and is also a function of seasonality.  Hence, A four week moving average of the Initial Jobless Claims report irons out this volatility.

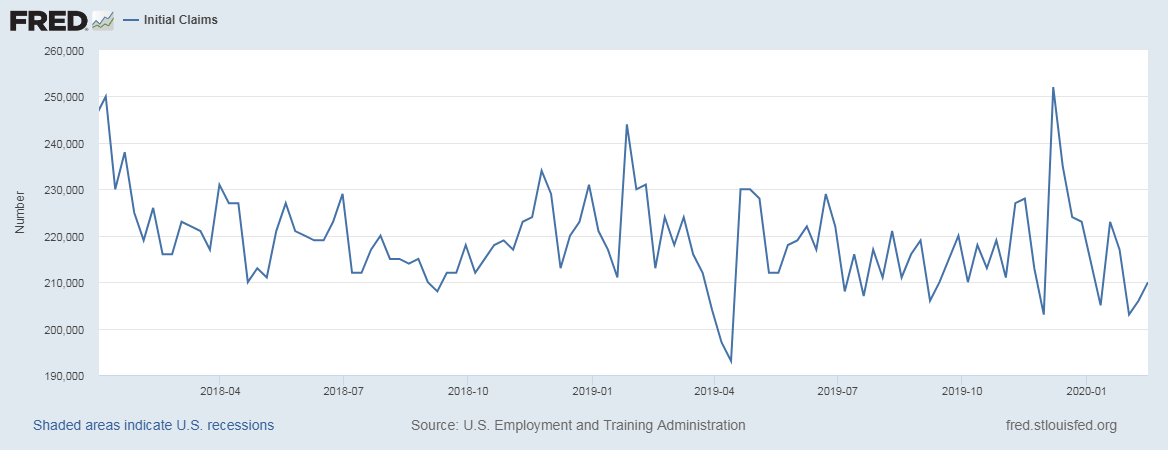
Below is a snapshot of the initial jobless claim report for the period of January- 2018 to February-2020. As we discussed, the numbers are very volatile, which makes it one of the ‘not-so-easy to decode’ economic indicators.

An increase in the Initial Jobless Claims report numbers relative to the previous numbers tells that more people have lost a job in the recent time. This has been historically associated with times of GDP contraction and economic stagnation. In other words, it indicates the beginning of an upcoming recession. A conversely significant decrease in the report occurs when the economy is coming out of recession and progressing towards economic growth (GDP expansion).

How can the Initial Jobless Claims Report be Used for Analysis?

The Initial Jobless Claims can act as abridge towards assessing the unemployment rate or the employment situation report (which are released monthly). The frequency of the report is the main advantage in comparison to other indicators. Because it allows interested people to get the most current economic situation. As mentioned, it can give us an idea about economic health two to three weeks before the employment reports that are released monthly.

Some Forex traders who are looking to buy or sell the US dollar can use this report for the most recent data in this regard. Higher the number, lesser is the confidence in the economy’s strength and vice versa. But in general, this is a minor indicator in comparison to the monthly reports, which are complete, thorough, and consistently reliable as they cover a greater section of the nation’s population.

Overall the Initial Jobless Claims report is a cruder and rudimentary indicator and is not robust or consistent at all times. But to some extent, it can reflect the direction in which the economy is heading. It may not be easy for us to know the minor movements in the economy accurately, but major movements get definitely reflected. In such cases, the Initial Jobless Claims report can also act as one of the main leading indicators to predict any oncoming recession or expansion of the economy.

Sources of Initial Jobless Claims Reports

The United States Department of Labor releases the Initial Jobless Claims report weekly on their official website in the ‘news releases’ section. Reference link – Initial Unemployment Insurance Claims

You can also find the same indexes diversified and other related categories like Continued claims etc. on the St. Louis website.

Impact of the ‘Initial Jobless Claims’ news release on the price charts 

After understanding the definition and significance of Initial Jobless Claims as an economic indicator, we are ready to find out the impact of the same on the currency. As we know that Initial Jobless Claims measures the number of individuals who filed for unemployment insurance for the first time during the week, and the impact is said to vary from week to week. A higher than expected reading is considered to be negative for the currency while a lower than expected data is taken as positive. The data has a moderate to high impact on a currency that causes a fair amount of volatility in the pair.

The below image shows the previous, forecasted and actual number of people who filed for unemployment insurance for the third week of March. We can see that the Jobless Claims were much higher than before with a rise in 70K people. From prerequisite knowledge, this should be extremely negative for the economy and hence the currency, but let us examine the reaction of the market.

USD/JPY | Before The Announcement

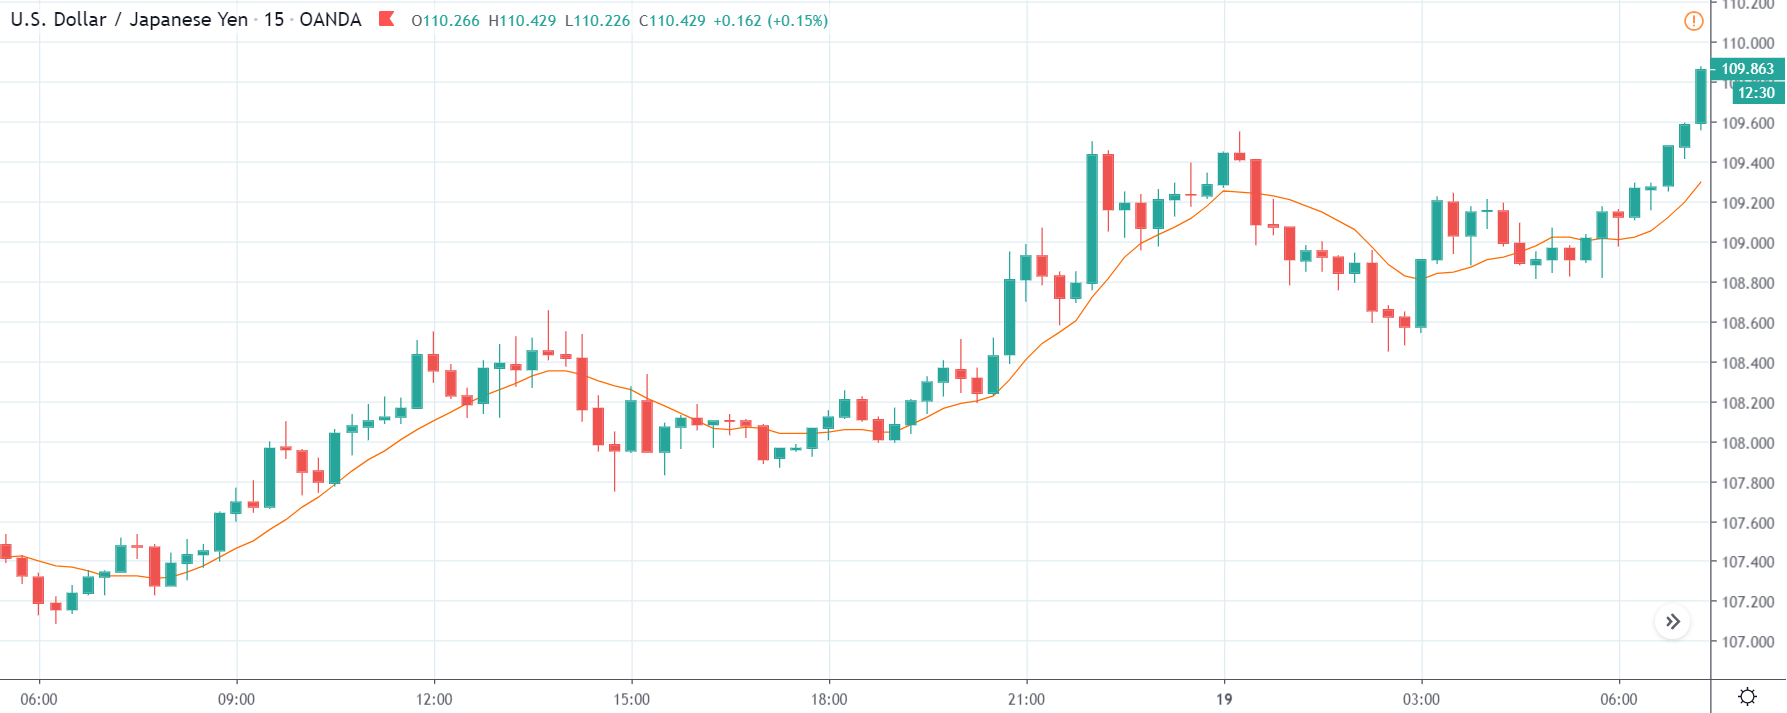
We start our analysis with the USD/JPY currency pair, where we notice a strong uptrend, which a result of excessive buying interest of US dollars. The strength in the US dollar could be due to another fundamental factor that is driving the currency higher. Technical analysis tells that when the market is trending strongly in one direction, we need to wait for a retracement to join the trend or wait for market reversal patterns. Hence, before the news announcement, we do not find any suitable way to position ourselves in the market.

USD/JPY | After The Announcement

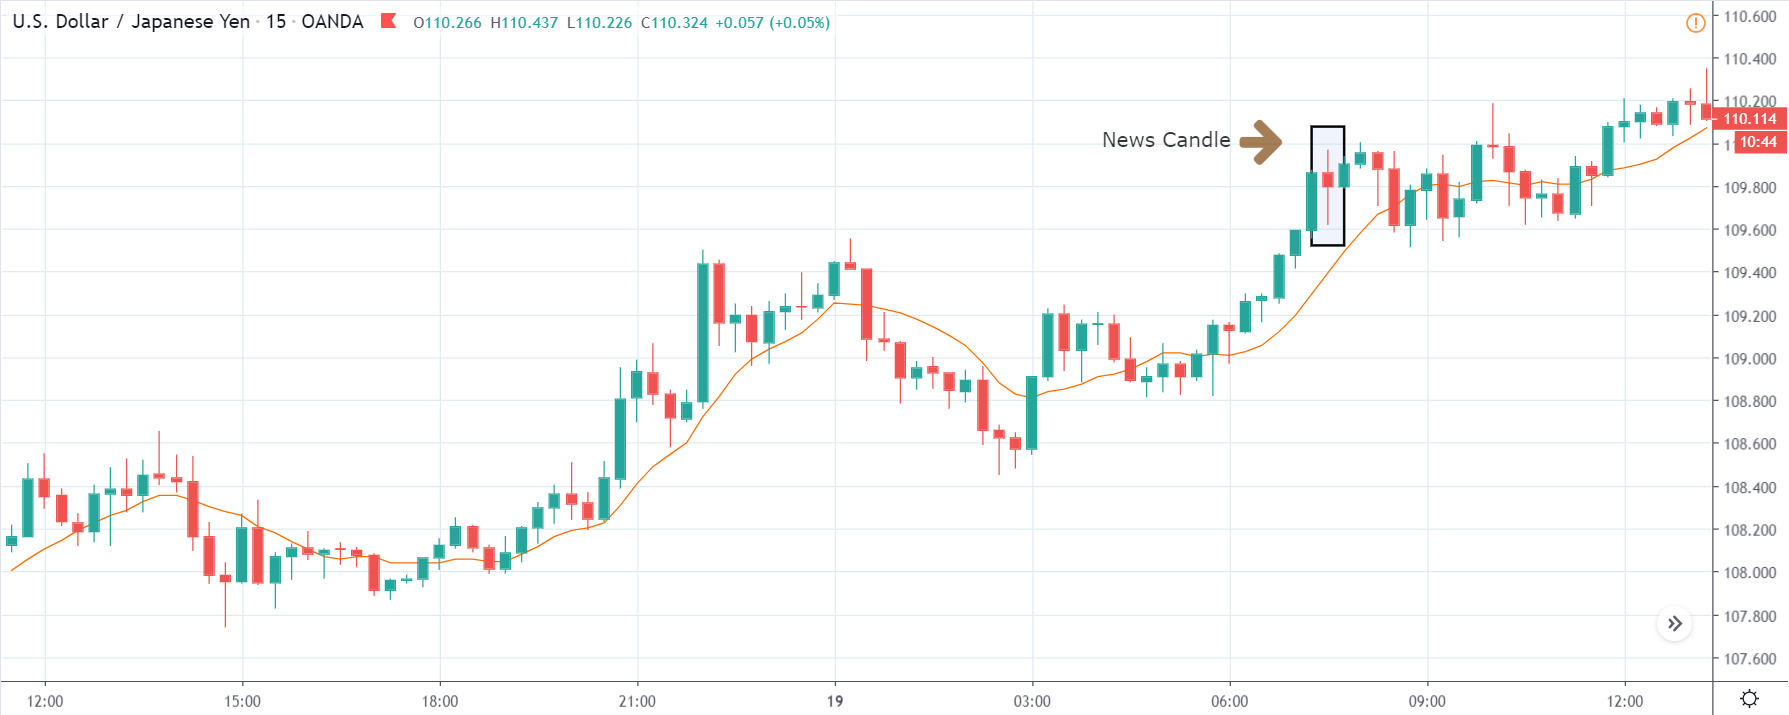
After the Initial Jobless Claims are announced, volatility increases on both sides but finally closes in the form of ‘Doji’ candlestick pattern. Even though the data was very bad, it was bad enough to cause a reversal in the market. After looking at the market reaction, we can say that the data created confusion among traders as the market consolidates after the news release. Since the Unemployment data did not cause the price to break key levels of support and resistance, the uptrend is still intact. Therefore, one can enter for a ‘buy’ after an indication from an important technical indicator.

GBP/USD | Before The Announcement

GBP/USD | After The Announcement

The above images represent the GBP/USD currency pair, where we witness a strong downward move on the previous day before the news release. After the big move, market moves in a range, and just before the announcement, the price is at the ‘support’ area. This means traders who are optimistic about the Unemployment data can position themselves on the ‘long’ side with a strict stop-loss below the support.

After the news announcement, we hardly notice a change in volatility, and the candle again forms an indecisive pattern. Since the Jobless Claims data did not cause any drastic change in volatility, traders can enter for new ‘long’ positions or hold on their existing ones and should compulsorily exit at the nearest resistance.

GBP/USD | Before The Announcement

GBP/USD | After The Announcement

The GBP/USD currency pair shows similar characteristics as that of the USD/JPY pair, where before the news announcement, the market is in a strong uptrend. In such market scenarios, we essentially cannot position ourselves on any side of the market as we don’t have any technical factors supporting our trade. Therefore, it is wise to wait for the news release and then act based on the data.

After the Initial Jobless Claims numbers were announced, we see an increase in volatility but with no bias. It results in the formation of an ideal ‘Doji’ candlestick pattern with wicks on both sides and small body. Since the market did not collapse, we can conclude that the data was not damaging to the US dollar. From the trading point of view, we cannot enter for ‘buy’ even after the news release as technically, we need a retracement before we join the trend.

That’s about ‘Initial Jobless Claims’ and its relative news release impact on the Forex price charts. If you have any questions, please let us know in the comments below. All the best.

Categories
Forex Fundamental Analysis

Impact of Unemployment Rate On A Nation’s Economy & It’s Currency

Introduction

The unemployment rate is a fundamental indicator of macroeconomics. Before getting into defining the unemployment rate, let’s first understand what even unemployment is. Later, we shall get deep into understanding the unemployment rate and its effects on the economy and the currency (using price charts).

What Is Unemployment?

To put it in simple terms, Unemployment is a scenario where a person is constantly looking for work but is unable to find it. So, works are considered to be unemployed if they do not work but are capable and are willing to do so. This is a great factor in determining the health of the economy. And the measure of unemployment is what is termed as the unemployment rate.

Understanding Unemployment Rate

The unemployment rate can be defined as the percentage of unemployed workers in the total labor force, where the total labor force comprises of all the employed and unemployed citizens within an economy. Mathematically, it is the number of labor force divided by the number of unemployed people. And as mentioned, to be considered unemployed, the person must have an active history of them looking for jobs. So, if you’ve given up looking for a job or work, you will not be considered unemployed.

More about Unemployment

Unemployment is a vital economic indicator as it indicates the inability of the workforce to obtain work to contribute to the productive output of the economy. The simple implication of unemployment would be less total production than that could have been possible. Also, an economy with high unemployment would have lower growth output with disproportional fall in the requirement for basic consumption.

On the flip side of things, a low unemployment rate implies that the economy is producing goods almost at its full capacity, having a commendable output, and rising standard living standards. Talking it further, an extremely low unemployment rate would mean an overheating economy and signs for inflationary pressures. It could be a hard time for businesses that would be in need of additional workers.

Types of Unemployment

Now that the definition of unemployment is clear, let us go ahead and understand how economists have classified unemployment. Unemployment is broadly classified into two types, namely, voluntary and involuntary. Voluntary unemployment is the case when the person has quit the job voluntarily in search of another job. But, in the case of Involuntary unemployment, the person has been fired by the organization. Now, the person must look for other employment. Voluntary and involuntary unemployment can be further divided into four types.

  • Frictional Unemployment
  • Cyclic Unemployment
  • Structural Unemployment
  • Institutional Unemployment
Frictional Unemployment

Frictional Unemployment is the most obvious type of unemployment. This occurs when a person is in between jobs. When a person quits a company, it takes some time to search for a new job. However, this unemployment is typically short-lived. Moreover, this type of unemployment does not really cause problems for the economy. Frictional unemployment is something natural, as ideally, it is not possible to find a job right after a person leaves a job.

Cyclic Unemployment

Unemployment varies based on the cycles of the economy is termed as cyclic unemployment. During the course of economic growth and declines, there is variation in the number of unemployed workers. For example, during economic recessions, unemployment rises, and during economic growth, unemployment decreases.

Structural Unemployment

This type of unemployment causes due to the advancements in the technology, or the structure through which the labor markets operate. The technological advancements could be the automation of manufacturing or the use of automobiles in place of horse-drawn transport. Such things lead to unemployment because there is no requirement of labor for it.

Institutional Unemployment

The consequence of permanent or long-term institutional factors and incentives in the economy could be unemployment. Such unemployment is called institutional unemployment. Some of the factors leading to institutional unemployment include

Government policies
  • High minimum wage floods
  • Generous social benefit programs
  • Restrictive occupational licensing laws
Labor market phenomena
  • Efficiency labor
  • Discriminatory hiring
Labor market institutions
  • A high rate of unionizations

How the Unemployment Rate Affects the Economy

We know that the unemployment rate is a vital indicator, as it gauges the joblessness in an economy. This, in turn, gauges the economic growth rate as well.

The unemployment rate economic indicator is a lagging indicator. This indicator does not predict that the market is going to rise or go under recession, but it measures the effect of the economic events. Based on the event, this indicator makes a move. For example, the unemployment rate does not rise until the recession has officially begun. But, a point to note is that the unemployment rate continues to rise even after the recession starts to fade away.

There are two reasons for it. One of them is that the companies are reluctant to lay off their people when the economy takes a downside. For large companies, it might take a few months to come up with a layoff plan. Secondly, the companies are more reluctant to hire new workers until they have a confirmation that the economy has stepped into the expansion phase of the business cycle.

For example, during the well-known financial crises that happened in 2008, the recession actually began during the first quarter of the year. The US GDP had 1.8 percent. Until May 2008, the unemployment rate was 5.5 percent. But, when the recession came down, and the economy started to do well, the unemployment rate hit 10.2 percent in October 2009.

So, with this, we can entitle the unemployment rate as a powerful confirmation indicator rather than a lagging indicator. For example, if the other leading indicators are already showing an expansion in the economy, and the unemployment rate has started to decline, then you are confident that the companies are yet again going to hire people.

Unemployment Rate and its Impact on the Currency

As already discussed, unemployment signals the economic growth of a country. If the economy is doing is bad, then then the unemployment rate rises. And if the economy is growing fairly, the unemployment rate declines. When it comes to currency, it is proportional to the economic growth of a country. This, in turn, implies that unemployment is inversely proportional to the value of the currency.

Frequency of the release of the Unemployment rate

The unemployment rates are released by the Bureau of Labor Statistics on Friday of every month. Typically, the present values are compared with the previous month’s values. Sometimes, a year-to-year comparison is made as well.

Dependable Sources of Information 

With the list of sources mentioned below for different countries, one can obtain valuable statistical information on the unemployment rates. Specifically speaking, one can get a visual representation of the historical values over a period of as high as 25 years. Apart from that, users get access to information regarding the actual, previous, highest, lowest unemployment rates as well.

USD | CAD | CHF | AUD | JPY | EUR | GBP

How the ‘Unemployment Rate’ News Release Affects the Price Charts?

Now that we have a good amount of theoretical information on the Unemployment rate, let’s get a little technical. In this section, we shall analyze how the prices of the currencies are affected after the release of the reports.

As mentioned, the reports on the unemployment rate are released by the Bureau of Labor Statistics on a monthly basis, typically on Fridays. As a usual effect, it is said that the actual data less than the forecasted data is good for the currency.

Also, note that, as per sources (Forex factory), this news is expected to have a high impact on the currency. For our illustration, we have taken into account of the Unemployment rate of the US released on 7th February.

In the below image, we can see that the Actual percentage is 3.6%, which is 0.1% higher than the forecasted percentage (3.5%). Also, it is higher than the previous month’s value. So, we can conclude that the unemployment rate in the US has increased in February compared to January.

When it comes to the effect on the forex exchange market, we can expect the US dollar to drop as the unemployment rate has increased (which is not good for the economy).

Now, let’s see its effect on few USD charts by pairing it with other major currencies.

USD/CAD | Before Announcement – 7th February

Below is the candlestick chart of USD/CAD on the 15min timeframe. If we were to look at the recent trend, we could see that the market is in an uptrend. Now, we need to see if the trend continues after the release of the news or reverses its direction.

USD/CAD | After Announcement – 7th February

Below is the candlestick chart of USD/CAD on the 15min timeframe after the release of the news. The news candle is indicated as shown. We can see that when the news was released, the market just plunged down. Here, we can infer that the market moved as the way we expected it to move. Also, the volatility surged up when the news came out. If you look at the volume indicator as well, we can see that the volume shot up high.

However, in hindsight, the market recovered from the drop and left a wick on the bottom. With this, we can conclude that the drop in price was consumed by the strong buyers. The buyers did not let sellers reverse the market.

EUR/USD | Before Announcement – 7th February

In the below chart of EUR/USD, we can see that the market is in a downtrend, where the purple line represents the support and resistance line. Currently, before the release of the news, the market is in the S&R area. We need to see how the market will react after the news.

EUR/USD | After Announcement – 7th February

When the news was announced, we can see that the market went up, came down, and closed below the open price. There was strength from both sides, and the volatility was pretty high. If you look at the volume bar corresponding to the news candle, we can see that the volume too was high at that point in time.

In this currency pair, EUR is the base currency, and USD is the quote currency. According to the impact of the news, the market was supposed to shoot up. The market did try to go higher but got rejected by the sellers. So, basically, the seller’s market was more dominated than the news in this case.

 GBP/USD | Before Announcement – 7th February

GBP/USD | After Announcement – 7th February

Below is the chart of GBP/USD on the 15min timeframes after the release of the news. We can see that this chart is very similar to the EUR/USD chart. The news candle initially shot up, but came down and closed red. The volatility during this time was quite high, which can be inferred from the corresponding volume bar below. And according to the news, the market was supposed to go north, but the market continued its downtrend.

Bottom line

The unemployment rate, though a lagging indicator, should not be taken for granted. It is as vital as the other economic indicators such as GDP, inflation rate, interest rate, etc. Employment is one of the primary reasons for the economies do well. Economies with high unemployment rates are being hit hard. Coming to the investors’ and traders’ point of view, one must keep an eye on the rate of this indicator and treat it as a powerful confirmation tool rather than just a lagging indicator.